
Manuscript accepted on :
Published online on: 23-11-2015
Plagiarism Check: Yes
Ranna Jafari -Moghadam1, Parisa Ziarati*1, Mohammad Hossein Salehi-Sormaghi2, Mahnaz Qomi1
1Department of Medicinal chemistry, Pharmacy Faculty, Pharmaceutical Sciences Branch, Islamic Azad University, Tehran-Iran(IAUPS) 2Department of Pharmacognosy, Tehran University of Medical Sciences, Tehran-Iran
DOI : https://dx.doi.org/10.13005/bpj/593
Abstract
It has been reported that as much as 75% of the daily calorie intake of the people in some Asian countries is derived from rice Lead, cadmium and arsenic are from the prevalent toxic elements in food and environment that have a long half-life after the absorption in humans and animals can make unsought and unpleasant effects such as damage to internal organs, the nervous system, kidneys, liver and lungs. The present study investigated Heavy metal content in, imported rice on sale in Tehran (the most populous city of Iran) market, and assesses daily arsenic and cadmium intake from rice. To assess the levels of Zinc, Iron, Manganese, Nickel, Cadmium and Lead in imported raw rice 600 samples purchased randomly from 5 popular brands of recognized rice market in 2014. The samples were analyzed by wet digestion method and standardized international protocols were followed for the preparation of material and analysis of heavy metals contents and analyzed by Atomic Absorption Spectrophotometer in Research Laboratory in Pharmaceutical Sciences Branch, Islamic Azad University. Analysis of variance (ANOVA) was employed to detect significances among samples from different brands. Results were determined as mean ± SD of dry weight from three replicates in each test. The mean content of Nickel, Lead and Cadmium in 48.6%, 27.5% and 42.3% samples from Indian imported brands were over respectively, while Zinc, Manganese and Iron contents were below the maximum permitted levels for rice. ANOVA analysis showed that there was a significant difference in Cadmium and Nickel contents in different brands of rice samples (p<0.005). JECFA has set PTWI for the Cadmium at 7 mg/kg of body weight (WHO, 2004). The total dietary exposure levels of Lead, Nickel and Cadmium determined in this study were compared with the provisional tolerable weekly intakes (PTWLS) by the JECFA and showed higher than it. Regular monitoring of all rice varieties should be firmly continued.
Keywords
Imported Rice; Nickel; Cadmium; Lead; Contaminant; PTWLS
Download this article as:| Copy the following to cite this article: Jafari-Moghadam R, Ziarati P, Salehi-Sormaghi M. H, Qomi M. Comparative Perspective to the Chemical Composition of Imported Rice: Association of Cooking Method. Biomed Pharmacol J 2015;8(1) |
| Copy the following to cite this URL: Jafari-Moghadam R, Ziarati P, Salehi-Sormaghi M. H, Qomi M. Comparative Perspective to the Chemical Composition of Imported Rice: Association of Cooking Method. Biomed Pharmacol J 2015;8(1). Available from: http://biomedpharmajournal.org/?p=1368 |
Introduction
Rice, especially white rice, Oryza sativa L. is the staple food in the diet of various people including Asian countries (1,2). Rice is the second food in high consumption among Iranian people. Half of the world populations consume rice as their main food (3, 4). It is the commonest crop grown in agricultural lands in the north of Iran (5). Rice is the seed of the monocot plants (Oryza sativa), for example Asian rice or (Oryza glaberrima), for example African rice of the family, Graminaeae (grass family) (6). Environmental contaminants are chemicals that are present in the environment in which the food is grown, harvested, transported, stored, packaged, processed, and consumed. The physical contact of the food with its environment results in its contamination. Several factors may influence contaminant accumulation such as spices, level and duration of contaminant exposure, topography, agricultural field conditions, amending soil with compost made from municipal sewage sludge and potential bioaccumulation (7). In agricultural crops the main sources of heavy metal contamination are irrigation with contaminated water, metal based pesticides, industrial emissions, fertilizers and transportation, harvesting process, storage, and/or sale of crops (8, 9, 10). As rice is one of the major agricultural products on the national and international market (11), during last decades many researchers have reported heavy metal concentrations, especially for Pb,Cd, Cr and the other elements in rice grains from various countries such as Iran, India, China, South and North Korea, Taiwan and Turkey (7, 13, 14, 15,16,17). Daily consumption of rice in Asia countries ranges between 158-178 g/ person-day (7, 18, 19) Iranian people eat an average of 40 kg of rice every year (20) .Although Iran is eleventh producer of rice at the world with an annual production 2600000 tons in 2010, during the last years the demand for rice has considerably been increased in comparison with its production, as a result, currently Iran is known as one of the large-scale importer of rice countries (21).
In this study rice was observed for its special individual consumption as a staple food in Iran (18) and probable hazards of its heavy metal contents on population health. Rice variety, treatment of rice and diversity of cooking may affect elemental content and intake of heavy metals (2, 7, 11,12). This research builds upon:
- Determination and comparing heavy metals (Lead, Cadmium and Nickel) contents in 5 popular imported brand in raw rice
- Investigation the Effect of Cooking and heating processes in studied rice samples on their mineral and heavy metal contents (Mn, Zn, Fe, Pb, Cd and Ni).
- Apply the best cooking methods in order to avoid the side effects of heavy metals in edible an consumed rice.
- Assess the associated health risk posed to the population through exposure to heavy metals (Nickel, Cadmium and Lead) in imported rice.
Preparing method
A descriptive – analytical and cross-sectional study was conducted for determination of Lead, Nickel, Zinc, Manganese, Iron and Cadmium as heavy metals and essential mineral elements in 600 samples of mostly consumed imported rice samples in Iran in three consequent months in 2015 and all samples collected at the same time. For heavy metal analyses the explained method has been followed in 5 stages for : raw rice, rinsing ( 4 times washing) rice, soaking in NaCl solution (2%) for 2 hours , Boiling and the draining rice, cooked rice. The rinsing samples prepared by washing 4 times and in each step proportion of water and rice was 4:1 and for preparing of cooking rice bring the water to boil and then add 10 gram of oven-dried samples when the water has come to boil( rice is cooked in lots of water just like pasta) for 10 minutes then drain it in a colander and wash it by cold water just one time ( traditional method for preparing rice in Iran) (7, 22) and for preparing draining rice samples put the oven-dried samples into boiling water and then heating the plate for 10 minutes till the steam escape . All draining and cooking rice samples have rinsed 4 times then followed by the procedure.
Zinc, Manganese, Nickel , Lead and cadmium Determination
All glassware and plastic containers used were washed with liquid soap, rinsed with water, digested in 10% v/v of nitric acid for at least 20 hrs, cleaned thoroughly with distilled water and dried in such a manner to ensure that any contamination does not occur. For heavy metal analyses 50 gram of each sample was weighed and oven-dried at 600c to a constant weight.
Each oven-dried sample was ground in a mortar and passed through a 0.25 mm pore size 60 mesh sieve. A digestion mixture comprising of concentrated HNO3 (69% Merck and hydrochloric acid 37% Merck in the ratio of 3:1 v/v was used for wet digestion of the samples. Ten grams of powdered and oven-dried sample was weighed precisely on electronic balance (Shimadzu LIBROR AEX 200G). The samples were put in a 100 ml digestion flask and 20 ml of digestion mixture was added to it and heated on a hot plate in the fuming chamber. Blanks (10% v/v of nitric acid) and samples were also processed and analyzed simultaneously. This method has been followed in 5 stages for raw rice (untreated samples, rinsing rice, soaking in NaCl 2% for 2 hours, boiling- draining and cooked rice.
For the preparation of material and analysis of heavy metals contents by wet digestion method and atomic absorption spectrophotometry analysis based on annual book of ASTM standards and AOAC (23,24). All digested sample flasks were firstly heated slowly and then vigorously till a white residue is obtained. The residue was dissolved and made up to 10 ml with 0.1 N HNO3 in a volumetric flask. The samples were analyzed by a Flame Emission Spectrophotometer Model AA-6200 (Shimadzu, Japan) using an air-acetylene flame for mineral elements and heavy metals, using at least five standard solutions for each metal (23,24) , using at least five standard solutions for each metal. All necessary precautions were taken to avoid any possible contamination of the sample as per the AOAC guidelines (25).
Iron Determination
The aliquot was passed through the atomic absorption spectrophotometer to read the iron concentration. Standards were prepared with a standard stock of 10 mg/L using ferrous ammonium sulphate where 3 – 60 ml of iron standard solution (10 Mg /L) were placed in stepwise volumes in 100 ml volumetric flasks. 2 ml of hydrochloric acid were added and then brought to the volume with distilled water. The concentration of iron in the aliquot was measured using the atomic absorption spectrophotometer in mg/L. The whole procedure was replicated three times (24).
The external standard curves were constructed using reference standard to qualify the studied metal contents in all states of samples. Calibration curves were performed with five or six different concentrations. The square of correlation coefficients (r2) was 0.991, 0.997, 0.996, 0.993, 0.989 and 0.998 for Cd, Ni, Pb, Fe, Zn and Mn respectively.
Statistical Method
State differences on the basis of the states ( raw, rinsing, soaking, boiled-drained and cooked) of samples and different sates of cooking (Raw, Rinsed, Drained and cooked) were determined by student t-test. The changes were calculated by one way ANOVA and for analysis of the role of multiple factors univariate analysis was used by SPSS 17.Probability values of <0.05 were considered significant. Concentrations were expressed in terms of mg/Kg on a dry weight basis.
Risk Assessment
To evaluate the potential risk of rice consumption containing the heavy metals, Provisional Tolerable Daily Intake (PTDI) for a 60kg adult person was calculated by the following equation in which C is the heavy metal concentration in rice, Cons is the average consumption of rice in country (110g per capita per day) and BW is body weight of an Iranian adult person (60kg). The output was compared with the WHO/FAO and Iranian standard level.
PTDI = C × Cons / Bw
The Iran standard PTDI limits have been recommended for, Cd, Pb and As 0.001, 0.0036 and 0.0021mg/day/kg Bw, respectively (26).
Results and Discussion
The results of Cadmium, Nickel and Lead contents in 600 samples of raw, rinsing, soaking by NaCl 2% , boiling – drained and cooking rice samples are shown in figure 2. All concentrations are expressed as mg /kg DW. Results show that the mean content of Cadmium, Nickel and Lead in the most samples from samples is much higher than maximum levels set by national standard and FAO/WHO.
ANOVA analysis showed that there was a significant difference in Ni and Pb contents in Rinsing and raw and drained rice samples (p < 0.05 and p < 0.03 respectively). The minimum and maximum Pb content in rinsing and soaking rice and cooked rice was 0.563 in soaking Victoria rice by sodium chloride solution 2% ( after 2 hours ) and 3.084 (mg/kg DW) in raw baba-Noor Indian rice variety respectively . To clarify the status of the obtained concentration values better, the maximum allowable contents of metals in rice , we referred to the joint FAO/WHO and national standard. Expert Committee on Food Additives (JECFA) has proposed a maximum level of 0.2 mg/kg Cadmium in rice but the community warned that “ people who eat a lot of rice from regions containing the higher levels of cadmium could be significantly exposed” (27) .Iran Standard (No. 12968) has established the maximum limit of Cd in rice about 0.06mg/kg and on the whole Institute of Standard and Industrial Re-search of Iran set limit of 0.15 mg/ kg as the maximum level for lead and arsenic and 0.06 mg/kg for cadmium in rice (26). There were no permitted values available for the other heavy metals such as Nickel to be compared with those of the rice sample contents. The permissible limit of Nickel in plants recommended by WHO is 10mg/kg (28). The highest level of Ni occurred in cooked rice ( traditional method of cooking rice in Iran) in Baba-noor brand, while the least Nickel content observed in soaking Victoria rice . The mean content of nickel in soaking state of studied samples was 0.55 mg/kg but in raw samples was the maximum level , 078 mg/kg. Rinsing and soaking by salt decrease nickel content significantly (p ≤ 0.03).
Nickel has been considered to be an essential trace element for human and animal health. In living systems, it is associated with DNA and RNA molecules and also a regulatory element for the various enzyme systems (29). Drinking water and food are the main sources of exposure for the general population with the average American diet containing about 300 μg Ni/d (30).
The most common ailment arising from Ni is an allergic dermatitis known as Nickel itch, which usually occurs when skin is moist; furthermore Ni has been identified as a suspected carcinogen and adversely affects lungs and nasal cavities. Although Ni is required in minute quantity for body as it is mostly present in the pancreas and hence, plays an important role in the production of insulin. EPA has recommended daily intake of Ni should be less than1mg beyond which is toxic (31-33).
The results in this study revealed that the 27.5% mean of raw, rinsing, soaking, boiling – drained and cooked rice and polished rice samples had lead content above maximum level 0.15 mg/kg and only in Victoria samples ( in rinsing and soaking states ) the lead contents were lower than that. The values obtained for lead in cooked rice are slightly lower than the values obtained by boiled – drained in all brands. The majority of samples from the 2 most famous brands had detectable levels of lead much more above the permissible limit while the other ones especially Victoria brand had lower than it.
The mean concentrations of cadmium in all states were over than maximum level which is recommended by FAO/WHO Expert Committee on Food Additives and national standard , but in Victoria and Khatereh brand in rinsing, soaking , drained and cooked states the cadmium contents were below the maximum level of 0.06 mg/kg.
The Pb, Cd and Ni in Baba-Noor brand samples were much higher than limits of these heavy metals set by FAO/WHO and Iranian standards.On the Whole ANOVA analysis showed that there was a significant difference in Cadmium and Nickel contents in different brands of rice samples (p<0.005).
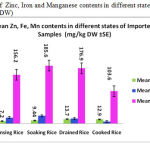 |
Figure 1: The mean of Zinc, Iron and Manganese contents in different states of studied Imported rice samples ( mg/kg DW) |
The mean contents of Fe, Mn and Zn in all states of studied samples were below the maximum permissible levels set by WHO/FAO. The highest level of mineral elements contents in drained rice were much higher than cooked rice and the differences were significant ( p ≤ 0.05). Regardless of samples’ origin and brands the Mn, Fe and Zn concentrations in different kinds of cooking rice were less than the standard levels.
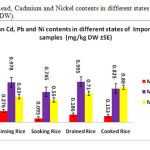 |
Figure 2: The mean Lead, Cadmium and Nickel contents in different states of studied Imported rice samples ( mg/kg DW). |
Risk Assessment
The daily intake of heavy metals through the consumption of the rice tested should be calculated according to the given equation:
Daily intake of heavy metals (µg/day) = [Daily rice consumption × rice heavy metal concentration]
The EDI values were compared with PTWI published by JECFA guidelines (34).For this comparison, EDI was multiplied by 7, the respective EWI (Estimated Weekly Intake) values in three treatments of rice have been calculated (Iranian daily rice dietary is 110g per capita (26).
The weekly intake of Cd, Pb and Ni only through rice in the treatments of raw, boiling- drained and cooked (Pilaw were less than the PTWI values recommended by WHO/FAO, but intakes of these heavy metals will increase with consumption of other foods such as vegetables, dairy products, meat, etc along a week. In this study cooking rice has reduced its rate of EWI in comparison by raw rice . For example the weekly intake of Cd from the raw rice was 91.02%
of PTWI, this percent decreased to 54.23 and 51.06 % of PTWI with consumption of drained rice and cooked respectively.
Conclusion
By the results of this research, we can say that the type of rice cooking affects heavy metals reduction especially Cd and Ni and more heavy metals such as chrome and arsenic should be followed by more brands and samples, because in most samples of the drained and cooked rice, the Pb content decreased though not significantly.
The mean content of Nickel, Lead and Cadmium in 48.6%, 27.5% and 42.3% samples from Indian brands were over respectively, while Zinc, Manganese and Iron contents were below the maximum permitted levels for rice. Anova analysis showed that there was a significant difference in Cadmium and Nickel contents in different brands of rice samples (p<0.005).
A significant positive correlation was found between Cd , Ni and Ni, Pb and Mn and Zn, and Fe and Zn. In contrast, there was a significant negative association between Zn and Ni. These results indicate that high Cd and Ni concentrations would likely happen simultaneously, and the same thing could occur for Pb and Ni. Moreover, the results indicated that Zn concentration would be lower in grain with higher Ni concentration.
Acknowledgement
Authors are thankful to Mrs Mahtab Alimardan, Mr. Amin Azariun and Parviz Raoufi , for his technical assistance. Financial Supports from Pharmaceutical Sciences Branch, Islamic Azad University (IAUPS) is gratefully acknowledged.
References
- Jung, M. C., Yun, S. T. , Lee, J. S. , Lee, J. U. Environ Geochem Health. 2005; 27 : 455.
- Ziarati, P., Azizi, N. . CONSEQUENCES OF COOKING METHOD IN ESSENTIAL AND HEAVY METAL CONTENTS IN BROWN AND POLISHED ALIKAZEMI RICE. International Journal of Plant, Animal and Environmental Sciences. 2014; 4(2): 280-287.
- Huang, S.Q., Peng, J., Qiu, C.X., Yang, Z.M. Heavy metal regulated new micro RNAs from rice. J Inorg Biochem. 2009; 103(2):282-7.
- Rabbani, D., Mostafaii, Gh.R., Dehghani, R., Gilasi, H., Hosein Abadi, Evaluation of Heavy Metals in Iranian and Non-Iranian Rice Supplied by Shopping Centers of Kashan , Iran. International Achieves if Health Sciences. 2015; 2(1): 25-9.
- Hoseini, M., Mafton, M., Karimian, N. A. , Ronaghi, A. M., Emam, Y. Iranian J Agricul Sci. 2005; 36(4) :869.
- Otitoju, G.T.O. , Otitoju , O., Igwe, C.J. Quantification of heavy metal levels in imported rice (Oryza sativa) consumed in the Northern Parts of Nigeria. Journal of Biodiversity and Environmental Sciences (JBES). 2014; 4( 4): 202-7.
- Ziarati, p., Arbabi, S., Arbabi Bidgoli, S. Qomi, M. Determination of lead and Cadmium Contents in (oryza sativa) rice samples of agricultural areas in Gillan- Iran. IJFAS 2013;2(11): 268-271. Available from: http://ijfas.com/ .
- Duran, A., Tuzen, M., Soylak, M., Trace element levels in some dried fruit samples from Turkey. International Journal of Food Science and Nutrition. 2007; 59: 581-589.
- Radwan, M.A., Salama, A.K. Market basket survey for some heavy metals in Egyptian fruits and vegetables. Food and Chemical Toxicology. 2006; 44: 1273- 8.
- Tuzen, M., Soylak ,M. Evaluation of trace element contents in canned foods marketed from Turkey. Food Chemistry. 2007; 102: 1089-1095.
- Jorhem, L., Astrand, C., Sundström, B., Baxter, M., Stokes, P., Lewis, J., Grawé ,K.P. Elements in rice on the Swedish market: 1. Cadmium, lead and arsenic (total and inorganic). Food Additives and Contaminants. 2007; 25(3): 284-294.
- Naseri, M., Rahmanikhah, Z., Beiygloo, V ., Ranjbar, S . Effects of Two Cooking Methods on the Concentrations of Some Heavy Metals (Cadmium, Lead, Chromium, Nickel and Cobalt) in Some Rice Brands Available in Iranian Market. Journal of Chemical Health Risks .2014;4(2):65–72.
- Bakhtiarian, A., Gholipour, M., Ghazi-Khansari, M. Lead and cadmium content of Korbal rice in northern Iran. Iranian journal of public health. 2001;30(3-4) : 129-132.
- Batista, B.L., Nacano, L.R., Freitas, R.D., Oliverira- Souza, V.C.D., Barbosa, F. Determination of Essential (Ca, Fe, I, K, Mo) and Toxic Elements (Hg, Pb) in Brazilian Rice Grains and Estimation of Reference Daily Intake. Food and Nutrition Sciences. 2012. 3, 129-134.
- Cao, H., Chen, J., Zhang, J., Zhang, H., Qiao, L., Men, Y. Heavy metals in rice and garden vegetables and their potential health risks to inhabitants in the vicinity of an industrial zone in Jiangsu, China. Journal of environmental sciences. 2010; 22(11): 1792-9.
- Jung, M.C., Yun, S.T., Lee, J.S., Lee, J.U. Baseline study on essential and trace elements in polished rice from South Korea. Environmental geochemistry and health. 2005 ; 27: 455-64.
- Lin ,H.T., Wong, S.S., Li ,G.C. Heavy metal content of rice and shellfish in Taiwan. Journal of food and drug analysis. . 2004;12(2): 167-74.
- Nogawa, K, Ishizaki, A. A comparison between cadmium in rice and renal effects among inhabitants of jinzu river Basin. Environ. Res. 1979;18: 410-420.
- Rivai, I.F., Koyama, H., Suzuk, S. Cadmium Content in rice and its intake in various countries. Bull Environ Contam. Toxicol. 1990; 44: 910-916.
- Nemati, S., Mosaferi, M., Ostadrahim,i A., Mohammadi, A. Arsenic Intake through Consumed Rice in Iran: Markets Role or Government Responsibility. Health Promot Perspect 2014; 4(2):180-186).
- Feizabadi, Y. Study of rice marketing sys-tem in Iran. 85th Annual Conference of the Agricultural Economics Society War-wick University; 2011 April 18-20.
- Ziarati, P., Azizi, N. Chemical Characteristics and Mineral Contents in Whole rice grains, Hulls, Brown rice, Bran and Polished Ali Kazemi Rice in Gilan province – North of Iran. Intl J Farm & Alli Sci. 2013; 2 (24): 1203-1209. Available in Site: http://ijfas.com/wp-content/uploads/2013/12/1203-1209.pdf.
- ASTM ,2000, Annual Book of ASTM standards, water and Environmental technology. Standard Guide for preparation of Biological samples for inorganic chemical Analysis, Vol. 11.01, D 4638-95a (Reapproved 1999).
- A.O.A.C. 2000. Official method of analysis 17th edition, Horowitz edition intern, Maryland, USA. Vol. 1& “; 452-456.
- AOAC ,1998, The association of analytical communities focuses on method validation and laboratory quality assurance. Official methods of analysis 16th edition, 4th revision. vol.1,chapter 9.).
- Organization INS. Food & feed-maximum limit of heavy metals, in 2013. Iranian National Standardization Organization; 2013. Available from: http://isiri.org/portal/File/ShowFile.aspx?ID=a02570df .
- WHO. 2004. Joint FAO/WHO Expert Standards Programme Codex Alimentations Commission. Geneva , Switzerland available in the : http://www.who.int. ).
- WHO., Permissible limits of heavy metals in soil and plants, (Genava: World Health Organization), Switzerland (1996).
- Roux, J. C. The evolution of ground water quality in france: Perspectives for enduring use to catchments in Mid – Wales. Journal of Hydrology, 1995;116, pp. 316 .
- Donald, G. Barceloux and Dr Donald Barceloux, California Clinical Toxicology, 1999;37(2) :239258 .
- Ziarati, P., Determination of Contaminants in Some Iranian Popular Herbal Medicines. J Environment Analytic Toxicol. 2012; 2:120. doi:10.4172/2161-0525.1000120. Available online :
- : Ziarati, P., Behbahani, P., Karbalaie Mohamad , N. Screening of Heavy Metal Contents in Heracleum persicum (Golpar) from Selected Markets in Tehran. 2012. 1:536 doi:10.4172/scientificreports.536. Available from: http://omicsonline.org/scientific-reports/2167-0412-SR-536.pdf.
- Ziarati ,P., Asgarpanah, J. Comparing Heavy Metal Contents of Panax Ginseng Samples from Selected Markets in Tehran and Beijing. J Environ Anal Toxicol . 2013; 3: 183. doi:10.4172/2161-0525.1000183.Available from: http://omicsonline.org.
- 34. JECFA, Summary and Conclusions of the Sixty-first Meeting of the Joint FAO/WHO Expert Committee on Food Additives, Rome, 10-19 June 2003.

