
Manuscript accepted on :
Published online on: 20-11-2015
Plagiarism Check: Yes
T. Karthikeyan and P. Manikandaprabhu*
PG and Research Department of Computer Science, PSG College of Arts and Science, Coimbatore, India
DOI : https://dx.doi.org/10.13005/bpj/613
Abstract
The technology of medical image processing has extensively involved concentration of relevant experts. Here, panoramic radiographic image is used for analysis. The proposed method consists of five stages namely preprocessing, segmentation, feature extraction, feature selection and classification. In the first stage, anisotropic filter is applied for extracting the noise for experimental image. In the second stage, canny based edge segmentation to segment the image. Then, Statistical texture features are extracted and PCA is the feature selection for the purpose of classification. Finally, the decision tree classifier is used to classify the type of IAN identification image. Thus, the proposed system has been evaluated on a dataset of 50 patients. The proposed system was found efficient in the classification with a success of more than 94% of accuracy. During the dental surgical or implantations, to identify IAN in damage or injury or damage is the main objective of this work.
Keywords
Classification; Decision Tree; Feature Extraction; Image Segmentation; Inferior Alveolar Canal; Inferior Alveolar Nerve; Panoramic Radiography
Download this article as:| Copy the following to cite this article: Karthikeyan T, Manikandaprabhu P. A Novel Approach for Inferior Alveolar Nerve (IAN) Injury Identification Using Panoramic Radiographic Image. Biomed Pharmacol J 2015;8(1) |
| Copy the following to cite this URL: Karthikeyan T, Manikandaprabhu P. A Novel Approach for Inferior Alveolar Nerve (IAN) Injury Identification Using Panoramic Radiographic Image. Biomed Pharmacol J 2015;8(1). Available from: http://biomedpharmajournal.org/?p=1058 |
Introduction
Medical demands have driven the fast growth of medical image processing methods, which in turn have significantly promoted the level of the therapeutic process. They have become essential tools for diagnosis, treatment planning, and verification of administered treatment. Therefore, the technology of medical image processing has long attracted attention of relevant experts. Nowadays, panoramic radiography is regularly used in dental practice, because it provides visibility of anatomical structures in pathological changes of the teeth, jaws and temporo-mandibular joints. Inferior alveolar nerve injury is one of the most severe complications in implant dentistry. This nerve injury can occur during local anesthesia, implant osteotomy or implant placement.
Inferior Alveolar Nerve (IAN)
Inferior Alveolar Nerve (IAN) is the core sensory nerve that provides sensory innervations to the lower teeth as well as the lower lip and some skin on the lower face. The IAN traverses the mandibular bone (lower jawbone) through a mandibular canal, or the inferior alveolar canal (IAC). As the IAN is to be found inside the IAC, it can be ultimately evaluated throughout radiographic evaluation of the IAC in Figure.1.
The IAC has a hollow tubular shape but is difficult to detect because its structure is not well defined and because it is frequently connected to nearby hollow spaces. Hence, accurate and automatic identification of the IAN canal is a challenging issue. Thus, the majority of earlier researches on the IAN canal detection [1] require users’ intervention such as a manual trace or the uses of the initial points of the IAN canal.
Inferior Alveolar Nerve injury (IANI) is the main problematical significance of dental surgical procedures and has major medico-legal implications [2]. These injuries results in partial or complete loss of sensation from the ipsilateral skin of the lower lip and chin, the buccal oral mucosa in this region, and the lower teeth. Causes of IANI include placement of dental implants, local anesthetic injections, third molar surgery, endodontic, trauma and orthognathic surgery.
Lingual Nerve (LN) and IAN injuries are considered to be suitable to mechanical irritations from surgical interference and are inclined by numerous demographic, anatomic and treatment-related factors [3]. Most patients who extend an IAN injury gradually get back to normal sensation over the course of a few weeks or months, depending upon the severity of the injury. However, after the most severe injuries, where part or all of the nerve has been sectioned and the site may have been compromised by infection, recovery will be incomplete. Fig. 2 shows some of the OPG images with and without visibility of IAC.
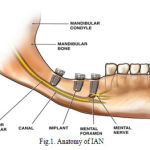 |
Figure 1: Anatomy of IAN |
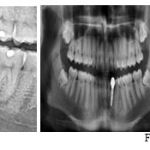 |
Figure 2: Sample OPG Images |
Panoramic radiograph
Panoramic radiograph is one of the types of dental radiograph. It is also called as orthopantomography (OPG) Image. Nevertheless, the fact that panoramic radiograph imaging is extensively used for assessment of the jaws, justifies the interest in determining the visibility of anatomical structures on these films. Number of radiologic technique had been applied to demonstrate different anatomical structures, the Oblique lateral demonstrates large areas of mandible, is the projection that produces an image of both jaws and their respective dentitions on a single extra oral film [4]. During the treatment planning, we can use OPG as a primary resource because it allows measurement of the two-dimensional association among the tooth and the IAC.
Panoramic equipment is based upon simultaneous rotation movement of the tube head and film cassette carriage in equal but opposite directions around the patient’s head which remains stationary. The patients were in erect position and were placed accurately within the machines using the various head positioning devices and light beam marker positioning guides. Patients were instructed not to move throughout the exposure [5]. Radiological prediction of injury to the IAN depends on the relationship of the root to the canal discussed in table 1[6].
Rood and Shebab[7] has defined seven vital recommendations that can be taken from OPG images in table 1. There have been several OPG assessement researches which maintain the effectiveness of these seven findings [8, 9]. It must be renowned, even if, that the statistical results from these analysis had various levels of specificity and sensitivity in table 2. Nowadays, research decided that high-risk signs were known by OPG in particular; darkening of the root is closely related to cortical bone loss and/or grooving of the root [9].
Table 1: Specificity and sensitivity for predicting IAN injury with third molar surgery in OPG image [8, 9]
| OPG Imaging procedure | Sensitivity (%) | Specificity (%) |
| Darkening of the root | 32-71 | 73-96 |
| Interruption of the canal | 22-80 | 47-97 |
| Diversion of the canal | 3-50 | 82-100 |
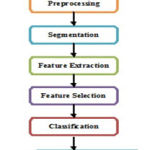 |
Figure 3: Proposed Methodology |
A general framework for this fully segmentation system in accordance with the block diagram shown in Fig. 3 is as follows:
- Preprocessing
- Image Segmentation
- Feature Extraction
- Feature Selection
Classification
Table 1: Radiological Prediction of Injury to the IAN: Depends on the relationship of the root to the canal [6, 7].
| Related, but not involving the Inferior Alveolar Canal | Related to changes in Inferior Alveolar Canal | Related with changes in Inferior Alveolar canal |
| Close proximity of the root to the canal, but intervening bone separates the both
· Separated · Adjacent · Super imposed Trace the outline of the root as well as the canal, which will show no disturbance. |
1. Darkening of the root (radioluscent)
2. Dark and bifid root 3. Narrowing of the root 4. Deflected root a. Density of the root is altered, when the root impinges on the canal. b. When the canal crosses the root apex, it can be identified by the double periodontal membrane shadow of the bifid root apex c. If sudden narrowing of the root is noted where the canal crosses, it indicates the deep grooving or perforation of the root or involvement of the root with the canal. d. The root may be seen deflected buccally, lingually or mesially, distally, when it reaches the canal. |
|
Preprocessing
Preprocessing consists of removing low frequency surroundings noise, normalizing the intensity of the individual element images, removing reflections, and masking segment of images. Anisotropic filter [10] is used to remove the noise of the surrounding and thus preserving the boundary points in the image. The acquisition system corrupts OPG images by generating noise. In order to improve the image quality of an anisotropic, filtering is applied. This technique applies a simultaneous filtering and contrast stretching. During filtering in the homogenous zone, anisotropic filter preserves the edges of objects [11]. In fig.4 shows the OPG image after preprocessing.
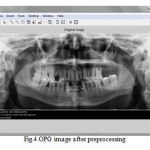 |
Figure 4: OPG image after preprocessing |
Image Segmentation
Edges are revealed to identify the discontinuities in the image. Edges on the region are traced by identifying the pixel value and it is compared with the neighboring pixels [12]. In edge based segmentation, there is no need for the detected edges to be closed.
Edges are the discontinuities in the sense of intensity, which gives us a layout of an object. All objects in the image are traced when the intensities are calculated accurately [13].
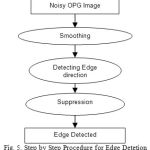 |
Figure 5: Step by Step Procedure for Edge Detetion |
In Canny edge detection procedure for segmentation shows in Fig.5, which is as follows:
- To diminish the effect of noise, the exterior of the image is smoothened by using Gaussian convolution.
- Sobel operator is applying to the image to detect the edge directions and edge strength.
- The edge directions are taken into considerations for non-maximal suppression.
- Finally, removing the broken edges. If the pixel value is higher than the threshold then, it is treated as an edge or else it is discarded [14].
The improvement of this method is retrieving information from the weak boundary too [15]. There will be some gap between the edges as it is not closed. So, the gap is filled by edge linking. The broken edges are extended in the direction of the slope for the link to get the connectivity for segmentation [16].
The merge split algorithm [17] is fitting to its use of criterion based on the variation among the maximum and minimum pixel values in the region tends to perform like an edge detection algorithm. The edges are only areas where huge variation in pixel data tends to arise in smooth and low gradient images. As a result near the edges, merge and split algorithm tends to split blocks down to individual pixels.
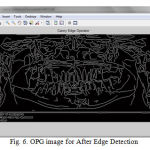 |
Figure 6: OPG image for After Edge Detection |
Feature Extraction
In this stage, various statistical features are derived from the segmented image for classification [18]. But it is a challenging task to extract a good feature set for classification. GLCM features are based on the joint probability distribution of matchup of pixels. Distanced and angle ө within a given neighborhood are used for computation of joint probability distribution between pixels. Normally d=1, 2 and ө=00, 450, 900, 1350 are used for computation [19]. In our proposed system the following GLCM features are extracted:
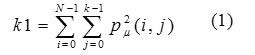
Energy (k1) which expresses the repetition of pixel pairs of an image,
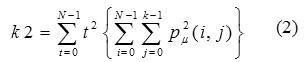
Local variations (k2) which present in the image is calculated by Contrast. If the contract value is high, the image has large variations.
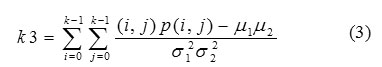
Correlation (k3) is a measure linear dependency of grey level values in co-occurrence matrices. It is a two dimensional frequency histogram in which individual pixel pairs are assigned to each other on the basis of a specific, predefined displacement vector.
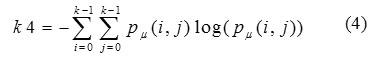
Entropy (k4) is a measure of non-uniformity in the image based on the probability of Co-occurrence values. It also indicates the complexity of the image.
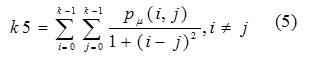
Homogeneity (k5) is inversely proportional to contrast at constant energy whereas it is inversely proportional to energy.
Feature Selection
The principal component analysis (PCA) and independent component analysis (ICA) are two well known tools for transforming the existing input features into a new lower dimensional feature space. In PCA, the input feature space is transformed into a lower dimensional feature space using the largest eigenvectors of the correlation matrix. In the ICA, the original input space is transformed into an independent feature space with a dimension that is independent of the other dimensions.
PCA [20] is the most commonly used subspace projection technique. These methods give a suboptimal result with a low computational cost and computational complexity. In the given set of data, PCA finds the liner lower-dimensional representation of the data such that the variance of the reconstructed data is preserved. Using a system of feature reduction based on PCA limits the feature vectors to the component selected by the PCA which leads to a well-organized classification algorithm. So, the main idea behind using PCA in our approach is to reduce the dimensionality of the texture features which results in a more efficient and accurate classifier.
Classification
This classification algorithm [21] is based on a decision tree. A decision tree [22] is a set of simple rules. It is also nonparametric because they do not need any assumptions about the allocation of the variables in each group. Every interior node contains a decision criterion depending only on one feature. For the first split into two parts, the feature with the highest importance is used. This procedure is recursively continual for each subset until no more splitting is possible. After such a decision, the next feature is found; this splits the data optimally into two parts [23]. All non terminal nodes contain splits. If followed from a root to a leaf node the decision tree corresponds to a rule-based classifier. An advantage of decision tree classifiers is their simple structure which allows for interpretation (most important features is near the root node) and visualization. A decision tree is built from a training set which consists of objects, each of which is absolutely described by a set of attributes and a group label.
Attributes are a collection of properties containing all the information about one object. Unlike classes, each attribute may have either ordered (integer or a real value) or unordered values (Boolean value), here the class is associated with the leaf and the output is got from the tree. A tree misclassifies the image if the class is labeled. The proportion of images is correctly classified by the tree is called accuracy and the proportion of images incorrectly classified by the tree is called error.
In our proposed system classification has two divisions: i) training stage and ii) testing stage. In the training stage, various features are extracted from the IAN identified and not identified images. In testing stage, based on the knowledge base, the classifier classifies the image into IAN identified and not identified images.
Experimental Results and Discussions
The proposed method has been implemented using the Matlab environment. The proposed system has been tested on dataset of real OPG images collected from the dental surgeons. Consisting of normal and IAC damaged OPG images. Table 3 shows the summary of Experimental data of OPG image.
Table. 3. Summary of Experimental Data.
| Patient Age (Years) | Number of Patients | Data Dimensions | Sex |
| 10 – 75 | 50 | 1024 X 564 X 24 | Male – 28
Female – 22 |
From the experimental data for analysis, I took patients age between 10 and 75. The taken image dimensions are 1024 x 564 in 24 bit depth. The total sample image is 50; it contains 28 male and 22 female OPG images. In the proposed system, experimental results are compared to medical expert results with proposed system results.
Table 4: Comparison of proposed algorithm with the manual classification done by the medical experts.
| IAN Identification | Medical Experts (%) | Proposed System (%) |
| Not Identified | 8 | 6 |
| Partially Identified | 36 | 30 |
| Clearly Identified | 56 | 64 |
Above the experimental data in table 4, I got the following results.
- Not identified in IAN from medical experts 8%, but the proposed system has 6% only.
- Partially identified in IAN, 36% for medical experts and 30% for the proposed system.
- Clearly identified in IAN, 56% for medical experts, 64% for proposed system.
The total number of partial and clearly identified IAN is 92% for medical experts and 94% for proposed system. Comparatively, the proposed system clearly identified IAN is 8% more than medical experts. So, the proposed system has improved accuracy of IAN identification then medical experts. Fig. 7 shows the graphical representation of medical expert results with proposed system results.
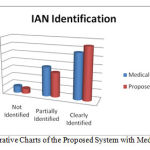 |
Figure 7: Comparative Charts of the Proposed System with Medical Experts |
Parameter for Performance Evaluation
The evaluation of IAC detection in different images is carried out by the following metrics [23]. Sensitivity is a measure which determines the probability of the results that are true positive such that a person has an injury. Specificity is a measure which determines the probability of the results that are true negative such that a person does not have an injury. Accuracy is a measure which determines the probability that shows how many results are exactly classified.
Sensitivity = TP/(TP+FN) (6)
Specificity = TN/(TN+FP) (7)
Accuracy = (TN+TP)/(TN+TP+FN+FP) (8)
Where, TP stands for True Positive, TN stands for True Negative, FN stands for False Negative and FP stands for False Positive. The obtained experimental results from the proposed technique are given in table 5.
Table 5: Comparison of proposed results with Existing System.
| Prediction | Sensitivity (%) | Specificity (%) |
| Interruption of canal [8,9] | 22-80 | 47-97 |
| Proposed System | 50-80 | 72-98 |
Conclusion
In the proposed system, we have developed a robust identification and classification of IAN injury images. It consists of five stages, preprocessing, segmentation, feature extraction and classification. In the pre-processing stage, the input image is resized and reduces the noise using anisotropic filter. In the second stage, the canny edge based segmentation with merge split algorithm is used to segment the IAN canal region from the enhanced image then various textures and intensity based features are extracted using second order GLCM. Finally, classification is done on the experimental image into IAN identification and not identified using decision tree. Our proposed method is evaluated using the metrics sensitivity, specificity and accuracy. Our proposed system has found efficient in classification with a success of more than 94% of accuracy from medical experts. During the dental surgical or implantations, to identify IAN in damage or injury or damage is the main objective of this work.
Acknowledgement
I thank Dr. R. Prakash MDS., Consultant Endodonist and Dental Surgeon, MSR Tooth Clinic, Madurai for his constant support and valuable suggestions for knowing about the IAN injury. I also extend my hearty thanks to Flash Dental Scans, Madurai for making necessary facilities to provide the radiograph image collections for my research work.
References
- Modi, C. K., Desai, N. P. A simple and novel algorithm for automatic selection of ROI for dental radiograph segmentation. In: 24th IEEE Canadian Conference onElectrical and Computer Engineering (CCECE), 2011; 504-507.
- T. Minimising and managing nerve injuries in dental surgical procedures. Faculty Dental Journal. 2011; 2(4):164-171.
- Leung, Y., Cheung, L.K. Risk factors of neurosensory deficits in lower third molar surgery: an literature review of prospective studies. Int J Oral Maxillofac Surg, 2011; 40:1-10.
- Stewert, A. A., Whitley, C. S., Graham, Hoadley, A. D., Moore, Chrissie W. A. (ed): Clarks positioning in radiography, 12th edn, London: Hodder Arnold, 2005.
- Whaites, E., Nicholas D. (ed): Essentials of dental radiography and radiology. Elsevier Health Sciences, 2013.
- Malik, N. A. (ed): Textbook of Oral and Maxillofacial Surgery, 2nd edn, New Delhi: Jaypee Brothers Medical Publishers (P) Ltd,
- Kim, H. G., Lee, J. H. Analysis and evaluation of relative positions of mandibular third molar and mandibular canal impacts.Journal of the Korean Association of Oral and Maxillofacial Surgeons, 2014; 40(6): 278-284.
- Harada, N., Vasudeva, S. B., Joshi, R., Seki, K., Araki, K., Matsuda, Y., Okano, T. Correlation between panoramic radiographic signs and high‐risk anatomical factors for impacted mandibular third molars. Oral Surgery, 2013; 6(3): 129-136.
- Kim, W., Cha, I.H., Kim, S.J., Kim, M.R. Which risk factors are associated with neurosensory deficits of inferior alveolar nerve after mandibular third molar extraction?. J Oral MaxillofacSurg, 2012; 70: 2508-2514.
- Weickert, J. (ed): Anisotropic diffusion in image processing. 1st edn. Stuttgart: Teubner, 1998.
- Jayachandran, A., Dhanasekaran, R. Severity Analysis of Brain Tumor in MRI Images Using Modified Multi-texton Structure Descriptor and Kernel-SVM. Arabian Journal for Science and Engineering, 2014; 39(10): 7073-7086.
- Gomez Moreno, H., Maldonado Bascon, S., Lopez Ferreras, F. : Edge detection in noisy images using the support vector machines. In: Connectionist Models of Neurons, Learning Processes and Artificial Intelligence, Berlin Heidelberg: Springer, 2001; pp. 685-692.
- Yogamangalam, R., Karthikeyan. B. Segmentation Techniques Comparison in Image Processing. Int. J Engg Tech. (IJET), 2013; 5(1): 307-313.
- Canny, J.F. A computation approaches to edge detectors. IEEE Trans. Pat. Anal. Mach. Int, 1986; 8:34–43.
- Li, D., Zhang, G., Wu, Z., Yi, L. An Edge Embedded Marker-Based Watershed Algorithm for High Spatial Resolution Remote Sensing Image Segmentation, IEEE Trans Img. Proc. 2010; 19(10): 2781-2787.
- Shih, F.Y., Cheng, S. Adaptive mathematical morphology for edge linking. Info. Sci, 2004; 167(1): 9-21.
- Shi, J., Malik, J. Normalized cuts and image segmentation. IEEE Trans Pattern Analysis and Machine Intelligence, 2000; 22(8): 888-905.
- Haralick, R. Statistical and Structural Approaches to Texture. Proc. IEEE, 1979; 67(5): 786-804.
- Gelzinisa, A., Verikasa, A., Bacauskienea, M. Increasing the discrimination power of the co-occurrence matrix-based features. Pattern Recognition, 2004; 40: 2367–2372.
- Karthikeyan, T., Thangaraju, P. PCA-NB algorithm to enhance the predictive accuracy. Int. J. Eng. Tech, 2014; 6(1): 381-387.
- Karthikeyan, T., Manikandaprabhu, P. Analyzing Urban Area Land Coverage Using Image Classification Algorithms. Computational Intelligence in Data Mining-Vol. 2, Smart Innovation, Systems and Technologies, Springer India, 2015; 32: 439-447.
- Sundararaj, G. K., Balamurugan, V.: An expert system based on texture features and decision tree classifier for diagnosis of tumor in brain MR images. In:IEEE International Conference on Contemporary Computing and Informatics (IC3I), Mysore, India. 2014; pp. 1340-1344.
- Zhu, W., Zeng, N., Wang, N.: Sensitivity, Specificity, Accuracy, Associated Confidence Interval and ROC Analysis with Practical SAS Implementations. In: NESUG Proceedings: Health Care and life Sciences, Baltimore, Maryland, 2010; pp. 1-9.

