
Manuscript accepted on :
Published online on: 09-11-2015
Plagiarism Check: Yes
Amirasad Pouraskariyan Kermani1, Laleh Abbaslu1, Seyed Ramin Alizadeh Shahi2
1M.A Student of Technology Management, School of Management, University of Oloom Tahghighat Sirjan, Iran. 2M.A of Industrial Management, School of Management, University of Tehran,Tehran, Iran
DOI : https://dx.doi.org/10.13005/bpj/602
Abstract
The objective of this research is to present an application model to plan the operations and to control the orders (the case study: profile door and window manufacturing (upvc)). The method applied in this paper is the field study. The measurement tools have been analyzed via investigating and analyzing the existing evidences, observations and interviews, and also taking use of the scientific models associating with the inventory control. This research has been in a way that primarily the mostly used raw materials in the year 2009 are determined and 6 items of the raw materials which included almost 94% of the warehouse inventory were chosen as the sample via ABC classification. Then, using EOQ formula the optimum amount of the order and using the ROP formula the reorder point and the precautious storage (Ss) have been calculated in the confidence level of 95%. In the next step the secondary optimization was performed on the basis of the order period system and finally the approach concerning the suggested model has been presented in order to plan and control the inventory of the items for the future period. The total results achieved imply that doing optimization, the total cost reduces considerably, and the possibility of not facing the deficiency of raw materials has an increase of 15%. Also the order status turned from the current system to the optimum system
Keywords
application model; operation planning; orders control; profile door and window manufacturing (upvc); the economical rate of the order
Download this article as:| Copy the following to cite this article: Kermani A.P, Abbaslu L, Shahi S. R. A. A Model to Plan the Operations and Control the Orders (the Case Study: Profile Door and Window Manufacturing (Upvc)). Biomed. Pharmacol. J.;8(1) |
| Copy the following to cite this URL: Kermani A.P, Abbaslu L, Shahi S. R. A. A Model to Plan the Operations and Control the Orders (the Case Study: Profile Door and Window Manufacturing (Upvc)). Biomed Pharmacol J 2015;8(1). Available from: http://biomedpharmajournal.org/?p=481 |
Introduction
Of the important and fundamental duties in industrial units is the proper planning in monitoring the inventories. And the inventory control is considered of the controversial issues in industry. The costs related to the inventory has made elaborate problems while on the other side the countries which are industrially enhanced are, more or less, involved with the difficulties rooting from the inventories of the companies. In general, the management of the inventory control system is of a great importance in all both third world and advanced countries. Today the experts of the management science have agreed that a huge percentage of the total capital of a company is taken from the inventories of the organization. Planning and controlling the inventories is almost the general problem of most companies in each part of the economy. There are diverse reasons concerning the significance of planning and controlling the inventory performed by organizations. The profile door and window manufacturing (upvc)), Tehran as the biggest manufacturer of the paper in Iran is not only supplying the demands inside the country but also is seeking the way to export its products to other countries of the region. Therefore, it is more necessary to control its inventory. The main problem taken care in this research, is how we can determine the measures to order the raw materials to be economic and how we can determine the reorder and precautious point so that we will not face the lack of raw materials confidently. Currently, in the mentioned company the measures to order the raw materials are made via the experts in the department of inventory control. In the present system the measure and the time to order the raw material is empirical and not accurate as in scientific predictions. The results have implied that optimizing the total cost has reduced, and the possibility for not facing the raw material defficiency has increased to about 15%. Also, the orders have turned from the existing mode to an optimized system. (Haj Shir Mohammadi 2004).
Total planning
The procedure to set the total policies of the organization in applying the capacity of the operating system and fulfilling the demand as economic as possible, during a special period. The manager must be aware of the capacity related to each production section to choose the method which is most economic in order to be profitable for the organization along with being clear with the time and setting the time.
The objectives of the total planning
- Supplying the demands, considering the limitation in the resources
- To reduce the production cost
- To keep the human forces of the organization
- To plan the load for machinery
- To set the priorities to make the orders
- To make the orders in the order they are received.
- The shortest time to make the orders
- To do the orders considering the cost to operate the machinery (Fatemi Qomi 2002).
The types of planning
- Expertise: including the production and human resource planning.
- Operational (performs the executive and short term programs of the organization)
Strategic (performs the long term goal of the organization)
Planning
- Inside to outside
- Outside to inside
- Up to down
- Down to up
Inside to outside: the actions presently done by the organization through which the whole power of the organization is in the order to use the optimum resources inside the organization. (they consume the resources inside the organization to have the highest production and do not care the outside).
Outside to inside: firs the outside are is investigated along with the threats and the opportunities determined, thereafter, the planning is performed on the basis of the investigation. (The inside demands are identified and then the production resources are supplied.
Up to down: planning is done in extreme levels and dictated to the lower levels.
Down to up: the ideas are transferred to the executive manager and after being reviewed they are sent and confirmed by the higher level manager of the organization and there is more motivation to perform (Teng 2009).
Production planning: to give the product and production to the market according to the supply and to provide the human resources needed.
Definition of the Inventory
The inventory is all raw material and objects consumed in the production or distribution process. The items such as the raw materials, the purchased pieces, the items in the process of being manufactured, and the final products are considered as the most crucial inventories used in the production and distribution process. The have been diverse other definitions for the inventory mentioned as follows:
- The inventory includes the items, raw materials, and pieces consumed in production, sale and managing the industry.
- The most comprehensive definition for the inventory is the definition given by the Official Audit Institute of the US, which includes the perceivable and unperceivable capital of an institute which :
- is kept to be sold in the usual marketing process of the institute,
- Is in the production process in order to manufacture and dell the product.
- Is in the production or vendible and presentable services to the customer. (Behzadian 2004).
The inventory control of warehouse
Independent demand: the demand we are not aware of its way of being ordered and the time and the factors which make the demand are not completely under our control. Such as printing matters in polling days.
Dependent demand: the time and the amount of the order are clear and the factors which have made the order are under our control. Such as the circulation matters of a journal in each month.
Note: in independent demand the inventory may not comply with the demand rate, while in dependent demand this does not happen.
Raw material management: the duties of the management include the activities around ordering, receiving and delivering goods and pieces. The objective of the raw material management system: is to make sure about the existence of items and raw materials needed in a special tie and place, as the total cost is kept minimum and the raw material management can keep its raw material and take its orders in the lowest cost.(minimizes the cost to keep the raw material).
Three storage cost types
- The storage cost (Keeping the raw materials)
- The cost of ordering raw material
- The deficiency cost The cost related to the lack of raw material happens when there are unpredictable orders and there is no raw material in the store, therefore, we face a lack of raw materials.(Gaur 2008).Inventory control system
Storage cost: the most important cost for keeping items in the warehouse is the cost dealing with the time lost because of the capital which is in the warehouse. Meaning that the capital considered as the inventory of the warehouse is costly as long as it is used. This cost equals the output of the capital in the investment of the inventory. (Renting the warehouse, the salary of the stock clerk, insurance and tax, depreciation, the spoilage of the raw materials, and being damaged, being robbed).
The fixed cost of the warehouse: this cost is ineffective as far as the warehouse has enough capacity to store raw materials. The fixed cost is defined like the rent pay.
The variable cost: depends on the inventory of the warehouse.
The cost of ordering items and raw materials: does not depend on the amount of order in each step, but depends on the number of the orders in each period.
(Annual) in other words, in the number of the orders rises in a period the cost to order increases followingly, and also the decline in the number of the orders in a special period will lead to a decrease in the ordering cost in that special period.
The deficiency cost: the cost resulted from the deficiency of raw materials and items needed. When not being able to manage the warehouse and therefore cannot fulfill the customer’s need. Including the costs made due to the lack of a raw material and item and when needed. (It is hard to calculate this kind of cost, so it is estimated). (Berling 2005).
The inventory control system: makes the balance between the three costs, the storage cost, the raw material order and the deficiency. The deficiency cost shows itself in two ways:
- Cancelling the customer’s order due to lack of raw materials in the warehouse.
- The supply cost of the needed item. (Theraw materials are bout in a higher cost in order to keep the customer).
The inventory control system
- The inventory control system ABC
- The inventory control system EOQ (Economical order quantity)
The inventory control system ABS (the value of the stored raw materials)
In this method the raw materials are valuated, meaning that the raw material management must make the balance between the storage, order and the deficiency. The management must increase or decrease the inventory of the warehouse n the basis of the existing raw material in the warehouse. In this system the raw materials in the warehouse are classified into three groups on the basis of the value. In this system generally a minority of the raw materials takes the major value inventory and the majority of the raw material takes the low value of the inventories in the storage. In the ABC control system, the raw materials are managed on the basis of the real value of the raw materials existing in the warehouse.
The EOQ (Economical order quantity) control system: in this system the amount of the order in each step is as much as the costs related to ordering, keeping and deficiency are kept in its minimum level. (Hosseini 2000).
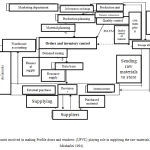 |
Figure 1 : The units involved in making Profile doors and windows (UPVC) playing role in supplying the raw materials. (Alvani, Mirshafiei 1994). |
The hypotheses
- The Economic Order model reduces the costs of the inventory control system.
- The Economic Order model increases the confidence level of the inventory control system.
Methodology
Then the summary of the turn over of the main and supplementary raw materials of the year including the cost and the amount of the raw materials used was received from the accounting unit of the warehouses which were about 60 items. Among these 60 items, 15 items did not taken in use at all in the year 2009 which were kept aside and the remaining raw materials consisted of 45 items which were used frequently. Using the methods mentioned above and the software EXCEL 2007 these 45 items were classified in ABC method and the results have been shown in the following table. Then the items A and B, constituting 90% of the value associated with the inventory of the warehouse and including 6 items were selected as the statistical universe. And Q (the quantity of the order in each time) was extracted. Then it was referred to the industrial accounting unit, and the prorated costs were taken from the supplies and warehouse unit to calculate the cost of the orders and keeping. After the necessity calculations, the cost to order for each raw material in each time (Co) and the cost to keep each item (Ch) were attained.This model was taken in use because it has been used extensively by researchers, since Harris introduced EOQ in the year 1913. Chorpa & Lawjoi (2004) believe that this model is indeed of the first milestones in the books and the executive researches. (Buzacott 2005).
Table 1 : The brief ABC analysis
|
Group |
The percentage | The annual value in Riels |
The annual accumulative |
| a | 73.66 | 272,418,000,820 | 73.66 |
| b | 16.48 | 68,636,714,563 | 90.14 |
| c | 9.86 | 36,552,775,697 | 100.00 |
After this step for all items ROP,Ss,TC*,TC,Q*,Q were calculated for each in the confidence level of 95% and since has lead to an improvement in the total cost, which means the rate of TC* has had a significant decline compared to TC and according to the distance between Q* and ROP and also ETC (the total cost in consideration with owning precautious savings) was calculated for all items of a and b presented in tables 3,4 and 5.
Although this step of optimization has considerably reduced the costs and increased the confidence to system, since the economic distance between the orders (N*) has taken a domain of 3 to 57 days, it may lead to the confusion of inventory control unit and can not find the necessary arrangement to perform the orders of the raw materials. Hence, table 4 has been optimized on the basis of the order period considering the intervals of 5-15-60 days and the results have been shown in table5. To calculate the reorder point and the precaution storage in the confidence level of 95%, since the demand is the variable and the delivery time is fixed as 7 days for internal raw materials and 90 days for external raw materials, the reorder point was calculated. Finally the capability of the system confidence has risen from 80% to 95 % (on the basis of the statements of the experts of Statistics Corporation and the existing calculations).
Data Collection Method
In this research, since the objective is to present a proper model to control the inventory of the raw material in door and window making profile (upvc) of Tehran, the way it reduces the costs and increases the confidence level, mostly the data related to this issue was reached via documents. Thus, doing field studies to collect quantitative data and referring to the existing documents the data concerning the studied items and the data needed have been gathered.
Data Analysis
In the first step all items (raw materials) used in producing paper in the industry of profile door and window manufacturing (upvc), Tehran, were examined among which 15 items of the inventories were never used in the year 2009 which is because the inventory of the previous year did not suffice the production and there was no need to buy new raw materials in 2009, and the other items were classified in ABC form via the software EXCEL 2007, in this classification around 94% of the raw materials were in groups A and B, which were chosen as samples in this paper.
Tow major reasons are implied for this:
- Although groups A and B included 6 items in terms of the quantity, about the Rial value has almost 94% of the inventory of the warehouse. So it is logical to make accurate plans about these items.
- On the basis of the assessments by experts the most important raw materials use d in the profile door and window manufacturing company(upvc) were these 6 items and the other items had little or no use and has the regulatory role . the arrangement of the raw material in the tables is on the basis of ABC classification.
After this step, the other steps have been taken on the basis of the explanations of the further tables, and the current status of the raw materials has been stated in table2.
Table 2: The current status of the inventory control system in profile door and window manufacturing industry (upvc), Tehran
| No. | 1 | 2 | 3 | 4 | 5 | 6 |
| Item number | 26 | 28 | 29 | 35 | 15 | 30 |
| The name | Glass | confirmatory horrent | handle | Making waterway | confirmatory galvanization | Tools |
| Annual consumption | 300398568 | 11129900 | 25337035 | 8043550 | 4969680 | 1544080 |
| Cost per unit (Rials) | 760 | 8437 | 1591 | 1446 | 2331 | 5820 |
| Cost of each order | 52263547 | 258133046 | 169612 | 250440 | 641165 | 24703420 |
| Maintenance cost | 163 | 1814 | 342 | 311 | 501 | 1251 |
| The rate of each orther (Kilograms) | 8344406 | 4909243 | 11465 | 20981 | 23173 | 690920 |
| Annual number of orders | 36 | 3 | 1960 | 383 | 149 | 3 |
| C0 | 18814887 | 774399138 | 332438658 | 95918330 | 95533623 | 74110259 |
| Ch | 3548935058 | 131172030 | 298610976 | 94797687 | 58570428 | 18197837 |
| TC(Rials) | 5430422759 | 905571168 | 631049634 | 190716017 | 15410405 | 62308096 |
The data related to the fourth line (the annual consumption) and the fifth line (the cost of each unit) has been achieved using the card of each item in order department and inventory control and industrial accounting, respectively. In the sixth line the cost of each order has been calculated for the mentioned items and also in the seventh line the cost to keep the studied raw materials have been calculated and stated. Form the eighth to tenth line the cost of the total order, the keeping cost and the total cost of the system has been calculated and stated, respectively.
The confidence level of the inventory control system
Of the important factors in the inventory control system is to make sure about the process of the system. Meaning that, how sure we are about the product to enter the process of the production when a raw material is ordered. We have, at first, reviewed the confidence level of the optimum mode in profile door and window manufacturing (upvc), Tehran. To determine the confidence level of the present policy the following formula has been taken in use: (Qeraati 2010)
The total number of the orders/ the number of the positive inventory= the confidence level of the system.
The number of the positive inventory is the number of the times in which there is inventory until the next order.
For instance if a raw material is ordered 50 times during a year and there has not been deficiencie of 4 times, the confidence level of the inventory is 80%. 80%=100*0.8=5.4.
According to the mentioned method the confidence level of the 6 items was calculated in this paper, presented in the following table. The statistics of the number of the positive inventory has been achieved by referring to the evidences from supplies unit. For example, for column 5 (confirmatory galvanization) has been ordered for 140 time in the recent year and among these 140 times, there were 129 times with no deficiencies. Hence, the confidence level of the system is 92%. 92%=100*140/129.
The calculations have been presented in the following table.
Table3: The confidence level calculations
| The number of the positive inventory | 12 | 2 | 25.2 | 355 | 129 | 3 |
| The number of the orders in 2009 | 36 | 3 | 2556 | 386 | 140 | 3 |
| The confidence level of the system | 33% | 66% | 97% | 91% | 92% | 100% |
| The item number | Glass | The confirmatory horrent | Handle | Making waterway | The confirmatory galvanization | The tools |
As can be seen in the above table the confidence level of the inventory system is between 33% to 100%. Also to determine the confidence level of the inventory system there have been diverse interviews with experts and the officials in charge of inventory control units, the warehouse, supplies and the production management. The result coming from the sum of these interviews, tables and the other data of the company is that the confidence level of the system is currently 80%. Of the important issues in inventory control system is to make sure of the system process. Meaning that, how sure we are about the item to enter the production process on time when an item is ordered. First, we consider the confidence level of the current inventory control system in the number of the positive inventory of the door and window manufacturing industry (upvc), Tehran and then will present the optimum mode.
The primary optimization in the confidence level of 95%
To optimize the inventory control system of profile door and window manufacturing (upvc), Tehran, according to the confidence level we have considered the system in the optimum mode of 95% and calculated that more details are described followingly. We have mentioned the names of the raw material in the columns of the tables and also we have stated the needed calculation in the rows, stated as follows: in the third row the economical amount of the order Q* is calculated on the basis of the following formula at Kilograms: Q*= √2DCo/Ch.
In the fourth and fifth row the reorder and precautious storage points are calculated on the basis of the following formula:
ROP=d.L+ Zδ d
In the sixth row the optimum economical order is calculated ion the basis of the following formula:
N*=D/Q*
In the seventh row the economical distance between the order
P*=√2t2c0/Dch
t = 360
The eighth, ninth and tenth row are calculated according to the following formula
TC* = D/ Q* C0+1/2Q*.Ch
In this formula, is exactly the same as TC formula in table 4.1, with the difference that Q* is used instead of the Q. in the eleventh row TC achieved from table 4.1 is divided to TC* to determine the percentage of the increase or decrease. As it is clear in all parts it has improved the costs (reduce the costs).
Table 4: The results for the primary optimization in the confidence level of 95%
| The name | Glass | The confirmatory horrent | Handle | Making waterway | The confirmatory galvanization | The tools |
| * Q | 13879364 | 1779769 | 146915 | 115338 | 93709 | 278334 |
| ROP | 6239149 | 77193 | 269230 | 51721 | 64399 | 109732 |
| SS | 398069 | 14748 | 70382 | 10658 | 2609 | 2046 |
| N* | 22 | 6 | 160 | 70 | 27 | 6 |
| P* | 17 | 57 | 2 | 5 | 13 | 57 |
| C0 | 1131168167 | 1614251618 | 27108963 | 17698820 | 17786429 | 154463472 |
| Ch | 1131168167 | 1614251618 | 27108963 | 17698820 | 17786429 | 154463472 |
| TC* | 2262336333 | 3228502101 | 54217593 | 35397363 | 35572680 | 308927881 |
| TC/TC* | 10% | 25% | 617% | 280% | 130% | 158% |
| Result | Reduction | Reduction | Reduction | Reduction | Reduction | Reduction |
of the factors which has led to the frequencies of reorder points in the lead time specialized for each item through which its frequencies are much more effective than the frequencies of the order and the other is the economical distance between the orders of each item.
In the table 4 the results of the primary optimization has been stated which has led to the improvement of the amount of orders and reducing the costs and as it is clear is has led to an improvement and reduction of the costs to minimum 10% and maximum 617%. On the other hand the economical distance of the orders take a domain between 2 to 57 days in which these frequencies may lead to the confusion of the inventory control unit and supplies and will contribute the presented plan to face problems in the performance process and will not be efficient any longer.
Due to the above reason, table 4 is optimized on the basis of ordering period system and the results are mentioned in table 5. Optimization is on the basis of 5 day, 15 day and 60 day periods, as for the handle and making waterway that the order period is every 2 to 5 days it took 5 days, for Galvanization and the Glass which is 13 to 17 days, it took 15 days and for the confirmatory horrent and the tools which was 57 days, it took 60 days to be optimized. Hence, it has been calculated 15 and 60 days and again the costs related to order and maintaining,is achieved on the basis of economical order and are compared with respect to the two previous items.
Table 5: The results for the primary optimization in the confidence level of 95%
| The name | Glass | The confirmatory horrent | Handle | Making waterway | The confirmatory galvanization | The tools |
| * Q | 11,103,492 | 2,854,600 | 206,89 | 113,817 | 85,203 | 259,292 |
| N* | 27 | 6 | 123 | 71 | 23 | 6 |
| P* | 15 | 60 | 5 | 5 | 15 | 60 |
| C0 | 1,413,960,242 | 1,006,653,405 | 20,853,048 | 17.698.820 | 14,822,129 | 147,108,478 |
| Ch | 907,934,598 | 2,588,583,442 | 35,241,209 | 17,698,543 | 21,343,351 | 309,295,644 |
| TC* | 2,981,894,705 | 3,621,990,509 | 56,740,876 | 35,397,363 | 36,557,089 | 312,271,466 |
| ETC | 3.321.894.84 | 3,621,990,509 | 56,740,876 | 35,397,363 | 36,557,089 | 312,271,466 |
| TC/ETC | 0.3% | 0.8% | 1.2% | 0 | 1.1% | 1% |
| Result | Reduction | Reduction | Reduction | Reduction | Reduction | Reduction |
The fourth row, the economical quantity of the order is calculated as explained before.
The fifth rowis the economical distance between each order that the basis for setting has been explained before.
The sixth, seventh and eighth row are calculated on the basis of the following formulas:
TC* = D/ Q*×C0+1/2Q*.Ch
The ninth row, the cost of the final optimization of ETC is calculated on the basis of the costs related to precautious saving and according to the following formula:
ETC = TC * +Ch.Zδ d
TC* in this formula is the same TC achieved in eighth row. The tenth row achieved in table1 ahs been divided to ETC (the ninth row) to determine the percentage of the increase or decrease of the costs and as mentioned in the last row of table 4 in all items there has been an improvement of the costs (reduction of the costs) from the minimum 17% to the maximum of 589%.
Table 6: the comparison between the optimization status and the present status
| No. | 1 | 2 | 3 | 4 | 5 | 6 |
| The name | Glass | The confirmatory horrent | Handle | Making waterway | The confirmatory galvanization | The tools |
| D | 300398598 | 11129900 | 25337735 | 8043550 | 1969680 | 1544080 |
| Q | 8344406 | 3909966 | 12927 | 21001 | 33219 | 690920 |
| Q* | 1103492 | 2854006 | 206089 | 113817 | 85203 | 259292 |
| N | 36 | 3 | 1960 | 383 | 149 | 3 |
| N* | 27 | 6 | 123 | 71 | 23 | 6 |
| TCo | 1881487692 | 734787716 | 33243952 | 95918520 | 38017095 | 55207631 |
| * T Co | 1537557391 | 100665345 | 20853048 | 17698820 | 14822129 | 147108478 |
| TCh | 680069048 | 3546339162 | 2210558 | 3265723 | 8321360 | 432170460 |
| TCh* | 907934598 | 2588584432 | 35241209 | 17698543 | 21343351 | 162187146 |
| TC | 156155674 | 4281126878 | 334650108 | 99187943 | 46338455 | 487378091 |
| ETC | 244549198 | 3595236892 | 56094257 | 35397363 | 36165480 | 309295624 |
| TC/ETC | 1.04 | 1.19 | 5.96 | 2.80 | 1.28 | 1.57 |
| The percentage of the reduction in the total cost | 5 | 81 | 596 | 280 | 22 | 63 |
Table 6 is the comparison between the optimization status and the present status and demonstrates having the annual consumption of D, the rate of the optimum Q* can cause the reduction of the number of the orders (N* compared to N) compared to Q, and that will lead to a decrease in the cost of Co* and the reduction of the Ch* and totally will lead to a decrease in the total cost of ETC.
Results
According to the analyses and on the basis of the comparison of the current status (non-optimized status) with the suggested status (the final optimized status) there have been some results which seem to make a huge evolution in the mentioned organization.
In this part, the results of the research are reviewed first and then some issues are stated about the reduction of the costs. The achieved results imply that there have been considerable variations in the costs of the inventory control system. We have observed the reduction of the costs after optimizing the rate of the orders, the number and the distance of the orders. In this paper we have observed a patent reduction of costs from 5% in the glass raw material to 596% of the raw material in the handle raw material which are counted as an evolution in the inventory control system. In this research we primarily took the research in an optimized mode and considering all aspects arranged it and in order to reach this objective we changed the fixed order period to special times. Although it seems that the costs for the annual orders and the annual maintaining costs and followingly the total cost of the inventory control system is more than the quantitative situation, it has some advantages which compensate the extra costs among which the accurate control of the inventory control system and the decline in the human resource can be noted.
Table 7: the comparison of the costs of the inventory control system in the suggested status and the optimized status and the results.
| Current status | Suggested status | The percentage of the increase or decrease | The final result | |
| The order cost | 3.253.893.882 | 2.744.693.336 | 15% | Reduction |
| Maintaining cost | 4.562.179.779 | 3.732.988.289 | 18% | Reduction |
| Total cost | 7.816.073.661 | 6.477.681.605 | 17% | Reduction |
| Confidence level | 80% | 95% | 15% | Increase |
| The ordering system status | Costly system | System on the basis of the order period |
In this paper we have followed to prove two hypotheses and tried to make a logical answer for it. First we review the hypotheses and the n we will give more explanations.
- The Economic Order model reduces the costs of the inventory control system.
- The Economic Order model increases the confidence level of the inventory control system.
About the first hypothesis have had repeated calculations about the annual costs of ordering and maintaining the inventory control and each time we have seen a reduction in the costs of the inventory control system. As shown in table 7 the cost of the annual orders has reduced for 15% and the costs for annual maintaining and the total cost of the inventory control system have reduced to 18% and 17% respectively. Meaning that the time when the EOQ model is used and the inventory control system is optimized, the costs of the inventory control has had a considerable decline as well, the n the first hypothesis is confirmed. And about the second hypothesis it must be mentioned that according to experts and the tests, we have resulted, in the analysis part, that the current status of the inventory control system in the profile door and window manufacturing industry (upvc), Tehran )is almost 80% and the low level of the confidence level caused the present control system to face the deficiency of the raw materials and therefore stop the production. Hence, the percentage of facing the deficiencies has enhanced from 20% to 5%, through which it can be resulted that the inventory control system in the profile door and window manufacturing industry (upvc), Tehran is only 5% possible to encounter deficiencies while in the current status it is 20% possible, only, for the inventory control system to face deficiencies. Then the second hypothesis is confirmed.
References
- Fatemi Qomi, Mohammad TAghi, 2003, the planning of production and inventory control, Amir Kabir Pub.
- Alvani Seyed Mehdi, Mir-Shafiei Nasrollah, 1994, the production management, Astan-e-qods pub.
- Haj shir Mohammadi Ali, 2005, the principles of planning and inventory and production control.
- Behzadian MAjid, 2004, planning and inventory control, Shahr Pub.
- Seyed Hosseini, Seye Mohammad, 2000, the planning and mainaining and the inventory system, the procedure and the predicting models, Chekad Printing.
- Qeraati, Ruhollah, 2004, the M.A. thesis, Islamic Azad University, Tehran Markazi branch.
- Buzacott, J.A. and R. Q. Zhang (2005) “Inventory Management with Asset-Based
- ” Management Science 50(9): 1274-1292.
- Berling, P. and K. Rosling (2005)“The Effects of Financial Risks on Inventory Policy.”
- Management Science 51(12): 1804-1815.Gaur, V., M. L. Fisher, et al. (2005)”An Econometric Analysis of Inventory
- Turnover Performance in Retail Services.” Management Science 51(2): 181
- Teng, J.-T.(2009)”Discount Cash-Flow Analysis on Inventory Control under
- VariousSupplier’s Trade Credits.” International Journal of Operations Research 3(1)

