
Manuscript accepted on :
Published online on: 26-12-2015
Plagiarism Check: Yes
Anuj Srivastava, Md. Koushik Chowdhury, Shiru Sharma and Neeraj Sharma
School of Biomedical Engineering, Indian Institute of Technology (Banaras Hindu University), Varanasi - 221005, India.
DOI : https://dx.doi.org/10.13005/bpj/547
Abstract
This paper represents the effect of amplitude modulated ultrasonic standing waves in determining the glucose concentration in dextrose mixed intralipid based tissue phantom. The intralipid exhibits biological tissue related light absorption, reflection, scattering properties. The intralipid act as a suitable substitute medium for tissue related lab based experimentations. The ultrasonic waves were produced here using two sinusoidal waves. Phase of the ultrasonic waves were controllable in nature. The piezoelectric crystal based ultrasonic transmitter and receiver of 40 kHz were used here. The ultrasound produced here causes series of vibrating pattern on the area of its applications. Molecules usually vibrate specifically based on their structural orientations and physical properties. The vibration patterns of glucose molecule were observed here using infrared LED of 940nm. The experimental design and resultant output in Fast Fourier Transform Domain for glucose prediction in dextrose mixed intralipid phantoms had been described and discussed in this paper. This technology can be utilized to design and improve noninvasive blood glucose monitoring devices
Keywords
amplitude modulated; ultrasonic transmitter; noninvasive
Download this article as:| Copy the following to cite this article: Srivastava A, Chowdhury M. K, Sharma S, Sharma N. The Utilization of Ultrasonic Standing Waves for Predicting Glucose Concentration Levels in Dextrose Mixed Intralipid Based Tissue Phantom. Biomed Pharmacol J 2014;7(2) |
| Copy the following to cite this URL: Srivastava A, Chowdhury M. K, Sharma S, Sharma N. The Utilization of Ultrasonic Standing Waves for Predicting Glucose Concentration Levels in Dextrose Mixed Intralipid Based Tissue Phantom. Biomed Pharmacol J 2014;7(2). Available from: http://biomedpharmajournal.org/?p=3282 |
Introduction
Hyperglycemic subjects requires to monitor their respective blood glucose levels up to 4 to 5 times per day for proper management and to avoid serious health related issues [1-3]. Existing Modern technology offers finger prick and check methodology for blood glucose determinations [3]. Skin tissue puncturing, infection related hazards, painful approach of drawing blood samples calls for noninvasive blood glucose determination technology [1-3]. The noninvasive methods were painless and infection free with ease of operation [4]. After decades of research for noninvasive technology for blood glucose detections, till date many of them provided excellent and promising approaches [1-5]. Those technologies includes infrared absorption spectroscopy [4-6], near infrared scattering spectroscopy[4-7], Raman spectroscopy [4-6], fluorescent spectroscopy[4-7], thermal gradient spectroscopies [4], polarimetry technologies [4-7], polarization heterodyning approaches [4,5], photonic crystal determination techniques [4-6], photoacoustic Technologies [4-7], photo thermal technologies [5,6,7], optical coherence tomography (OCT) techniques [4-7] and ultrasound-modulated optical techniques [4-7]. All these methods had proved their potentiality for noninvasive blood glucose determinations [4,5]. But clinically acceptable technology still does not exist [5]. Spectrum overlapping, glucose feeble signals, low signal to noise ratios, impact of background noises, etc all this factors stands in path of success for noninvasive blood glucometer [4,5]. Simultaneously, more studies regarding skin tissue and light based optical property determination techniques needed to be done extensively to initiate the process towards successful development of noninvasive glucometer [4-6]. For determining glucose optical properties various phantom based experiments were conducted nowadays [8-10]. We had utilized intralipid as tissue property mimicking phantom here. In our experimentation the effect of modulated ultrasonic waves to determine dextrose concentration in the intralipid phantoms were studied. Section II describes the principle and methodology involved in the experiments. Section III illustrates result and discussion portions of the paper. Section IV constitutes conclusion part of the paper.
Principle and Methodology
Intralipid(tissue phantom) sample preparation:
Usually water and phospholipids micelles were the main constituents of the intravenous nutrient widely known as an Intralipid suspension. This suspension is inert, unvarying, identical and cloudy in nature [11]. Geometrically spherical phospholipids micelles size ranges between 25nm to 675nm [8-11]. 97nm and 03nm were the average and standard deviations respectively as reported [11]. Light scattering property of the intralipid matches the skin tissues [8-11]. The accurate proportions of light absorption and scattering properties needed to be maintained to obtain skin tissue related light transport phenomenon [8-11]. The ultrasonic impedance value of diluted intralipid suspension resembles as that of pure water [11]. The lab experiments conducted here includes 10% intralipid samples. 0mg (blank), 500mg of dextrose anhydrous purified powder (Merck) samples were added to it. Modulated ultrasound and infrared units were utilized to detect the respective dextrose concentration in the dextrose added intralipid tissue phantoms. The values of the Dextrose used here were much higher as compared to physiological glucose concentrations (40mg/dl to 450mg/dl). As the intralipid optical properties were much low in physiological ranges [8-11]. Standard intralipid constituents as per Reference No. [9,10] is as follows:
Table 1: Intralipid Composition
| Soybean oil | 100 g | 107.88 ml |
| Lecithin | 12 g | 11.64 ml |
| Glycerin | 22.50 g | 17.84 ml |
| Water | 861 g | 862.66 ml |
| Total | 995.5 g | 1000 ml |
The intralipid suspension had been prepared here for the experimental purpose using the same proportionate of constituents as given in Table No.1.
Subject physiological status
The male subject age is around 26 years, height of 158cm and weight of 72kg. The experimental protocols were described to the subject. He understood the process and gave the consent. The local ethical committee approved the study.The blood sample for blood plasma, blood serum and whole blood preparation had been collected from a normal male subject for experimental purposes.
Preparation of human blood samples
The blood samples of 10ml in quantity were drawn for two times (over night fasting and postprandial stage) from the veins of right arm of the subject for various types of blood sample preparations.
Blood plasma sample preparation
For human blood plasma preparation 4ml of blood sample had been collected in EDTA-treated vacuum based blood collecting vials. The samples had been applied to standard centrifugation process for 10 minutes. After centrifugation process, the supernatant fluid part of the sample has been collected as blood plasma. It is stored for experimental purposes [12, 13].
Blood serum sample preparation
For human blood serum preparation the 4 mlof blood sample had been left in room temperature for 15-30 minutes for clotting process. Usually centrifugation methods had been applied for clot breaking and serum collection. The Pasteur pipette had been used for serum fluid extraction from the vials and stored in 2 to 8 0C for experimental purposes [12].
Whole blood sample preparation
For whole blood sample preparation, the 2 ml of blood had been collected in vacutainer blood collecting vials containing anti-clotting agent like K2 EDTA. Phosphate buffer solution (PBS) had been utilized here for maintaining the pHlevel of the whole blood sample [12, 14]. After that it had been kept on storage for experimental works.
MUS-IR Experimental set up
It comprises mainly two units like(a) Modulating ultrasound unit and (b) Infrared light-detector unit.
Modulating Ultrasonic unit
This portion of the device includes ultrasound transmitter and receiver of 40 kHz respectively. Carrier wave unit and the Modulating signal unit were connected jointly to the modulating unit. Here amplitude modulated signal which is standing wave in nature were produced. Signals generated were introduced in the sample holder unit. The ultrasonic standing wave patterns were cross checked by the ultrasonic receiver unit. These standing wave pattern must be of desired quality as plays the key role in determining dextrose concentration in the intralipid based tissue phantoms. The Figure No.1 depicts the standing wave generation pattern utilized here.
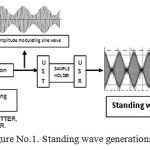 |
Figure 1: Standing wave generations
|
Infrared light-detector unit
The infrared LED of 940nm had been utilized here. This wavelength of light falls between the tissue optical window, which ranges between (700nm to 1100nm) [15]. Vibration produced by the ultrasonic transmitter causes the molecules to vibrate depending on their physical orientations. These specific signature vibrations were detected by the infrared light beam. It had been recorded via sensitive infrared detector after suitable amplification and noise removal processes. The signal processing unit decodes the information to provide the actual dextrose concentrations in the intralipid phantoms. The Figure No.2 provides the block diagram of the complete instrumental setup.
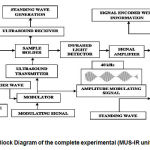 |
Figure 2: Block Diagram of the Complete Experimental Setup
|
Principle
The ultrasonic waves, amplitude modulated in property when imposed over the intralipid medium, the radiation waves causes series of vibration in the medium [16-24]. The molecules in the medium undergoes thinning pattern [16-24]. They occur especially in the standing waves nodes [16-24]. The molecular volume (Vc) were acted up on by the ‘primary’ radiation force (Fr), which is placed by a distance (z) from the pressure node [16-24]. The molecular acoustic potential energy of it had been expressed as
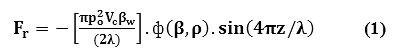
The propagation of ultrasonic waves, physical and chemical characteristics of the medium, determines the direction of force, which is controlled by the factor called as compressibility factor [16-24]. This is expressed as:
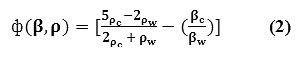
Where (βc) refers to compressibility factor ofthe intralipid phantom used, (ρc) and (ρw) represents the density of molecules of both the phases respectively [16-24].
Here Light absorption as (A) and wave number as (v) had been assumed as per Lambert-Beer Law. The equation as follows:
![]()
Here (I0) denotesimpact due to the impact of neighboring medium, (I) represents the intensity at the precise wave number (v). [16,21-24].
Result and Discussion
Over growing population of diabetic subjects [1-5] and increased application of intralipid samples as tissue phantom for noninvasive blood glucose determinations [9-11] had influenced us for conducting such type of experiments utilizing amplitude modulated ultrasound and infra red unit. The experiments were performed in 4 stages and results including Table No. 2, 3 and Graph No.1 to 8 were described in this paper.
Table 2: Shows the voltage amplitude related glucose level in fasting blood sample.
| Serial No. | Intralipid tissue phantom as medium mixed with different blood samples of fasting stage | Amplitude Modulating Ultrasonic Standing Wave | Voltage Amplitude (mV) | |
|
Medium |
Samples |
|||
| 1. | 2 ml Intralipid suspension | 2 ml Intralipid suspension used as blank | Absent | 0.0 |
| 2. | 2 ml Intralipid suspension | 2 ml Intralipid suspension used as blank | Present | 6.7 |
| 3. | 1 ml Intralipid suspension | 1 ml prepared plasma sample | Present | 7.5 |
| 4. | 1 ml Intralipid suspension | 1 ml prepared serum sample | Present | 7.9 |
| 5. | 1 ml Intralipid suspension | 1 ml prepared whole blood sample | Present | 21.8 |
Table 3: Shows the voltage amplitude related glucose level in postprandial blood sample.
| Serial No. | Intralipid tissue phantom as medium mixed with different blood samples of postprandial stage | Amplitude Modulating Ultrasonic Standing Wave | Voltage Amplitude (mV) in FFT domain | |
|
Medium |
Samples |
|||
| 1. | 2 ml Intralipid suspension | 2 ml Intralipid suspension used as blank | Absent | 0.0 |
| 2. | 2 ml Intralipid suspension | 2 ml Intralipid suspension used as blank | Present | 6.7 |
| 3. | 1 ml Intralipid suspension | 1 ml prepared plasma sample | Present | 10.3 |
| 4. | 1 ml Intralipid suspension | 1 ml prepared serum sample | Present | 10.3 |
| 5. | 1 ml Intralipid suspension | 1 ml prepared whole blood sample | Present | 28.1 |
Stage I
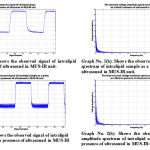
In this part, the 2ml of intralipid sample had been taken in sample test tube from the intralipid stock suspension using micropipette. The intralipid sample filled test tubes has been inserted in the sample holder of the MUS-IR unit. Both the measurement in absence and presence of ultrasound had been conducted. Intralipid (tissue phantom) had been used here as a blank and for calibration purposes. The observed signal and Fast Fourier Transform (FFT) domain transformation were performed and stored electronically for analytical purposes. The Graph No. 1(a), 2(a) and Graph 1(b), 2(b) shows both the observed signals, FFT domain voltage amplitude spectrum in presence/absence of ultrasound in MUS-IR unit respectively. The comparison of Graph No. 1(a) and Graph No. 2(a) of the observed signal reveals that the wave pattern characteristics changes when ultrasonic mode had been applied in MUS-IR unit.Graph No.1(b) in Fast Fourier Transform (FFT) domain the peak voltage amplitude was not seen in absence of ultrasound. On the contrary, Graph No.2(b) and Table No.2 reveal that the peak voltage amplitude spectrum of blank intralipid had been observed in FFT domain when ultrasound is present in MUS-IR unit. This indicates the significant working of ultrasound in MUS-IR unit.
 |
Graph: 1a, 1b, 2a and 2b
|
Stage II
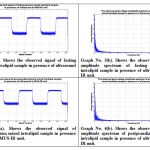
During this part, 1ml of human blood fasting plasma sample as preparedhad been added to 1 ml of intralipid suspension. Similarly, 1 ml of human blood postprandial plasma sample is added to another 1ml of intralipid suspension. Both the fasting and postprandial samples were examined separately in presence of ultrasound through MUS-IR unit. The results of the observed signal and voltage amplitude spectrum in FFT domain in presence of ultrasound were captured and stored.The Graph No. 3(a), 4(a) and Graph 3(b), 4(b) shows both the fasting and postprandial blood plasma in intralipid suspension samples of the observed signals, FFT domain voltage amplitude spectrum in presence of ultrasound in MUS-IR unit respectively. The wave pattern changes were revealed when Graph No. 3(a) and 4(a) were observed.Similarly, from Graph No. 3(b), Table No.2 and Graph No. 4(b), Table No.3 of fasting and postprandial blood plasma samples respectively, the voltage amplitude varies with change in blood glucose concentrations. The postprandial blood plasma sample peak voltages in FFT domain were on higher side as compared to the fasting blood plasma mixed intralipid sample respectively.
 |
Graph: 3a, 3b, 4a and 4b Click here to View figure |
Stage III
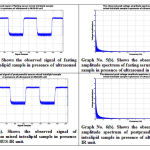
This part belongs to the MUS-IR unit based experimentation including 1ml of fasting blood serum with 1ml intralipid suspension and 1 ml of postprandial human blood serum sample mixed with 1ml intralipid suspension respectively. Outputs of the experimentation were recorded for analytical intensions. The Graph No. 5(a), 6(a) and Graph 5(b), 6(b) shows both the fasting and postprandial blood serum in intralipid suspension samples of the observed signals, FFT domain voltage amplitude spectrum in presence of ultrasound in MUS-IR unit respectively.The Graph No. 5(a) and 6(a) shows that they vary in their wave pattern characteristics when compared. With change in blood glucose concentration the peak voltage amplitude varies as seen in Graph No. 5(b), Table No.2 and Graph No. 6(b), Table No.3 respectively. The peak values were in increase mode in postprandial serum sample as compared to the fasting serum sample mixed intralipid suspension respectively.
 |
Graph: 5a, 5b, 6a and 6b Click here to View figure |
Stage IV
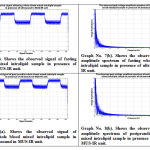
In this portion the MUS-IR unit based experimentation were conducted utilizing 1ml of fasting whole blood sample with 1 ml of intralipid suspension and 1 ml of postprandial human blood whole blood sample mixed with 1ml intralipid suspension respectively. The resultants of observed signals were stored for analytical purposes. The Graph No. 7(a), 8(a) and Graph 7(b), 8(b) shows both the fasting and postprandial whole blood sample in intralipid suspension samples observed signals, FFT domain voltage amplitude spectrum in presence of ultrasound in MUS-IR unit respectively.The wave shape characteristics vary in Graph No. 7(a) and 8(a) when evaluated. The phenomenon of glucose concentration variation causes changes in the peak voltage amplitude in FFT domain as seen in Graph No. 7(b), Table No.2and Graph No. 8(b), Table No.3 respectively. The postprandial whole blood mixed intralipid sample occupies higher peak values than the fasting one.
 |
Graph: 7a, 7b, 8a and 8b Click here to View figure |
Conclusion
The MUS-IR unit had been utilized here for glucose concentration determinations in human various blood samples like blood plasma, blood serum, whole blood mixed with intralipid tissue phantom. The results indicate that ultrasound performs a key role in determining glucose concentrations in fasting and postprandial stages. This principle would be helpful in noninvasive glucometer designing and developing.
Acknowledgment
The writers of the manuscript were grateful to the Coordinator and other faculty members, staffs, School of Biomedical Engineering, IIT-BHU for their inspiration and support during the experimental and manuscript preparations.
References
- “The fourth edition of the IDF Diabetes atlas”, International Diabetes Federation, 2009.
- Peter J.Watkins, ABC of Diabetes, (Fifth Edition), London : BMJ Books, 2003.
- http://diabetes.webmd.com (12/06/2014)
- A. Tura, A. Maran and G. Pacini, “Non-invasive glucose monitoring: Assessment of technologies and devices according to quantitative criteria”, Diabetes Research and Clinical Practice, vol. 77, 2007, pp. 16-40.
- O. Khalil, “Noninvasive glucose measurement technologies: an update from 1999 to the dawn of the new Millenium,” Diabetes Technol. Ther., vol. 6, no. 5, 2004, pp. 660–697.
- Md.K.Chowdhury, A.Srivastava, N.Sharma, S.Sharma, “Challenges & Countermeasures in Optical Noninvasive Blood Glucose Detection”, International Journal of Innovative Research in Science, Engineering and Technology (IJIRSET), Vol.2, issue 1,Jan 2013,pp.324-329.
- A.Srivastava, Md.K.Chowdhury, S.Sharma, N.Sharma, “Blood Glucose Monitoring Using Non Invasive Optical Method: Design Limitations and Challenges”, International Journal of Advanced Research in Electrical, Electronicsand Instrumentation Engineering (IJAREEIE), Vol. 2, issue 1, Jan 2013, pp.615-620.
- Brian W. Pogue, Michael S. Patterson,” Review of tissue simulating phantoms for optical spectroscopy, imaging and dosimetry”, Journal of Biomedical Optics Vol.11 (4), 041102(1-16) (July/August 2006)
- ST Flock, SL Jacques, BC. Wilson, WM Star, MJC van Gemert, “Optical Properties of Intralipid: A phantom medium for light propagation studies,”Lasers in Surgery and Medicine 12:510-519, 1992.
- HG van Staveren, CJM Moes, J van Marle, SA Prahl, MJC van Gemert, “Light scattering in Intralipid-10% in the wavelength range of 400-1100 nanometers,” Applied Optics 30:4507-4514, 1991.
- M. Kinnunen and R. Myllyla, “Effect of glucose on photoacoustic signals at the wavelength of 1064 and 532 nm in pig blood and Intralipid,” J. Phys. D: Appl. Phys., vol. 38, 2005, pp. 2654–2661, doi.10.1088/0022-3727/38/15/018.
- Raghu , Practical Biochemistry for Medical Students, Jaypee Brother Publishers,2003, pp
- Minh TD, Oliver SR, Ngo J, Flores R, Midyett J, Meinardi S, Carlson,MK, Rowland FS, Blake DR, Galassetti PR. Noninvasive measurement ofplasma glucose from exhaled breath in healthy and type 1 diabetic subjects. Am J Physiol Endocrinol Metab 300: E1166–E1175, 2011.
- Orna Amir, Daphna Weinstein, Silviu Zilberman, Malka Less, Daniele Perl-Treves, Harel Primack, Aharon Weinstein,Efi Gabis,Boris Fikhte, and Avraham Karasik. “Continuous Noninvasive Glucose Monitoring Technology Based on Occlusion Spectroscopy”, Journal of Diabetes Science and Technology,Volume 1, Issue 4, July 2007,pp.463-469.
- K. Konig, “Multiphoton microscopy in life sciences”, Journal of Microscopy, vol. 200-2, 2000, pp. 83-104.
- S. Radel , M. Brandstetter, B.Lendl, ‘Observation of particles manipulated by ultrasound in close proximity to a cone-shaped infrared spectroscopy probe’, Ultrasonics 50 (2010), pp.240–246.
- W. Terence Coakley, ‘Ultrasonic separations in analytical biotechnology’, Trends in Biotechnology (1997), pp. 506-511.
- L.V. King, ‘On the acoustic radiation pressure on spheres’, Proceedings of the Royal Society of London (1934), pp.212–240. A147.
- K. Yosioka, Y. Kawasima, ‘Acoustic radiation pressure on a compressible sphere’, Acustica 5 (1955), pp.167–173.
- F. Petersson, A. Nilsson, C. Holm, H. Jonsson and T. Laurella, ‘Separation of lipids from blood utilizing ultrasonic standing waves in microfluidic channels’, The Analyst, The Royal Society of Chemistry,(2004),129,pp.938-943. doi: 10.1039/b409139f.
- Md. K. Chowdhury, A. Srivastava, N. Sharma, & S.Sharma, ‘The influence of blood glucose level upon the transport of light in diabetic and non-diabetic subjects’. International Journal of Biomedical and Advance Research, 4(5) (2013), pp.306-316. doi:10.7439/ijbar.v4i5.357.
- A. Srivastava, Md. K. Chowdhury, S. Sharma, N. Sharma, ‘Optical Clearance Effect Determination of Glucose by near Infrared Technique: An Experimental Study using An Intralipid Based Tissue Phantom’, International Journal of Advances in Engineering & Technology (IJAET), Volume 6 Issue 3, pp. 1097-1108, July 2013.
- Md. Koushik Chowdhury, Anuj Srivastava, Shiru Sharma, Neeraj Sharma, “The potential application of amplitude modulated ultrasound with Infrared Technique for blood glucose level determination in non invasive manner”. Biomedical and Pharmacology Journal, Vol.7, No.1, ( In Press).
- A.Srivastava, Md.K.Chowdhury, S.Sharma, N.Sharma, “Measurement of Glucose Concentration using Amplitude Modulated Ultrasound with Infrared Technique in Intralipid Phantoms and Human Whole Blood mixed intralipid phantom of Healthy and Diabetic Subjects”, Bioscience Biotechnology Research Asia, Vol.11, No.2, (In Press).

