
Manuscript accepted on :
Published online on: 24-12-2015
Plagiarism Check: Yes
Mansour Haddad
Department of Clinical Sciences, Faculty of Pharmacy, Philadelphia University, P.O Box 3341, Irbid, P.C 211-10.Jordan.
DOI : https://dx.doi.org/10.13005/bpj/503
Abstract
GPCRs are the largest family of proteins in the human genome. One family of GPCRs is adenosine receptors, which are divided into A1, A2A, A2B and A3 adenosine receptors based on pharmacology and coupling to cAMP production. Another family of receptors is P2Y receptors, which are divided into P2Y1, P2Y2, P2Y4, P2Y6, P2Y11, P2Y12, P2Y13 and P2Y14. Indeed, GPCRs are targets for huge numbers of therapeutic drugs, although the role of skeletal muscle in the action of these drugs is unclear. The purpose of this research was to identify genes encoding adenosine and purinergic receptors highly expressed in skeletal muscle and in cultured preparations thereof. Skeletal muscle cells were cultured from vastus lateralis obtained from male Wistar (180-200 g) rats as Blau and Webster method with slight modification (Blau et al., 1981). mRNA expression, cAMP and calcium measurement were examined by conventional methods (Akaneya et al., 2006; Hudson et al.; Millns et al., 2001). Data were reported as means of triplicate or quadruplicate wells generated from two animals. Statistical analysis was conducted using one or two-way ANOVA with Bonferroni’s multiple comparisons test. mRNA encoding Gs- (adora2a, adora2b), Gi- (adora1), and Gq-coupled (p2ry1, p2ry2 and p2ry6) receptors were detected using gene microarray (Agilent, all ranked <24000 out of 41090). Treatment of myotubes with NECA (5'-N-ethylcarboxamidoadenosine) (10-7 and 10-5 M) for 10 minutes elicited a significant increase in cAMP (18 ± 0.33 compared to basal levels of 4.3 ± 0.15 pmol/well), which were significantly inhibited in the presence of the A2B antagonist PSB603 (Fredholm et al.) (10-5 M, 5.3 ± 0.33 pmol/well). Treatment of myotubes with the A2A-selective agonist CGS21680 (10-7 M) failed to evoke a significant cAMP elevation. Neither basal nor forskolin (1 µM)–evoked elevation of cAMP was altered in the presence of the A1-selective agonist S-ENBA (10-7 M). All 748 myoblast cells (imaged from four animals; 150-250 cells/animal) showed an elevation in intracellular calcium levels in response to 1 mM ATP, with an increase in fluorescence ratio (the max of response (peak) obtained from drug minus the baseline (DFR); Fura-2 340/380 nm excitation) of 0.33 ± 0.06. 575 cells responded to 10-5 M UTP (0.18 ± 0.08 DFR). Responses to ATP were insensitive to the P2Y1 antagonist MRS2179 (10-7 M). In summary, we observe expression and functional responses to example members of the adenosine and purinergic GPCR families in rat skeletal muscle preparations.
Keywords
GPCRs; cAMP; calcium and myotubes; adenosine receptors; purinergic receptors
Download this article as:| Copy the following to cite this article: Haddad M. Adenosine Receptors Machinery and Purinergic Receptors in Rat Primary Skeletal Muscle Cells. Biomed Pharmacol J 2014;7(2) |
| Copy the following to cite this URL: Haddad M. Adenosine Receptors Machinery and Purinergic Receptors in Rat Primary Skeletal Muscle Cells. Biomed Pharmacol J 2014;7(2). Available from: http://biomedpharmajournal.org/?p=3011 |
Introduction
G protein coupled receptors (GPCRs) are the largest family of proteins in the human genome. Indeed, GPCRs are the richest targets for pharmaceutical drugs on the market today; it is estimated that they are the targets of 30-50% of all medications due to their vast and varied roles in regulating the body processes, metabolism and signal transduction and their involvement in key biological functions (Kobilka, 2007; Tilakaratne et al., 2005). GPCRs are expressed in every tissue and play a major role in many diseases.
One family, which was investigated, was adenosine receptors, which are divided into A1, A2A, A2B and A3 adenosine receptors based on pharmacology and coupling to cAMP production. A1 and A3 adenosine receptors are coupled to inhibitory Gi-proteins, whereas the A2A and A2B adenosine receptors are coupled to stimulatory Gs proteins.Another family of receptors, the P2Y receptors, was investigated using Ca2+-imaging. P2Y receptors are a family of plasma membrane GPCRs involved in several cellular functions and are divided into P2Y1, P2Y2, P2Y4, P2Y6, P2Y11, P2Y12, P2Y13 and P2Y14.
Skeletal muscle is a heterogeneous tissue since it contains a variety of fibres that differ in contractile, functional, metabolic and molecular characteristics(Pette et al., 1997; Staron et al., 1999). Moreover, skeletal muscle is the largest organ in the human body and represents ~40% of the human body mass and 35-40% of the total body weight in the rat (Delbono et al., 2007; Pedersen, 2011). Indeed, skeletal muscle utilizes the majority (70-80%) of ingested glucose since it is the main site for insulin-dependent glucose uptake (Toft et al., 1998). Therefore, it is generally considered the most important site of insulin resistance.
Myotubes are primary skeletal muscle cells sharing the morphological, metabolic and biomedical characteristics and properties of adult skeletal muscle (Henry et al., 1995; Raymond et al., 2010). This paper showed that mRNA for many GPCRs were expressed in skeletal muscle tissues; notably A1 and A2A adenosine receptors, P2Y1, P2Y2 and P2Y6 receptors, α2A-adrenoceptors. Since there has been little evaluation of GPCR signalling in myotubes, and it was not possible to investigate all the GPCR apparently expressed in skeletal muscle, some examples were chosen. This selection was based on an attempt to examine signalling through the three main groups of G protein, Gs, Gi and Gq.
From the top highly ranked GPCRs list detected using the microarray (Agilent, all ranked <24000 out of 41090) and GPCRs detected using the QRT-PCR (Taqman) in skeletal muscle, A2A adenosine receptors were selected as Gs-coupled, while A1 adenosine receptors were selected as Gi-coupled. This group (Gs and Gi-GPCRs) were tested by quantifying levels of cAMP. However, P2Y1, P2Y2 and P2Y6 receptor were selected as Gq-coupled and were tested by assessment of levels of intracellular calcium ions.
Abbreviations
(GPCRs); G protein coupled receptors, (Adora2a); adenosine A2a receptor, (Adora2b); adenosine A2B receptor, (Adora1); adenosine A1 receptor, (P2ry1); purinergic receptor P2Y, G-protein coupled 1, (cAMP); cyclic adenosine monophosphate, (ATP); adenosine triphosphate, (UTP); uridine triphosphate, (NECA); 5′-N-ethylcarboxamidoadenosine, (PSB603); 8-[4-[4-(4-chlorophenzyl) piperazide-1-sulfonyl)phenyl]]-1-propylxanthine, (CGS21680); 2-(4-[2-carboxyethyl]-phenethylamino) adenosine-5′-N-ethyluronamide, (MRS2179); 2′-Deoxy-N6-methyladenosine 3′, 5′-bisphosphate, (S-ENBA); (2S)-N6-(2-endonorbanyl) adenosine, (ICI 118,551); erythro-dl-1-(7-methylindan-4-yloxy)-3-isopropylaminobutan-2-ol, (UK14304); 5-Bromo-6-(2-imidazolin-2-ylamino)quinoxaline, (NR4A); nuclear receptors, subfamily 4, (PDK4); pyruvate dehydrogenase kinase 4, (FOXO1); forkhead box protein O1, (PGC-1α); peroxisome proliferator-activated receptor-γ coactivator, (lipin-1α); phosphatidate phosphatase LPIN1, (Pfkm); muscle phosphofructokinase, (GLUT4); Glucose transporter-4, (MAPK); Mitogen activated protein kinase, (ERK 1/2); extracellular signal-regulated kinase 1/2, (SiRNA); Small interfering RNA, (ΔFR); fluorescence ratio units, FBS; (fetal bovine serum), Fura-2AM; (L-[2-(carboxyloxazol-2-yl)-6-amino-benzofuran-5-oxy]-2-(2’-amino-5’methyl phenoxy)ethane-N,N,N,N-tetraacetic acid pentaacetoxymethyl ester)), (DMEM); Dulbecco’s Modified Eagle Medium, (PBS); phosphate buffered saline, (HEPES); 4-(2-hydroxyethyl)-1-piperazineethanesulfonic acid, (SEM); standard error of mean, (AUC); area under the curve, (ANOVA); analysis of variance, (APS); ammonium persulphate, (cDNA); Complementary DNA, (Ct); Cycle threshold, (DMSO); Dimethyl sulfoxide, (mRNA); messenger ribonucleic acid, (PBS); Phosphate buffered saline, (PCR); Polymerase chain reaction; (P-value); Probability, (RT-PCR); Reverse transcription polymerase chain reaction, (SDS-PAGE); Sodium dodecyl sulfate polyacrylamide gel electrophoresis, (SEM); Standard error of the mean, (TBST); Tris-buffered saline with Tween 20.
Aims
The purpose of the investigations in this study was to characterize the mRNA expression of adenosine and purinergic receptors that coupled to different G proteins (Gs, Gi and Gq) in rat mixed fibre-type skeletal muscles using DNA microarray and to assess the downstream signalling of GPCRs in rat primary skeletal muscle cells using cAMP assay, calcium imaging and immunoblotting.
Materials and Methods
Materials
NECA, CGS21680, PSB603 and S-ENBAwere purchased from Tocris Company. All other materials were purchased from Sigma unless otherwise mentioned. RNeasy Mini Total RNA Purification kits were purchased from Qiagen (West Sussex, UK). Reagents for reverse transcription of RNA to cDNA were purchased from Invitrogen (Paisley, UK). TriReagent was purchased from Invitrogen. 30% Bis-acrylamide was purchased from Severn Biotech (Kidderminster, UK). Seeblue Protein Ladder was purchased from Fermentas (York, UK). Nitrocellulose membrane was purchased from GE Healthcare (Amersham, UK). FBS (fetal bovine serum) and Ham’s F10 were purchased from PAA Laboratories (Somerset, UK). cAMP Kit was obtained from Cayman Chemical (Europe). Fura-2AM was bought from Calbiochem company.
Tissue collection
Two male adolescent Wistar rats (180-200 g, 4-6 weeks old) were killed by cervical dislocation without anesthesia. Skeletal muscle were obtained. Skeletal muscle (mixed fibre-type from hindlimb) tissues were then separated bilaterally: tissue was immediately frozen in liquid nitrogen and stored at -80 °C with liver and adipose tissue, muscle tissue was cultured after the isolation of satellite cells in gelatine-coated flasks.
Primary cell culture
Muscle culture was performed as Blau and Webster method with slight modification (Blau et al., 1981). Vastus lateralis muscles from Wistar rats were removed and immersed in phosphate buffered saline (PBS), washed to remove the remnants of blood, and minced finely with scissors and scalpel blades on a Petri dish. Then, the minced muscle was transferred to a 50 ml flask containing a ‘flea’ and 5-10 ml of 0.25% (W/V) trypsin/EDTA (1X) for incubation at 37Cº for 15 minutes. After that, the supernatant was transferred to a 50 ml flask and neutralised with an equal volume ofmedium (streptomycin, penicillin, foetal bovine serum and Ham’s F10), then centrifuged at 1700 rpm for 5 minutes. The collected cells were filtered through 100 µm nylon mesh (“cell strainers”) to purify the cells from the debris, and centrifuged for 10 minutes at 17,000 rpm (g=26) at room temperature. The supernatant layer was removed and the cell pellet (satellite cells) was re-suspended in Ham’s F10 growth medium, pre-plated on uncoated flasks for 10 minutes at 37 C° to purify these satellite cells from fibroblasts present in the extract, and then transferred to culture flasks coated with 0.2% (W/V) gelatin. The satellite cells were then grown to confluent myoblasts and differentiated into myotubes in growth medium; 20% (V/V) fetal bovine serum (FBS) and 5 ml of penicillin and streptomycin (10,000 units penicillin and 10 mg streptomycin/ml in 0.9% NaCl) were added to Ham’s F10. After one day, the cells were fed with fresh medium, cells require fresh medium every 48 hours. The cells were fed with 20% (V/V) FBS fresh medium for three weeks, then reduced to 10% (V/V) FBS fresh medium for two weeks and then changed to 6% horse serum and 10 mM glucose Ham’s F10 for two to three days. Images were taken for the cells using a digital camera connected to microscope (Nikon) at X40 magnification (Figure 2).
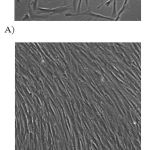 |
Figure 1: Representative myoblasts and myotubes derived from Wistar rat skeletal muscle.A) myoblasts taken during the third week of tissue culture and B) myotubes taken during sixth week of tissue culture.
|
Microarray procedure
Agilent 4*44K DNA one color whole genome microarrays were used to measure the expression of 41090 genes in mixed fibre-type of skeletal muscle from rat hindlimb. The microarray experiment was carried out according to manufacturing instructions.After assessing the quality control criteria generated from feature extraction software, extracted data were further processed with GeneSpring GX 11.
RNA extraction
Myoblast and myotube cells were grown and differentiated as described above. The cells were collected in TriReagent, and processed according to the manufacturer’s directions.
cAMP assay
Accumulated cAMP in the myotube cells was measured by a competitive Enzyme Immunoassay (EIA) kit (Cayman Chemical). Cells were prepared as discussed above. Where indicated, cells were pre-incubated with antagonist 20 minutes prior to agonist addition. At the end of the exposure period for the drugs, 40 µl 5 M HCl was added to each well (2 ml media (Ham’s F10), 6% horse serum), before cAMP measurement as described in the manufacturer’s instructions.
Calcium imaging
Calcium imaging was performed as described previously (Millns et al., 2001). In brief, satellite cells were grown on 19 mm glass coverslips and differentiated into myoblasts over around 14-21 days, myoblasts cultured onto glass coverslips were loaded with the Ca2+-sensitive fluorescent dye fura-2AM. The intracellular [Ca2+]i was quantified in single cells within myoblast clusters with the Ca2+-sensitive fluorescent dye fura-2AM using Andors IQ imaging system. Myoblast cells were washed with Ca2+ buffer, then were incubated with 5 µl 1 mM fura 2-acetoxymethyl ester (fura-2 AM) dissolved in 895µl buffer (NaCl, 145 mM; KCl, 5 mM; CaCl2, 2 mM; MgSO4.7H2O, 1 mM; 4-(2-hydroxyethyl)-1-piperazineethanesulfonic acid (HEPES), 10 mM; glucose, 10 mM) with 100 µl FCS for one hour and 15 minutes at 37 C°. Coverslips were fixed to a Perspex chamber using vacuum grease. A coverslip with adherent myoblast cells was positioned on the stage of a inverted fluorescence microscope and examined using Retiga chilled digital intensified charge-coupled device (CCD) camera. Myoblast cells were assessed by imaging for intracellular calcium ion levels as described previously(Chandra et al., 1989; Millns et al., 2001). Myoblast cells on the coverslips were exposed to UTP, ATP and ionomycin, as indicated, for one minute. In some instances, MRS2179 was perfused over the cells for 3 minutes prior to agonist addition. Peak ratios were calculated by subtracting the baseline fluorescence ratio (excitation at 340/380 and emission at 500 nm) from the fluorescence ratio obtained during drug superfusion (ΔFR). The results are presented as means ± standard error of mean (SEM) in change in fluorescence ratio units (ΔFR) and mean ± SEM of the area under the curve (AUC) in arbitrary units.
Statistical analysis
Data were analyzed using one or two-way ANOVAand Bonferroni post-hoc test. Analysis was performed using GraphPad Prism, version 5.03 (GraphPad Software Inc). Differences were considered significant at P<0.05. Data were reported as means ± standard error of mean (SEM) of triplicate or quadruplicate wells generated from two animals (n=2). Statistics was performed from at least two repeats (n=2 rats) for cAMP and western blot experiments.
Results
mRNA expression of adenosine and purinergic receptors using Microarray
A1 and A2A-adenosine receptors and P2Y1,P2Y2 and P2Y6 receptors entities were detected in skeletal muscle tissue (ranked higher relative intensity values) than either nicotinic cholinergic alpha subunit (chrnα1) or reference gene (TATA box binding protein (Tbp)) (12526 and 10220 ranking out of 41090, respectively)). These GPCR entities include three main families that coupled to different G proteins (Gs, Gi and Gq) in this study. Examples of Gs-GPCRs are A2A-adenosine receptor, Gi-GPCR is A1 adenosine receptor, and Gq-GPCRs are P2Y1,P2Y2 and P2Y6 receptors. These examples of detected GPCR entities was investigated in this paper to examine the possible different signalling in skeletal muscle cells. Indeed, investigation of the different families (Gs, Gi and Gq) of GPCRs might help to confirm the expression and understand the expected signalling and functional role of these receptors.
Effect of adenosine receptor ligands on cAMP levels
mRNA encoding A2A and A1 adenosine receptors was detected in skeletal muscle in this paper, where A2A adenosine receptors were anticipated to elevate cAMP levels and A1 adenosine receptors would likely inhibit cAMP production.
Treatment of myotube cells with the non-selective adenosine receptor agonist NECA (Castanon et al., 1994; Klotz et al., 1998)at concentrations anticipated to activate A2A and A2B adenosine receptors (100 nM and 10 µM, respectively) for 10 minutes showed significant increases in cAMP compared to vehicle (0.01% DMSO). Treatment of myotube cells with the selective A2A adenosine receptor agonist CGS21680 (100 nM)(Ongini et al., 1999), however, did not induce any increase in cAMP. The stimulatory effect of NECA was significantly inhibited by the selective A2B adenosine receptor antagonist PSB603 (10 µM)(Borrmann et al., 2009), p < 0.001 (Figure 3).
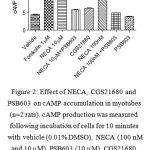 |
Figure 2: Effect of NECA, CGS21680 and PSB603 on cAMP accumulation in myotubes(n=2 rats). cAMP production was measured following incubation of cells for 10 minutes with vehicle (0.01% DMSO), NECA (100 nM and 10 µM), PSB603 (10 µM), CGS21680 (100 nM) and forskolin. (***) p < 0.001 versus vehicle or NECA+PSB603. Data were analyzed using one way ANOVA test followed by Bonferroni post-hoc.
|
The potential coupling of A1 adenosine receptors to inhibition of cAMP was investigated using the A1 receptor-selective agonist S-ENBA (Haynes et al., 1998; Hussain et al., 1995). However, neither basal nor forskolin (1 µM)–evoked elevation of cAMP in myotube cells was altered in the presence of S-ENBA (100 nM) (Figure 4).
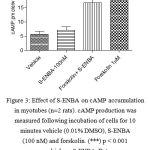 |
Figure 3: Effect of S-ENBA on cAMP accumulation in myotubes(n=2 rats). cAMP production was measured following incubation of cells for 10 minutes vehicle (0.01% DMSO), S-ENBA (100 nM) and forskolin. (***) p < 0.001 versus vehicle or S-ENBA. Data were analyzed using one way ANOVA test followed by Bonferroni post-hoc.
|
In order to investigate the presence of other components of the adenosine system (Figure 5), the expression for the enzymes and transporters required for adenosine cycling was assessed.
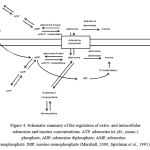 |
Figure 4: Schematic summary of the regulation of extra- and intracellular adenosine and inosine concentrations.ATP: adenosine tri-(di-, mono-) phosphate; ADP; adenosine diphosphate; AMP; adenosine monophosphate. IMP;inosine monophosphate(Marshall, 2000; Spielman et al., 1991)
|
Adenosine deaminase,adenosine kinase and S-adenosylhomocysteine hydrolase mRNA expression were detected in the skeletal muscle tissue in this study. In addition, ecto-5′ nucleotidase and ectonucleotide pyrophosphatase/phosphodiesterase 1, 2 and 3 mRNA were also detected in the skeletal muscle. Nucleoside transporters mRNA were detected as well(Table 1).
Table 1: RNA transcript intensity values for genes related to adenosine machineryin mixed skeletal muscle from 3 replicates generated from two male Wistar rats. The number represents the relative intensity values for these genes which are all above tbp (TATA box binding protein) reference gene.
| Gene | Gene name | Rat A | Rat B | ||||
| A | B | C | A | B | C | ||
| Ada | Adenosine deaminase | 2.1 | 1.7 | 1.8 | 1.6 | 1.7 | 2.0 |
| Adk | Adenosine kinase | 2.7 | 3.8 | 3.1 | 3.3 | 3.4 | 3.1 |
| Ahcy | S-adenosylhomocysteine hydrolase | 3 | 2.8 | 2.3 | 4.1 | 3.7 | 4.1 |
| Slc28a1 | Solute carrier family 28 (nucleoside transporters) 1 | -1 | -1.2 | -1.2 | -2.7 | -3.1 | -2.5 |
| Slc28a2 | Solute carrier family 28 (nucleoside transporters) 2 | 3.2 | 3 | 3.5 | 0.5 | 0.2 | 0.8 |
| Slc29a1 | Solute carrier family 29 (nucleoside transporters) 1 | 5 | 4.2 | 5.4 | 4.9 | 5 | 4.9 |
| Nt5e | 5′ nucleotidase, ecto | -0.7 | -0.7 | -0.9 | -0.5 | -0.3 | -0.7 |
| Enpp1 | Ectonucleotide pyrophosphatase/phosphodiesterase 1 | 1.7 | 1.2 | 1.2 | 1.7 | 1.7 | 2 |
| Enpp2 | Ectonucleotide pyrophosphatase/phosphodiesterase 2 | 0.6 | 0.3 | 0.7 | 0.6 | 1.1 | 0.9 |
| Enpp3 | Ectonucleotide pyrophosphatase/phosphodiesterase 3 | 1.4 | 1.2 | 2.1 | 1.6 | 2.3 | 2.3 |
| Tbp | TATA box binding protein | -0.2 | 0.0 | 0.3 | 0.3 | 0.8 | -0.2 |
Elevation of intracellular calcium ion levels in myotubes
mRNA encoding P2Y1, P2Y2 and P2Y6 receptors was detected using the microarray in this paper. As the majority of P2Y receptors are Gq-coupled, Ca2+-imaging techniques were employed to investigate their functional coupling.
748 myoblast cells were imaged from four animals. ATP (1 mM) elevated intracellular calcium ion levels in all 748 myoblast cells (imaged from four animals; 150-250 cells/animal), with a peak increase in fluorescence ratio (∆FR; Fura-2 340/380 nm excitation) of 0.33 ± 0.06 after approximately one minute, while 575 cells responded to 10 µM UTP (0.18 ± 0.08 ∆FR). Thus, around 77% and 100% of cells responded to UTP and ATP, respectively (Figure 8) and (Figure 9).
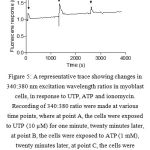 |
Figure 5: A representative trace showing changes in 340:380 nm excitation wavelength ratios in myoblast cells, in response to UTP, ATP and ionomycin. Recording of 340:380 ratio were made at various time points, where at point A, the cells were exposed to UTP (10 µM) for one minute, twenty minutes later, at point B, the cells were exposed to ATP (1 mM), twenty minutes later, at point C, the cells were exposed to ionomycin (4 µM); (imaged from four animals; 150-250 cells/animal). |
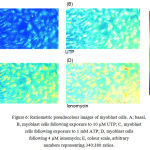 |
Figure 6: Ratiometric pseudocolour images of myoblast cells. A; basal, B, myoblast cells following exposure to 10 µM UTP; C, myoblast cells following exposure to 1 mM ATP; D, myoblast cells following 4 µM ionomycin; E, colour scale, arbitrary numbers representing 340:380 ratios. |
Two sets of myoblast cells were imaged from 4 different rats. One set (713 cells) were investigated for responses to ATP alone, while ATP responses in the other set (815 cells) were assessed after 3 minutes exposure to MRS2179, a selective P2Y1 receptor antagonist (Boyer et al., 1998). There was no significant difference in the response between the two sets either in AUC or in Peak (Figure 10).
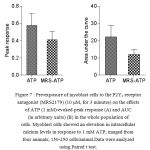 |
Figure 7: Pre-exposure of myoblast cells to the P2Y1 receptor antagonist(MRS2179) (10 μM, for 3 minutes) on the effects of ATP (1 mM)-evoked peak response (A) and AUC (in arbitrary units) (B) in the whole population of cells. Myoblast cells showed an elevation in intracellular calcium levels in response to 1 mM ATP; imaged from four animals; 150-250 cells/animal.Data were analyzed using Paired t test.
|
Discussion
GPCRs expression was examined in this paper using Agilent microarray.Adenosine and purienerigc receptors entities were found to be expressed in skeletal muscle in this paper. These GPCRs are somewhat less well-known in terms of their activity in the skeletal muscle system. Relatively little information in the literature is reported in both normal and disease state about the role of these GPCRs in functional activities and in signal transduction of skeletal muscle tissues. Regarding 38 CPCRs detected in skeletal muscle in this paper, three main families of GPCRs (Gs, Gi and Gq) were detected in skeletal muscle tissue using the microarray. Examples include Gs-GPCR (β-adrenoceptor, A2A adenosine receptors), Gi-GPCR (A1 adenosine receptor) and Gq-GPCR (P2Y1 and P2Y2 receptors). Moreover, adra2a mRNA were detected in QRT-PCR (Taqman) and these agreed with the microarray. These GPCRs were investigated in this paper for further signalling and functional roles in skeletal muscle.
The signalling (functionality) associated with these receptors has not previously been investigated in detail in skeletal muscle. Therefore, conventional second messenger studies (investigating cAMP and Ca2+) were conducted to assess their functionality.
cAMP is an important second messenger in skeletal muscle. It was found to increase the expression of members of the orphan family of nuclear receptors, subfamily 4 (NR4A), compared to other nuclear receptors in skeletal muscle (Maxwell et al., 2005). These transcription factors regulate the gene expression of proteins responsible for fat and glucose metabolism through up-regulating the mRNA expression of pyruvate dehydrogenase kinase 4 (PDK4), forkhead box protein O1 (FOXO1), peroxisome proliferator-activated receptor-γ coactivator (PGC-1α), phosphatidate phosphatase LPIN1 (lipin-1α), GLUT4 and muscle phosphofructokinase (Pfkm) (Chao et al., 2007; Kanzleiter et al., 2010; Lessard et al., 2009). The implication of this is that activation of NR4A receptors might improve glucose glycolysis, glucose transport and lipid oxidation in skeletal muscle, and consequently NR4A receptors might be a therapeutic target for diabetes and obesity. Another critical second messenger is calcium, which transduces extracellular signals into numerous intracellular events in many cell types. Indeed, the functions of calcium range from short-term responses, such as contraction and activation of some enzymes (such as adenylyl cyclase), to longer-term responses such as gene expression (Berridge, 1997). In skeletal muscle, calcium has a crucial role for contraction (Berchtold et al., 2000). When calcium is released from sarcoplasmic reticulum, it binds to troponin and pulls tropomyosin allowing the myosin to bind to the actin, consequently, contraction occurs (Berchtold et al., 2000). Calcium might also improve contraction-stimulated glucose uptake through activating GLUT4 translocation, calmodulin-dependent protein kinases, calmodulin and protein kinase Cs (Ihlemann et al., 1999; Jessen et al., 2005; Wright et al., 2004; Youn et al., 1991). However, the mechanism is still unclear.
One family, which was investigated, was adenosine receptors, which are divided into A1, A2A, A2B and A3 adenosine receptors based on pharmacology and coupling to cAMP production. A1 and A3 adenosine receptors are coupled to inhibitory Gi-proteins, whereas the A2A and A2B adenosine receptors are coupled to stimulatory Gs proteins.
In this paper, A1 and A2A adenosine receptor mRNA was detected in skeletal muscle tissue using the microarray. This is consistent with a previous study that showed that mRNA encoding for adenosine A1 and A2A receptors was detected in rat primary skeletal muscle cells and tissues using northern blot (Lynge et al., 2003).
In order to examine the signalling of adenosine receptors and particularly to investigate the Gs-coupling GPCRs, we examined cAMP accumulation in primary rat skeletal muscle cells. NECA, a non-selective adenosine receptor agonist (Castanon et al., 1994; Klotz et al., 1998), was used to examine activation of the A2A or A2B adenosine receptor, while S-ENBA was used to examine activation of the A1 adenosine receptor. S-ENBA did not show any inhibition of cAMP, although the concentration of S-ENBA chosen is consistent with that (100 nM) shown to increase whole cell currents of both inner-wall and cannula-derived human Schlemm’s canal cells through A1 adenosine receptors (Karl et al., 2005). However, little in the literature is reported about rats. The lack of response to A1 adenosine receptor stimulation in this study is in line with a previous study that showed forskolin-evoked cAMP was not suppressed by the A1 adenosine receptor agonist, R-PIA in rat primary skeletal muscle (Lynge et al., 2003).
However, NECA, a non-selective agonist for adenosine receptors (Castanon et al., 1994; Klotz et al., 1998), stimulated cAMP accumulation at both 100 nM and 10 µM. The concentration of NECA which was used in this study is in line with that (100 nM) shown to increase cAMP levels in rat coronary endothelial cells (Bindewald et al., 2004). To examine which adenosine receptor (A2A or A2B) leads to increases in cAMP levels, CGS21680, an A2A adenosine receptor-selective agonist (Ongini et al., 1999) and PSB603, an A2B adenosine receptor-selective antagonist (Borrmann et al., 2009), were employed. CGS21680 did not alter cAMP levels. However, PSB603 blocked the effect of NECA. This is consistent with a previous study which showed that the stimulation of A2B adenosine receptors by NECA activates adenylyl cyclase and increased cAMP selectively, and not the A2A adenosine receptors which were not stimulated by CGS21680 in rat primary skeletal muscle cells (Lynge et al., 2003). The concentration which was used in this study for PSB603 is in line with that (10 µM) shown to inhibit adenosine-induced bicarbonate ion secretion in duodenal rats through A2B adenosine receptors (Ham et al., 2010). Similarly, the concentration of CGS21680 used in this study is also in line with that (100 nM) shown to elevate rabbit carotid body cAMP content (Chen et al., 1997), and (100 nM) shown to enhance cAMP accumulation in hippocampal nerve terminals of aged rats(Rebola et al., 2003). Therefore, the A2B adenosine receptor is an active receptor with regards to cAMP modulation. Regarding A2A adenosine receptor, the lack of response for A2A adenosine receptors might indicate that the number of A2A adenosine receptors might be too small to elicit adenylyl cyclase activation. As indicated above for the β-adrenoceptors, another explanation for the lack of effect of A2A adenosine receptor activation is the mismatch between mRNA and protein expression. Also as suggested above, since skeletal muscle contains multiple cell types (satellites, myoblasts and myotubes), receptor expression might be restricted to a specific cell type.
The mRNA expression of adenosine receptors, together with the functional coupling of the A2B adenosine receptor, suggests a role for adenosine in skeletal muscle function. A2B adenosine receptor activation was found to increase NR4A expression in smooth muscle (Mayer et al., 2011), it is possible, therefore, that A2B adenosine receptors affect NR4A through the cAMP pathway in skeletal muscle, and consequently, A2B receptors might modulate fat and glucose metabolism in skeletal muscle tissue. This is supported by the fact that 1) NR4A mRNA was found to be expressed in skeletal muscle using microarray in this study. 2) cAMP was found to be involved in increase of expression of NR4A in skeletal muscle (Kawasaki et al., 2011; Pearen et al., 2008; Pearen et al., 2006). 3) NR4A was shown to be reduced in skeletal muscle of diabetic animals (Fu et al., 2007). 4) NR4A was associated with genes related to glucose and fatty acid utilization through up-regulating the mRNA expression of PDK4, FOXO1, PGC-1α and lipin-1α (Pearen et al., 2008). 5) NR4A null mice after high-fat feeding compared with wild-type animals was shown to exhibit decreased mRNA expression of GLUT4 and PDK4 and Lipin 1α and impaired insulin receptor substrate 1 (IRS-1) phosphorylation and insulin resistance in skeletal muscle, and slower blood glucose clearance and increased body weight and decreased energy usage (Chao et al., 2009). 6) In C2C12 cells, C2C12 siRNA-NR4A cells were shown to decrease mRNA expression of fatty acid translocase (CD36/fat), uncoupling protein-3 (UCP3) and GLUT4 compared to wild type native C2C12 cells (Maxwell et al., 2005). 7) In C2C12 cells transfected with adenovirus-mediated NR4A expression, non-insulin glucose uptake was shown to be increased significantly compared to normal C2C12 cells (Chao et al., 2007). Taken together, modulation of A2B adenosine receptor by ligands might affect glucose and fatty acid utilization in skeletal muscle. Therefore, the implication of this is that A2B adenosine receptor agonists should be recommended to be investigated as a therapeutic option in diabetes or obesity.
Adenosine could reach skeletal muscle either from the bloodstream, the motor neuron innervations or the skeletal muscle itself. As skeletal muscle expressed ecto-5’-nucleotidase (ecto-5’-NT) and ecto-phosphodiesterasesin this study (Table 4‑1), it is possible that skeletal muscle mediates adenosine generation through the extracellular cAMP-adenosine pathway. This is supported by the fact thatinterstitial accumulation of 5’-AMP (intermediary metabolite of adenosine synthesis) and adenosine was observed afterincubation newborn rat skeletal muscle cellswith exogenous cAMP (Chiavegatti et al., 2008). This effect was inhibited by using the ecto-phosphodiesterase (1,3-dipropyl-8-sulfophenylxanthine (DPSPX)) and ecto-5’-NT(alpha, beta-methylene adenosine 5′-diphosphate (AMPCP)) inhibitors (Chiavegatti et al., 2008; Tofovic et al., 1991; Zimmermann, 1992) in whichecto-phosphodiesterase inhibitors inhibit the conversion of cAMP to 5’-AMP and ecto-5’-NT inhibitors inhibit the conversion of 5’-AMP to adenosine.
Furthermore, adenosinecould be also transported into or out of the rat primary skeletal muscle cells through an equilibrative nucleoside transporter,ENT1(SLC29A1) transporter. This may be due to the fact that when incubation rat primary skeletal muscle cells with the adenosine transporter inhibitor nitrobenzylthioinosine,the ENT1 transporter inhibitor (Ackley et al., 2003; Geiger et al., 1985),the rate of extracellular adenosine accumulation in the electro-stimulated muscle cells was larger compared with control cells(Lynge et al., 2001).
In addition, adenosinecan be metabolized in skeletal muscle through adenosine kinase and adenosine deaminase, producing adenosine monophosphate (AMP) and inosine, respectively.Inosine was shown to be implicated in cellular proinflammatory responses to ischemia inmice skeletal muscle and was also reported to activate A3adenosine receptor in mast cells(Jin et al., 1997; Wakai et al., 2001). However, this issue is not understood yet.AMP generated by the action of adenosine kinase, can be used to regenerate ATP in skeletal muscle. However, intracellular adenosine and homocysteinecan be produced from S-adenosylhomocysteine (AdoHcy)through S-adenosylhomocysteine hydrolase (ahcy). Homocysteine could be then recycled into cysteine. Indeed, low plasma cysteine level was reported to be associated with progressive loss of human skeletal muscle mass(Droge et al., 1998).
Another family of receptors, the P2Y receptors, was investigated using Ca2+-imaging. P2Y receptors are a family of plasma membrane GPCRs involved in several cellular functions and are divided into P2Y1, P2Y2, P2Y4, P2Y6, P2Y11, P2Y12, P2Y13 and P2Y14. In this paper, mRNA for P2Y1, P2Y2, and P2Y6 receptors were detected in skeletal muscle using the microarray. This is consistent with a previous study that these receptors were also expressed in mouse C2C12 myoblast and myotubes (Banachewicz et al., 2005). However, in one study in the literature, the expression of P2Y1 and P2Y2 was not detected in human skeletal muscle fibre using immunoblotting and immunohistochemistry. Nevertheless, these receptors were expressed in the vasculature (Borno et al., 2011). This might be ascribed to the difference in physiology between human and rat species or the disconnect between mRNA and protein levels, as suggested previously.
The vasodilatatory effect of the purinergic system was shown to be ~50% lower in diabetic patients compared to control subjects, although the distribution and mRNA expression of receptors were similar in both groups(Borno et al., 2011). Moreover, ATP, localized at the nerve terminal, may be released after stimulation of the prejunctional neurones, leading to activation of P2Y receptors. ATP was also shown to activate glucose uptake in mouse C2C12 skeletal muscle cells through P2 receptors (Kim et al., 2002). Taken together, P2Y receptors might have a therapeutic role in skeletal muscle and diabetes. It is possible, therefore, that the activation of P2Y1, P2Y2 and P2Y6 receptors by agonists in skeletal muscle might be therapeutic targets for diabetic patients.
Little is known about the effects of P2Y receptor activation on skeletal muscle. The effects of P2Y agonists (ATP and UTP) were tested on levels of intracellular calcium. Intracellular calcium concentration was increased by UTP, which was mainly attributed to P2Y receptors, since UTP is a selective agonist for P2Y2 receptors (El-Tayeb et al., 2006). The explanation behind the fewer number of cells (77%) responding to UTP is possibly due to the fact that the P2Y2 receptors expression might be different during the stage of differentiation for the cells or relative RNA expression level might not reflect the protein expression level in all cells population. Ionomycin was used as a positive control. Ionomycin is supposed to produce a maximum calcium response. However, in the protocol followed, in which I used ionomycin at the end of the protocol, it is possible that the small response of ionomycin and the differences in the background colour (Figure 9) are due to issues regarding the loading of the fura-2 dye.
As UTP was shown to increase calcium level in skeletal muscle cells in this paper, and UTP was shown to activate ERK dependant on calcium in mouse C2C12 myoblasts (Banachewicz et al., 2005), and ERK was shown to have a role in myoblast proliferation (Bennett et al., 1997; Jones et al., 2001), it is possible that UTP through P2Y2 receptor play a role in skeletal muscle growth. Moreover, as P2Y1, P2Y2 and P2Y6 receptors mRNA was detected in skeletal muscle in this study, and it was also shown that at least UTP as a selective P2Y2 receptor increase calcium level in skeletal muscle cells in this study, it is possible that P2Y receptor might play a role in contraction in skeletal muscle. The implication of this is that P2Y receptors might improve contraction-stimulated glucose uptake. Therefore, P2Y receptor agonists should be recommended to be investigated for diabetes.
The response for ATP was found to be higher than the response for UTP. This possibly suggests that ATP might work through the P2Y1 receptor, not through the P2Y2, and that UTP might work through the P2Y2. MRS2179, the P2Y1 receptor-selective antagonist (Boyer et al., 1998) was investigated to block the effect of ATP. MRS2179 did not inhibit the effect of ATP.
The concentration which was used in this study for MRS2179 is consistent with that (10 µM) shown to prevent ERK activation induced by oxygen and glucose deprivation in rat hippocampal slices (Traini et al., 2011), and is also consistent with that observed to block P2Y1 receptors associated with endogenous calcium activity in mouse astrocytic processes (Di Castro et al., 2011). It might be that other receptorscontributed to the response of ATP, such as P2Y2,P2Y6 and P2X5. The concentration used in this study for ATP (1 mM) was possibly too high relative to concentration used for MRS2179 (10 µM), in particular ATP and MRS2179 has similar relative affinity for P2Y1 receptors, Ki=48 nM and Ki=84 nM, respectively (Waldo et al., 2002; Webb et al., 1996). In other words, the concentration used for MRS2179 did not block the effect of ATP. Therefore, it is suggested to take the concentration used for ATP into consideration and perform concentration response curve for ATP or try different concentrations of both ATP and MRS2179. Further selective antagonists for P2Y1 receptors, such as MRS2500 (Cattaneo et al., 2004; Hechler et al., 2006) could be also used to clarify the involvement of P2Y1 receptors. Alternatively, siRNA investigations might allow definition of the role of particular P2 receptors in ATP- and UTP-evoked calcium responses.
As ATP increase calcium level in skeletal muscle in this study, and ATP was shown to stimulate the proliferation of cancer cells (Deli et al., 2008), and to stimulate the proliferation of astrocytes via P2Y receptors (Neary et al., 2009), it is possible that P2Y receptors play a role in skeletal muscle growth.
Regarding signalling via Gi-GPCRs (A1 adenosine receptor), the activation of these GPCRs did not inhibit forskolin-evoked cAMP. The different explanations behind the lack of response for the activation of Gi-GPCRs might be due to: 1) As skeletal muscle expressed adcy2 and adcy6, it is possible that decrease in cAMP level by inhibition of AC2 and AC6 through Gi protein might be neutralized by activation of AC through Gβγ subunit. This is supported by the fact that Gβγ subunit was found to increase AC2 activity in insect ovarian Sf9 cells infected with recombinant baculovirsus (B-rACII) (Tang et al., 1991), and coexpressed Gi protein in Sf9 cells was also found to inhibit AC2 and AC6 activity (Taussig et al., 1994). 2) The receptors might not couple to Gi protein subunit, therefore, no effect was observed for ligands. 3) Gi protein might not be expressed in skeletal muscle; a potential significant influence is that the conditions for culturing myotubes are different from those in vivo, including intermittent innervation and variable (time, concentration, etc.) exposure to hormones. 4) The mismatch between mRNA and protein expression of these receptors, as suggested previously. As activation of any of the identified Gi GPCRs failed to decrease cAMP levels, it is strongly supported that these GPCRs did not couple to Gi subunit. However, further investigation is suggested to examine the protein expression of these receptors and Gi subunit using immunoblotting and immunocytochemistry. Moreover, investigation is recommended to test the signalling of these receptors using cAMP assay in presence of electrode to mimic the in vivo conditions for this primary cell culture. Further investigation is also suggested to examine the coupling of these receptors to Gi protein using pertusis toxin, for example, the effect α2A-adrenoceptors of ERK phosphorlyation can be examined if ERK phosphorlyation occurred through coupling to Gi protein. Indeed, inhibition of ERK phosphorlyation should be observed in the presence of pertusis toxin. Furthermore, siRNA for Gβγ subunit is suggested to examine the effect of these GPCRs activation on the cAMP level.
Conclusion
These findings provided evidence for functionally-active A2B adenosine receptors in skeletal muscle which might be important for skeletal muscle fat and glucose metabolism and skeletal muscle growth. These findings also provide evidence for Gs-coupling for the A2B adenosine receptor and Gq-coupling for P2Y1/P2Y2/P2Y6 receptors. However, these findings did not provide direct evidence for Gi-coupling for Gi-GPCR tested, including the A1 adenosine receptor.
Acknowledgments
I thank Philadelphia University for their partial financial fund.
References
- Akaneya, Y, Tsumoto, T (2006) Bidirectional trafficking of prostaglandin E2 receptors involved in long-term potentiation in visual cortex. J Neurosci26(40): 10209-10221.
- Banachewicz, W, Suplat, D, Krzeminski, P, Pomorski, P, Baranska, J (2005) P2 nucleotide receptors on C2C12 satellite cells. Purinergic Signal1(3): 249-257.
- Bennett, AM, Tonks, NK (1997) Regulation of distinct stages of skeletal muscle differentiation by mitogen-activated protein kinases. Science (New York, N.Y278(5341): 1288-1291.
- Berchtold, MW, Brinkmeier, H, Muntener, M (2000) Calcium ion in skeletal muscle: its crucial role for muscle function, plasticity, and disease. Physiol Rev80(3): 1215-1265.
- Berridge, MJ (1997) Elementary and global aspects of calcium signalling. J Physiol499 ( Pt 2): 291-306.
- Bindewald, K, Gunduz, D, Hartel, F, Peters, SC, Rodewald, C, Nau, S, Schafer, M, Neumann, J, Piper, HM, Noll, T (2004) Opposite effect of cAMP signaling in endothelial barriers of different origin. Am J Physiol Cell Physiol287(5): C1246-1255.
- Blau, HM, Webster, C (1981) Isolation and characterization of human muscle cells. Proceedings of the National Academy of Sciences of the United States of America78(9): 5623-5627.
- Borno, A, Ploug, T, Bune, LT, Rosenmeier, JB, Thaning, P (2011) Purinergic receptors expressed in human skeletal muscle fibres. Purinergic Signal.
- Borrmann, T, Hinz, S, Bertarelli, DC, Li, W, Florin, NC, Scheiff, AB, Muller, CE (2009) 1-alkyl-8-(piperazine-1-sulfonyl)phenylxanthines: development and characterization of adenosine A2B receptor antagonists and a new radioligand with subnanomolar affinity and subtype specificity. J Med Chem52(13): 3994-4006.
- Boyer, JL, Mohanram, A, Camaioni, E, Jacobson, KA, Harden, TK (1998) Competitive and selective antagonism of P2Y1 receptors by N6-methyl 2′-deoxyadenosine 3′,5′-bisphosphate. Br J Pharmacol124(1): 1-3.
- Castanon, MJ, Spevak, W (1994) Functional coupling of human adenosine receptors to a ligand-dependent reporter gene system. Biochem Biophys Res Commun198(2): 626-631.
- Cattaneo, M, Lecchi, A, Ohno, M, Joshi, BV, Besada, P, Tchilibon, S, Lombardi, R, Bischofberger, N, Harden, TK, Jacobson, KA (2004) Antiaggregatory activity in human platelets of potent antagonists of the P2Y 1 receptor. Biochemical pharmacology68(10): 1995-2002.
- Chandra, S, Gross, D, Ling, YC, Morrison, GH (1989) Quantitative imaging of free and total intracellular calcium in cultured cells. Proceedings of the National Academy of Sciences of the United States of America86(6): 1870-1874.
- Chao, LC, Wroblewski, K, Zhang, Z, Pei, L, Vergnes, L, Ilkayeva, OR, Ding, SY, Reue, K, Watt, MJ, Newgard, CB, Pilch, PF, Hevener, AL, Tontonoz, P (2009) Insulin resistance and altered systemic glucose metabolism in mice lacking Nur77. Diabetes58(12): 2788-2796.
- Chao, LC, Zhang, Z, Pei, L, Saito, T, Tontonoz, P, Pilch, PF (2007) Nur77 coordinately regulates expression of genes linked to glucose metabolism in skeletal muscle. Mol Endocrinol21(9): 2152-2163.
- Chen, J, Dinger, B, Fidone, SJ (1997) cAMP production in rabbit carotid body: role of adenosine. J Appl Physiol82(6): 1771-1775.
- Chiavegatti, T, Costa, VL, Jr., Araujo, MS, Godinho, RO (2008) Skeletal muscle expresses the extracellular cyclic AMP-adenosine pathway. Br J Pharmacol153(6): 1331-1340.
- Delbono, O, Xia, J, Treves, S, Wang, ZM, Jimenez-Moreno, R, Payne, AM, Messi, ML, Briguet, A, Schaerer, F, Nishi, M, Takeshima, H, Zorzato, F (2007) Loss of skeletal muscle strength by ablation of the sarcoplasmic reticulum protein JP45. Proceedings of the National Academy of Sciences of the United States of America104(50): 20108-20113.
- Deli, T, Csernoch, L (2008) Extracellular ATP and cancer: an overview with special reference to P2 purinergic receptors. Pathol Oncol Res14(3): 219-231.
- Di Castro, MA, Chuquet, J, Liaudet, N, Bhaukaurally, K, Santello, M, Bouvier, D, Tiret, P, Volterra, A (2011) Local Ca2+ detection and modulation of synaptic release by astrocytes. Nat Neurosci14(10): 1276-1284.
- Droge, W, Hack, V, Breitkreutz, R, Holm, E, Shubinsky, G, Schmid, E, Galter, D (1998) Role of cysteine and glutathione in signal transduction, immunopathology and cachexia. Biofactors8(1-2): 97-102.
- El-Tayeb, A, Qi, A, Muller, CE (2006) Synthesis and structure-activity relationships of uracil nucleotide derivatives and analogues as agonists at human P2Y2, P2Y4, and P2Y6 receptors. J Med Chem49(24): 7076-7087.
- Fredholm, BB, AP, IJ, Jacobson, KA, Linden, J, Muller, CE International Union of Basic and Clinical Pharmacology. LXXXI. Nomenclature and classification of adenosine receptors–an update. Pharmacol Rev63(1): 1-34.
- Fu, Y, Luo, L, Luo, N, Zhu, X, Garvey, WT (2007) NR4A orphan nuclear receptors modulate insulin action and the glucose transport system: potential role in insulin resistance. The Journal of biological chemistry282(43): 31525-31533.
- Ham, M, Mizumori, M, Watanabe, C, Wang, JH, Inoue, T, Nakano, T, Guth, PH, Engel, E, Kaunitz, JD, Akiba, Y (2010) Endogenous luminal surface adenosine signaling regulates duodenal bicarbonate secretion in rats. J Pharmacol Exp Ther335(3): 607-613.
- Haynes, JM, Alexander, SP, Hill, SJ (1998) A1 and A2 adenosine receptor modulation of contractility in the cauda epididymis of the guinea-pig. Br J Pharmacol125(3): 570-576.
- Hechler, B, Nonne, C, Roh, EJ, Cattaneo, M, Cazenave, JP, Lanza, F, Jacobson, KA, Gachet, C (2006) MRS2500 [2-iodo-N6-methyl-(N)-methanocarba-2′-deoxyadenosine-3′,5′-bisphosphate], a potent, selective, and stable antagonist of the platelet P2Y1 receptor with strong antithrombotic activity in mice. J Pharmacol Exp Ther316(2): 556-563.
- Henry, RR, Abrams, L, Nikoulina, S, Ciaraldi, TP (1995) Insulin action and glucose metabolism in nondiabetic control and NIDDM subjects. Comparison using human skeletal muscle cell cultures. Diabetes44(8): 936-946.
- Hudson, BD, Hebert, TE, Kelly, ME Physical and functional interaction between CB1 cannabinoid receptors and beta2-adrenoceptors. Br J Pharmacol160(3): 627-642.
- Hussain, T, Mustafa, SJ (1995) Binding of A1 adenosine receptor ligand [3H]8-cyclopentyl-1,3-dipropylxanthine in coronary smooth muscle. Circ Res77(1): 194-198.
- Ihlemann, J, Galbo, H, Ploug, T (1999) Calphostin C is an inhibitor of contraction, but not insulin-stimulated glucose transport, in skeletal muscle. Acta Physiol Scand167(1): 69-75.
- Jessen, N, Goodyear, LJ (2005) Contraction signaling to glucose transport in skeletal muscle. J Appl Physiol99(1): 330-337.
- Jin, X, Shepherd, RK, Duling, BR, Linden, J (1997) Inosine binds to A3 adenosine receptors and stimulates mast cell degranulation. J Clin Invest100(11): 2849-2857.
- Jones, NC, Fedorov, YV, Rosenthal, RS, Olwin, BB (2001) ERK1/2 is required for myoblast proliferation but is dispensable for muscle gene expression and cell fusion. J Cell Physiol186(1): 104-115.
- Kanzleiter, T, Preston, E, Wilks, D, Ho, B, Benrick, A, Reznick, J, Heilbronn, LK, Turner, N, Cooney, GJ (2010) Overexpression of the orphan receptor Nur77 alters glucose metabolism in rat muscle cells and rat muscle in vivo. Diabetologia53(6): 1174-1183.
- Karl, MO, Fleischhauer, JC, Stamer, WD, Peterson-Yantorno, K, Mitchell, CH, Stone, RA, Civan, MM (2005) Differential P1-purinergic modulation of human Schlemm’s canal inner-wall cells. Am J Physiol Cell Physiol288(4): C784-794.
- Kawasaki, E, Hokari, F, Sasaki, M, Sakai, A, Koshinaka, K, Kawanaka, K (2011) The effects of beta-adrenergic stimulation and exercise on NR4A3 protein expression in rat skeletal muscle. J Physiol Sci61(1): 1-11.
- Kim, MS, Lee, J, Ha, J, Kim, SS, Kong, Y, Cho, YH, Baik, HH, Kang, I (2002) ATP stimulates glucose transport through activation of P2 purinergic receptors in C(2)C(12) skeletal muscle cells. Arch Biochem Biophys401(2): 205-214.
- Klotz, KN, Hessling, J, Hegler, J, Owman, C, Kull, B, Fredholm, BB, Lohse, MJ (1998) Comparative pharmacology of human adenosine receptor subtypes – characterization of stably transfected receptors in CHO cells. Naunyn Schmiedebergs Arch Pharmacol357(1): 1-9.
- Kobilka, BK (2007) G protein coupled receptor structure and activation. Biochim Biophys Acta1768(4): 794-807.
- Lessard, SJ, Rivas, DA, Chen, ZP, van Denderen, BJ, Watt, MJ, Koch, LG, Britton, SL, Kemp, BE, Hawley, JA (2009) Impaired skeletal muscle beta-adrenergic activation and lipolysis are associated with whole-body insulin resistance in rats bred for low intrinsic exercise capacity. Endocrinology150(11): 4883-4891.
- Lynge, J, Schulte, G, Nordsborg, N, Fredholm, BB, Hellsten, Y (2003) Adenosine A 2B receptors modulate cAMP levels and induce CREB but not ERK1/2 and p38 phosphorylation in rat skeletal muscle cells. Biochem Biophys Res Commun307(1): 180-187.
- Marshall, JM (2000) Adenosine and muscle vasodilatation in acute systemic hypoxia. Acta Physiol Scand168(4): 561-573.
- Maxwell, MA, Cleasby, ME, Harding, A, Stark, A, Cooney, GJ, Muscat, GE (2005) Nur77 regulates lipolysis in skeletal muscle cells. Evidence for cross-talk between the beta-adrenergic and an orphan nuclear hormone receptor pathway. The Journal of biological chemistry280(13): 12573-12584.
- Mayer, P, Hinze, AV, Harst, A, von Kugelgen, I (2011) AB receptors mediate the induction of early genes and inhibition of arterial smooth muscle cell proliferation via Epac. Cardiovasc Res90(1): 148-156.
- Millns, PJ, Chapman, V, Kendall, DA (2001) Cannabinoid inhibition of the capsaicin-induced calcium response in rat dorsal root ganglion neurones. Br J Pharmacol132(5): 969-971.
- Neary, JT, Zimmermann, H (2009) Trophic functions of nucleotides in the central nervous system. Trends Neurosci32(4): 189-198.
- Ongini, E, Dionisotti, S, Gessi, S, Irenius, E, Fredholm, BB (1999) Comparison of CGS 15943, ZM 241385 and SCH 58261 as antagonists at human adenosine receptors. Naunyn Schmiedebergs Arch Pharmacol359(1): 7-10.
- Pearen, MA, Myers, SA, Raichur, S, Ryall, JG, Lynch, GS, Muscat, GE (2008) The orphan nuclear receptor, NOR-1, a target of beta-adrenergic signaling, regulates gene expression that controls oxidative metabolism in skeletal muscle. Endocrinology149(6): 2853-2865.
- Pearen, MA, Ryall, JG, Maxwell, MA, Ohkura, N, Lynch, GS, Muscat, GE (2006) The orphan nuclear receptor, NOR-1, is a target of beta-adrenergic signaling in skeletal muscle. Endocrinology147(11): 5217-5227.
- Pedersen, BK (2011) Muscles and their myokines. J Exp Biol214(Pt 2): 337-346.
- Pette, D, Staron, RS (1997) Mammalian skeletal muscle fiber type transitions. Int Rev Cytol170: 143-223.
- Raymond, F, Metairon, S, Kussmann, M, Colomer, J, Nascimento, A, Mormeneo, E, Garcia-Martinez, C, Gomez-Foix, AM (2010) Comparative gene expression profiling between human cultured myotubes and skeletal muscle tissue. BMC Genomics11:
- Rebola, N, Sebastiao, AM, de Mendonca, A, Oliveira, CR, Ribeiro, JA, Cunha, RA (2003) Enhanced adenosine A2A receptor facilitation of synaptic transmission in the hippocampus of aged rats. J Neurophysiol90(2): 1295-1303.
- Spielman, WS, Arend, LJ (1991) Adenosine receptors and signaling in the kidney. Hypertension17(2): 117-130.
- Staron, RS, Kraemer, WJ, Hikida, RS, Fry, AC, Murray, JD, Campos, GE (1999) Fiber type composition of four hindlimb muscles of adult Fisher 344 rats. Histochem Cell Biol111(2): 117-123.
- Tang, WJ, Gilman, AG (1991) Type-specific regulation of adenylyl cyclase by G protein beta gamma subunits. Science (New York, N.Y254(5037): 1500-1503.
- Taussig, R, Tang, WJ, Hepler, JR, Gilman, AG (1994) Distinct patterns of bidirectional regulation of mammalian adenylyl cyclases. The Journal of biological chemistry269(8): 6093-6100.
- Tilakaratne, N, Sexton, PM (2005) G-Protein-coupled receptor-protein interactions: basis for new concepts on receptor structure and function. Clin Exp Pharmacol Physiol32(11): 979-987.
- Tofovic, SP, Branch, KR, Oliver, RD, Magee, WD, Jackson, EK (1991) Caffeine potentiates vasodilator-induced renin release. J Pharmacol Exp Ther256(3): 850-860.
- Toft, I, Bonaa, KH, Lindal, S, Jenssen, T (1998) Insulin kinetics, insulin action, and muscle morphology in lean or slightly overweight persons with impaired glucose tolerance. Metabolism: clinical and experimental47(7): 848-854.
- Traini, C, Pedata, F, Cipriani, S, Mello, T, Galli, A, Giovannini, MG, Cerbai, F, Volpini, R, Cristalli, G, Pugliese, AM (2011) P2 receptor antagonists prevent synaptic failure and extracellular signal-regulated kinase 1/2 activation induced by oxygen and glucose deprivation in rat CA1 hippocampus in vitro. Eur J Neurosci33(12): 2203-2215.
- Wakai, A, Winter, DC, Street, JT, O’Sullivan, RG, Wang, JH, Redmond, HP (2001) Inosine attenuates tourniquet-induced skeletal muscle reperfusion injury. J Surg Res99(2): 311-315.
- Waldo, GL, Corbitt, J, Boyer, JL, Ravi, G, Kim, HS, Ji, XD, Lacy, J, Jacobson, KA, Harden, TK (2002) Quantitation of the P2Y(1) receptor with a high affinity radiolabeled antagonist. Mol Pharmacol62(5): 1249-1257.
- Webb, TE, Feolde, E, Vigne, P, Neary, JT, Runberg, A, Frelin, C, Barnard, EA (1996) The P2Y purinoceptor in rat brain microvascular endothelial cells couple to inhibition of adenylate cyclase. Br J Pharmacol119(7): 1385-1392.
- Wright, DC, Hucker, KA, Holloszy, JO, Han, DH (2004) Ca2+ and AMPK both mediate stimulation of glucose transport by muscle contractions. Diabetes53(2): 330-335.
- Youn, JH, Gulve, EA, Holloszy, JO (1991) Calcium stimulates glucose transport in skeletal muscle by a pathway independent of contraction. Am J Physiol260(3 Pt 1): C555-561.
- Zimmermann, H (1992) 5′-Nucleotidase: molecular structure and functional aspects. Biochem J285 ( Pt 2): 345-365.

