
Manuscript accepted on :
Published online on: 23-12-2015
Plagiarism Check: Yes
Md Koushik Chowdhury, Anuj Srivastava, Neeraj Sharma and Shiru Sharma
School of Biomedical Engineering, Indian Institute of Technology (Banaras Hindu University), Varanasi, Uttar Pradesh - 221 005, India.
DOI : https://dx.doi.org/10.13005/bpj/472
Abstract
The advent of a truly new noninvasive technology for blood glucose level determinations could revolutionize management of diabetes along with increased patient compliance, decrease burden on medical emergency and diabetes related complexities. Herein, we have investigated the potential of using amplitude modulated ultrasound with infrared techniques for blood glucose level determination in non invasive manner. This new noninvasive system with the operating wavelength of 940nm and ultrasound transmitter of 40 kHz has been used in 05 volunteers for the pilot studies. Standard procedures of the oral glucose tolerance test were conducted to check variations in the blood glucose levels. Blood samples for invasive blood glucose readings were obtained from the left hand fingers for every 15min up to 2 hours. Simultaneously noninvasive blood glucose readings were taken every 15min from the right hand fingers up to an entire time period of 2 hours. Overall 45 blood samples and 225 signals were recorded and examined in this pilot study. Close resembles observed between changes in the peak to peak voltage amplitude spectrum in frequency domain of noninvasively blood glucose measured values and the invasive method utilized here. The degree of similarity between the observed signal and the blood glucose level is owing to the novel utilization of the amplitude modulated ultrasound wave (standing wave). It enhances the sensitivity, specificity of near infrared optical method for noninvasive blood glucose determinations. This pilot study indicates the potentiality of the amplitude modulated ultrasound with infrared techniques for the noninvasive blood glucose determinations in human volunteers.
Keywords
Noninvasive; Invasive; Blood glucose level; Diabetes; Modulated ultrasound; Infrared technique
Download this article as:| Copy the following to cite this article: Chowdhury M. K, Srivastava A, Sharma N, Sharma S. The Potential Application of Amplitude Modulated Ultrasound with Infrared Technique for Blood Glucose Level Determination in Non Invasive Manner. Biomed Pharmacol J 2014;7(1) |
| Copy the following to cite this URL: Chowdhury M. K, Srivastava A, Sharma N, Sharma S. The Potential Application of Amplitude Modulated Ultrasound with Infrared Technique for Blood Glucose Level Determination in Non Invasive Manner. Biomed Pharmacol J 2014;7(1). Available from: http://biomedpharmajournal.org/?p=2906 |
Introduction
Diabetes is a metabolic anarchy characterized by surplus of glucose in the blood and tissues of the living human body. Healthy supervision of blood glucose is mandatory to avoid long-term diabetes related complications to vital organs of the body. In this 21 century, Diabetes mellitus is one of the major endocrine ailments of concern that pose a serious life threat to human healthiness. In 2011, the worldwide prevalence of diabetics estimates around 350 million peoples [1] and it is expected to touch several other millions by 2025[2, 3]. Healthy and effective monitoring of blood glucose levels are the primary prerequisite in the proper regulation of therapy programs for the diabetes subjects [2, 4]. At present, the typical method of testing blood glucose involves lancet based pricking of finger, placing a few drops of blood on an examination strip and putting that strip into a meter that displays the blood glucose levels. Meters differ in their characteristics, readability, portability, swiftness, dimension and price [5, 6]. Problems associated with invasive techniques include pain, pricking related patient’s mental agony, time consumption, cost per measurement, potential source for spreading infectious diseases, inability to monitor continuously [5-8]. The entire of these aspects, directs towards a requirement of a secure and suitable noninvasive blood glucose measurement.
The optical sensing of blood glucose in human body is currently a burning research topic of interest. To design and develop a healthy noninvasive method for blood glucose sensing, various optical method includes infrared absorption [9], near infrared scattering [10], Raman spectroscopy [11], fluorescent [12], thermal gradient spectroscopies [13], polarimetric [14], polarization heterodyning [15], photonic crystal [16], photoacoustic [17], photothermal [18], optical coherence tomography (OCT) techniques [19] and ultrasound-modulated optical technique [20]. In noninvasive glucose measurement using above-mentioned methods, common test sites include fingertips, cuticle, finger web, forearm, earlobes, eye etc [20]. Investigations also includes various skin layers (like subcutaneous, dermal, epidermal, combined dermal and epidermal), body fluids (like blood, ocular fluid, sweat, interstitial fluid) etc [2, 3, 20]. Extremely low signal produced by the glucose molecules leads to the design and development complexity of optical noninvasive blood glucose meter in the field of medical science. This phenomenon causes extremely low optical sensing and needs a lot of effort to increase the optical methods sensitivity and specificity for noninvasive blood glucose monitoring [6, 22].
The sensitivity and specificity enhancement of near infrared optical method for noninvasive blood glucose detection, the amplitude modulated ultrasound wave (standing wave) is used. This paper presents a new methodology and an experimental setup to detect blood glucose in noninvasive manner using amplitude modulated ultrasound and infrared techniques.
The organization of the paper is as follows: Section II describes the principle of glucose measurement using amplitude modulated ultrasound and infrared techniques. Section III depicts the system description along with the criteria of wavelength and transducer selection. In section IV, experimental results are furnished. Section V finally concludes the paper followed by the acknowledgment and reference portions.
Materials and Methods
Principle Of Glucose Measurement
The Amplitude Modulated Ultra Sound waves (standing wave) effect on the molecules of the blood medium and its optical measurement
The presented investigations aimed to enhance infrared technique for noninvasive blood glucose measurement by the amplitude modulated ultrasonic manipulation of blood molecules. The amalgamation of these techniques has the potential of new measurement concepts for use in noninvasive detection of blood glucose. Amplitude modulated ultrasonic force (standing wave) causes local increase of molecular concentration. This phenomenon facilitates the measurement of molecular-specific infrared spectra of the suspending phase (blood medium) and molecules independently. It is possible to control the position of molecules with respect to the optically sensitive region of the infrared spectra by changing the frequency of the modulating wave [25-31].
Ultrasonic manipulation of blood constituents
When molecules in the blood medium subjected to an amplitude modulated ultrasound wave (standing wave) so called radiation forces exerted on the blood medium permit their manipulation [21,25,26]. The origins of these forces are the spatial gradients of the sound wave’s acoustic pressure [27]. Therefore, the nodes within a standing wave are regions where particle aggregation (or thinning) occurs [25]. The direction and strength of these forces is influenced by the compressibility which itself is a function of the blood constituent’s properties. The acoustic contrast defines this coefficient of dependency [25, 28-31]. The blood constituents typically travel into the pressure nodes of the sound field. Further, the vibrations produced in blood molecules are dependent on the (i) molecules physical properties like shape, size, weight, etc (ii) amplitude and frequency of the forcing ultrasonic waves [21, 25-31]. In an Amplitude Modulated Ultra Sound wave (standing wave), the pressure amplitude has maximum (antinodal) and zero (nodal) values twice over a distance of one wavelength. A discontinuity, in the propagating phase, for example specific molecules acquires a position-dependent acoustic potential energy by virtue of being in the sound field [25, 28-31]. Suspended molecules therefore tend to move towards and concentrate at positions of minimum acoustic potential energy. For molecules, these localized regions are generally close to pressure nodes, which are separated from each other by distances of half a wavelength. For the case where the molecular diameter is small compared to the ultrasound wavelength, the ‘primary’ radiation force, Fr acting on a molecule of volume Vc located at a distance z from a pressure node is derived from the gradient of the molecule acoustic potential energy [25-31] and is given by:
![]()
Where Po is the peak acoustic pressure amplitude and λ is the wavelength of sound in the aqueous suspending phase, which has a compressibility βw. The function equals to
Where βc is the compressibility of the molecule, ρc and ρw are the densities of the molecule and the suspending phase (blood medium) respectively. Secondary forces drive the concentrated molecules to the local minima of the pressure amplitude, within the pressure nodal planes, to give regions of molecule concentration that appear as columns of clumps striated at half-wavelength separations [25-31].
Acquisition of absorption spectra
Numerous influences are to be quantified when analyzing an IR (Infrared) spectrum as every substance present in the light path changes its light specific intensity at a definite wave number. The legendary Lambert–Beer law is then applied to calculate the absorption A at a particular light wave number v.
![]()
Where I0 represents the background intensity, I signifies the intensity at the particular wave number v of the real measurement [25, 30-31].
The response thus generated in blood molecules with respect to these Amplitude Modulated Ultra Sound wave (standing wave) is picked up by the Infra-red light detector, afterward the signal based information about the constituent blood molecules (specially glucose) is extracted using signal processing algorithm.
Research Design And Methods
Blood glucose measuring system has been described in this section. A study was carried out to find out the suitable wavelength for maximum glucose detection. Subsequently the description of the experimental setup and testing methodology has been detailed.
Wavelength selection and transducer properties
The composition of blood and tissue is complex in nature and there optical property varies accordingly. Moreover, blood glucose provides very weak signal and also got affected by water and surrounding media. The wavelength selection criteria must be rigid and robust for blood glucose measurement in noninvasive manner.
![Figure 1: Absorption spectra of major intracellular absorbers in the wavelength range from 100nm to 6000nm [32].](https://biomedpharmajournal.org/wp-content/uploads/2015/05/Vol-7No1_Pote_Kous_fig1-150x150.jpg) |
Figure 1: Absorption spectra of major intracellular absorbers in the wavelength range from 100nm to 6000nm [32].
|
![Figure 2: Absorption profile of Glucose in the NIR (near infrared) wavelength range from 1000nm to 2400nm [33].](https://biomedpharmajournal.org/wp-content/uploads/2015/05/Vol-7No1_Pote_Kous_fig2-150x150.jpg) |
Figure 2: Absorption profile of Glucose in the NIR (near infrared) wavelength range from 1000nm to 2400nm [33].
|
The molecular extinction coefficients of oxygenated hemoglobin and melanin and the absorption coefficient of water are shown in Fig. 1. It indicates melanin, water; oxyhemeglobin plays a major role in variation of optical properties of tissue over the wavelength. The absorbance property of major intracellular absorbers like melanin, water, oxyhemeglobin is less in red and NIR region. Most animal cells and tissues are considered nearly transparent in the spectral range from about 700 nm to 1100 nm owing to the lack of efficient one-photon absorbers. For this phenomenon, the region extending from 700nm to 1100nm is called as optical window for biological tissue. The depth of penetration of light is several millimeters in this so-called optical window region of the biological tissues [32].
From Fig. 2 it can be depicted that at wavelength 1037nm, the absorption of glucose is high but absorption profile of water at this wavelength is also maximum [33].
![Figure 3: Absorption cross-section of Oxy-Hemoglobin and Reduced Hemoglobin at R-NIR region [34].](https://biomedpharmajournal.org/wp-content/uploads/2015/05/Vol-7No1_Pote_Kous_fig3-150x150.jpg) |
Figure 3: Absorption cross-section of Oxy-Hemoglobin and Reduced Hemoglobin at R-NIR region [34].
|
The absorption spectra for oxyhemeglobin and deoxyhemeglobin in the wavelength range of 1000nm to 1200nm are unalike in nature. But this dissimilarity of absorption phenomenon is fairly less in the range of 900 to 980nm as indicated by the Absorption profile of Oxy-Hemoglobin and Reduced Hemoglobin at Red-Near infrared region in Fig. 3. [34]. Light absorption profile changes with respect to the magnitude of blood oxygenation [34, 35]. Considering the above phenomenon tissue’s optical window (wavelength around 940nm) is the most suitable for glucose detection. Although glucose has relatively lower absorption around this wavelength, but due to minimum attenuation of optical signal by other constituents, desired depth of penetration can be achieved with substantial energy available for absorption by the glucose. Moreover, the commercial availability of IR LED diode at 940nm has leaded us to use this wavelength for the experiments.
According to the specifications supplied by the manufacturer, ultrasonic transducers which are selected for experimental purpose were built in aluminum case size of 0.30″H x 0.43″ Diameter. They are sold in matched pairs; operate at frequency of 40.0±1.0KHz, with capacitance level of 2000pF±20%. It can withstand a maximum input voltage of 20 Vrms. Ultrasound Transmitter- Bandwidth: 5.0 kHz @ 90dB, Sound pressure level: 92dB @ 40.0 ± 1.0 kHz. Ultrasound Receiver-Bandwidth: 5.0 kHz @ -75dB, Sensitivity: 67dB @ 40 ± 1.0 kHz.
Block level Description
Figure 4 illustrates the block diagram of the experimental setup. The experimental setup is based on amplitude modulated ultrasound wave (standing wave) and near infrared (NIR) optical technique unit. Synchronous square wave generator provides square pulses to the IR LED (Infra Red Light Emitting Diode) .Light from the IR LED is fed to the Finger Holder. Modulating signal from sine wave generator and high frequency carrier wave from carrier generator are fed to the modulator to produce amplitude-modulating signal. The amplitude-modulated signal produced by Modulator is fed to Ultrasound Transmitter, which is attached to Finger Holder. Ultrasound receiver is attached to finger holder, which detects the magnitude and frequency of amplitude modulated ultrasound wave (standing wave) .The directions of the light, and ultrasound waves were perpendicular to each other. The infrared light ray as passed through the ultrasonic focus zone to obtain the maximum value of the amplitude modulated ultrasound light signal. The amplitude modulated ultrasound light signal as detected by IR LED detector, it is sensitive in the region of near infrared zone. The acquired signal is then processed by MATLAB software. It also automates the process of collecting the amplitude modulated ultrasound wave based light waveform data from Digital Storage Oscilloscope (DSO) at specified intervals. Infrared light detector senses the amplitude modulated ultrasound based light signal embedded with blood glucose information. Low noise amplifier (LNA) amplifies the output of the light detector. Precautions had been taken to achieve good SNR (signal to noise ratio) and to reduce the effect of random noise, external interferences, etc.
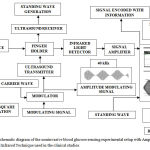 |
Figure 4: The schematic diagram of the noninvasive blood glucose sensing experimental setup with Amplitude Modulated Ultrasound and Infrared Technique used in the clinical studies.
|
Study subjects
A total of 05volunteers (03men and 02women) aged 18 years or older (mean 32 years) were studied in these clinical experiments. The volunteers were in good health, took no medication, and were randomly selected from different racial groups. The study protocol was approved by the institutional (IMS-BHU) review board. A signed informed consent was obtained from all the volunteers.
Experimental protocol
To check the functionality of the noninvasive blood glucose detection experimental setup, standard Oral Glucose Tolerance Test (OGTT) was carried on the 05 volunteers.
The steps followed for carrying out OGTT as given below:
The trials were held in the morning and the volunteers were instructed to fast (water is allowed) for 8–12 hours prior to the tests.
Step 1
Fasting blood glucose level of the volunteers has been measured at 0min by our noninvasive blood glucose meter based on amplitude modulated ultrasound with infrared technique and by an established invasive blood glucose detection method.
Step 2
Solution of 75gm (approx.) of glucose in 100ml (approx.) of water was given to the subjects for drinking within a 5min time frame after step 1.
Step 3
This stage involves acquisition of noninvasive and invasive blood glucose readings at every 15min up to a total period of 2 hours.
Analytical procedures
All data processing was performed using a specially designed program written in MATLAB. During each experiment five sets of signal data was recorded. In the Fast Fourier Transform (FFT) domain, peak to peak voltage amplitude of these consecutive signals is obtained. These peak to peak amplitude values of the 5 consecutive signals were averaged, normalized and used as a function of time or as a function of actual blood glucose concentration.
Results
The ability to monitor variations in glucose presence at certain concentrations in the blood-tissue matrix, a complex physiological environment, requires a sensitive and highly specific method. The study had shown that the potential use of amplitude modulated ultrasound with infrared technique can be used for this purpose. In this study noninvasive blood glucose readings were acquired from human subjects. Calibrations were done by invasive glucose detection method to validate these noninvasive readings. A total of 45 blood samples for blood glucose measurements and 225 data based signals were recorded and processed in all of these experiments. Table 1 shows the settings used for the experiment. Figure 5 depicts the observed signal of a volunteer at 0 min, 60min and 120min. whereas figure 6 depicts the voltage amplitude spectrum of the observed signal of the same volunteer at 0 min, 60min and 120min respectively. The time sequence relationship between the invasive blood glucose readings and the noninvasive blood glucose readings of a volunteer had been given in Fig. 7. We adjusted the prediction partiality by the first reference blood glucose content, i.e., the expected data was adjusted to the calculated value. The obtained full data sets for blood glucose content are presented using the Clarke error grid analysis in Fig. 8. [36-41]. Figure 8 presents the result for Clarke error grid analysis obtained using the data sets as obtained from the volunteers. The data plots included are, for the A zone: 91.11%, B zone: 08.88%, C zone: 0%, D zone: 0%, and E zone: 0%. Here all the prediction plots exist in zones A and B. To improve these predictions below 100 mg/dl and above 250mg/dl, noise reduction and accurate blood glucose content measurement is essential.
Discussion
Diabetes mellitus is a complex metabolic disorder characterized by a common feature of uncontrolled blood glucose level. Once diagnosed with a diabetic mellitus, controlled diet regimen, overweight reduction, physical exercise and insulin injections or oral drugs are administrated to control hypo or hyper blood glucose levels. Controlled blood glucose levels prevent the patients from the medical emergencies like heart disease, blindness, renal failure or body part amputations. Utmost care for blood glucose level and proper medications in diabetes plays a vital role. Improvements in the medical diagnostic technology had introduced with the next generation of bloodless, painless, noninvasive blood glucometers. Continuous noninvasive glucometers can prevent medical emergencies arisen due to hypo and hyper glycemic conditions.
Results of our clinical studies performed on volunteer’s demonstrated good correlation between changes in the voltage amplitude in the Fourier domain of the observed signal with respect to the actual blood glucose concentration in subjects during an OGTT. The results of these tests are in good agreement with those obtained in our previous studies [30, 31].The major advantages of the amplitude modulated ultrasound with infrared technique in comparison with previous proposed optical techniques are; 1) the high resolution due to the potential use of amplitude modulated ultrasound (standing wave), and 2) coherent detection of transmitted photons which contains blood glucose level related information. These unique characteristics permit measurements of blood glucose related tissue optical properties with high accuracy, sensitivity, and resolution. The glucose-induced changes in the output light signal obtained in our experiments were due to: 1) the capability of the amplitude modulated ultrasound with infrared technique to monitor glucose induced variation of blood-tissue optical properties without unwanted signal from other layers, and 2) small refractive index mismatch due to less absorption profile of oxyhaemoglobulin, haemoglobulin, water etc. at the tissue optical window range from 700nm to 1100nm. Our study demonstrates the potentiality of noninvasive blood glucose measurements using amplitude modulated ultrasound with infrared technique. It also indicates that the technology based upon infrared technique and modulated ultrasound can be developed to meet the blood glucose level related clinical accuracy requirements. The fluctuations of data points obtained in our experiments is mostly caused by various factors like finger positioning, motion related artifacts, melanin based skin pigmentations, light interferences, time drift, machine drift, blood pressure and other physiological variations, etc. Our next studies will be focused on the implementation of new improved algorithms, data recording, averaging and signal processing in order to improve accuracy of noninvasive blood glucose monitoring with these new method (amplitude modulated ultrasound with infrared technique). Various physiological and environmental influences cause the change in blood-tissue optical properties and therefore cause variation in voltage amplitude in the Fourier domain of the observed signals. Glucose induced osmotic changes, heterogeneity of blood-tissue optical properties, various artifacts (motion), drifts (machine, temperature), blood pressure and heart rate effects on the voltage amplitude of the signal in Fourier domain will be evaluated in our future studies.
Table 1: Setting used for the Experiment
| Parameter | Value |
| 1. Infrared LED operating wavelength | 940nm |
| 2.Ultrasound operating frequency | 40.0±1.0 kHz |
| 3.Interval between two readings
(a) Noninvasive readings (b) Invasive readings |
15min 15min |
| 4.Total Time | 120min |
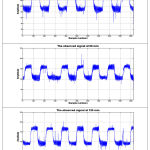 |
Figure 5: Depicts the observed signal of a volunteer at 0 min, 60min and 120min.
|
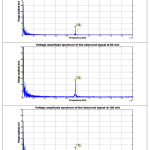 |
Figure 6: Depicts the voltage amplitude spectrum of the observed signal of a volunteer at 0 min, 60min and 120min.
|
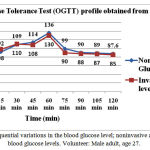 |
Figure 7: Sequential variations in the blood glucose level; noninvasive and invasive blood glucose levels. Volunteer: Male adult, age 27.
|
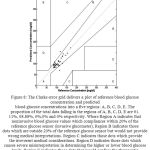 |
Figure 8: The Clarke error grid delivers a plot of reference blood glucose concentration and predicted blood glucose concentrations into a five regions: A, B, C, D, E. The proportion of the total data falling in the regions of A, B, C, D, E are 91.11%, 08.88%, 0%,0% and 0% respectively. Where Region A indicates that noninvasive blood glucose values which compliances within 20% of the reference glucose sensor (invasive glucometer), Region B indicates those dots which are outside 20% of the reference glucose sensor but would not provide wrong medical interpretations. Region C indicates those dots which provide the irreverent medical considerations. Region D indicates those dots which causes severe misinterpretation in determining the higher or lower blood glucose levels. Region E indicates those dots that would confuse the therapeutic management for higher or lower blood glucose levels and vice-versa.
|
Conclusion
The usefulness of the combined method of the amplitude modulated ultrasound along with infrared technique for developing a noninvasive blood glucometer has been reported in this paper. The new concept for the blood glucose measurement using this hybridized idea was investigated and the investigation confirmed the assumption of the concept.
The infra-red LED operating in the wavelength region of 940nm and modulated ultrasound transmitter of 40 kHz has been used to conduct standard OGTT tests over 05 human subjects for noninvasive blood glucose measurement. Cross validation of the noninvasive results has been performed by the invasive blood glucose detection method.
Results of the conducted OGTT tests using this new method (amplitude modulated ultrasound with infrared technique) depicts that these new method is capable of non-invasive, real-time, and sensitive monitoring of the blood glucose concentration in human subjects. Although at present these new method needs standardization with invasive glucose sensors. In near future, it will significantly decrease the number of invasive measurements and provide continuous monitoring of the blood glucose concentration.
Acknowlegment
The Authors would like to thank Coordinator, Administrative and Laboratory Staff of the School of Biomedical Engineering, Indian Institute of Technology (Banaras Hindu University), Varanasi, for supporting this research work.
Conflict Of Interest Statement
Author’s conflict of interest disclosure
The authors stated that there are no conflicts of interest regarding the publication of this article.
Author’s Contribution
Md. Koushik Chowdhury Phd Research Scholar wrote the manuscript and also corresponding author of the manuscript. Md. Koushik Chowdhury and Anuj Srivastava performed experimentations and data collection during the studies. Dr.Neeraj Sharma (Associate. Professor) and Dr.Shiru Sharma (Assistant Professor) helped in overall supervision for the experimentations, final editing of the manuscript and getting necessary formal applications for the experimental purposes.
References
- G. Danaei, M. M. Finucane, Y. Lu, G. M. Singh, M. J.Cowan, C. J. Paciorek, J. K. Lin, F. Farzadfar, Y. H.Khang, G. A. Stevens, M. Rao, M. K. Ali, L. M. Riley,C. A. Robinson, and M. Ezzati, ‘National, regional, and global trends in fasting plasma glucose and diabetes prevalence since 1980: systematic analysis of health examination surveys and epidemiological studies with 370 country-years and 2·7 million participants’, Lancet 378, 31 (2011).
- “The fourth edition of the IDF Diabetes atlas”, International Diabetes Federation, 2009.
- S. Wild, G. Roglic, A. Green, R. Sicree, and H. King, “Global Prevalence of Diabetes. Estimates for 2000 and projections for 2030.” Diabetes Care, vol.27, 2003, pp 1047–1053
- Peter J.Watkins, ABC of Diabetes, (Fifth Edition), London : BMJ Books, 2003.
- http://diabetes.webmd.com/ (13/08/2013)
- Tuchin V.V. (ed.) [Handbook of Optical Sensing of Glucose in Biological Fluids and Tissues]. CRC Press, Taylor & Francis Group, London (2009), pp 41-64.
- A. Tura, A. Maran and G. Pacini, “Non-invasive glucose monitoring: Assessment of technologies and devices according to quantitative criteria”, Diabetes Research and Clinical Practice, vol. 77, 2007, pp. 16-40
- “Special issue on non-invasive glucose monitoring with optical technique”, IEEE Leos Newsletter, April 1998.
- J. Tenhunen, H. Kopola, and R. Myllyla, “Non-invasive glucose measurement based on selective near infrared absorption: requirements on instrumentation and special range,” Measurement, vol.24,1998,pp.173–177.
- J.S. Maier, S.A. Walker, S. Fantini, M.A. Franceschini, and E. Gratton, “Possible correlation between blood glucose concentration and the reduced scattering coefficient of tissues in the near infrared,” Opt. Lett., vol. 19, 1994, pp. 2062–2064.
- A.M.K. Enejder, T.G. Scecina, J. Oh, M. Hunter, W.-C. Shih, S. Sasic, G.L.Horowitz, and M. S. Feld, “Raman spectroscopy for noninvasive glucose measurements,”J.Biomed. Opt., vol. 10, 2005, 031114.
- J. Lakowicz and B. Maliwal, “Optical sensing of glucose using phase modulation fluorimetry,”Anal.Chim.Acta,vol.271,1993,pp.155–164.
- S-j Yeh, C. F. Hanna, S. Kantor, et al., “Differences in thermal optical response between intact diabetic and nondiabetic human skin,” Proc. SPIE, vol.4958, 2003, pp. 213–224.
- S. Bockle, L. Rovati, and R.R. Ansari, “Polarimetric glucose sensing using the Brewster-reflection off-eye lens: theoretical analysis,” Proc. SPIE, vol. 4624, 2002, pp. 160–164.
- C. Chou, C.Y. Han, W.C. Kuo, Y.C. Huang, C.M. Feng, and J.C. Shyu, “Noninvasive glucose monitoring in vivo with an optical heterodyne polarimeter,” Appl. Opt., vol. 37, 1998, pp. 3553–3557.
- V.L. Alexeev, A.C. Sharma, A.V. Goponenko, S. Das, I.K. Lednev, C.S. Wilcox, D.N. Finegold, and S.A. Asher, “High ionic strength glucose sensing photonic crystal,” Anal. Chem., vol. 75, 2003, pp. 2316–2323.
- Z. Zhao, Pulsed Photoacoustic Techniques and Glucose Determination in Human Blood and Tissue, doctoral thesis, University of Oulu, Finland, 2002.
- H.S. Ashton, H.A.MacKenzie, P. Rae, Y.C. Shen, S. Spiers, et al., “Blood glucose measurements by photoacoustics,” CP463 Photoacoustic and Photothermal Phenomena: 10th International Conference, 1999, pp. 570–572.
- K.V. Larin, M.S. Eledrisi, M. Motamedi, R.O. Esenaliev, “Noninvasive blood glucose monitoring with optical coherence tomography: a pilot study in human subjects,” Diabetes Care, vol. 25, no. 12, 2002, pp. 2263–2267.
- L.Zhu, J.Lin, B.Lin, H.Li., “Noninvasive blood glucose measurement by ultrasound-modulated optical technique”,Chinese Optical Letters, 11(2),2013,pp.021701-1to 021701-5.
- Ter Haar, G. and S.J. Wyard, Blood cell banding in ultrasonic standing wave fields: A physical analysis. Ultrasound in Medicine and Biology, 1978. 4(2): p. 111-123.
- O. Khalil, “Noninvasive glucose measurement technologies: an update from 1999 to the dawn of the new Millenium,” Diabetes Technol. Ther., vol. 6, no. 5, 2004, pp. 660–697.
- Md.K.Chowdhury, A.Srivastava, N.Sharma, S.Sharma, “Challenges & Countermeasures in Optical Noninvasive Blood Glucose Detection”, International Journal of Innovative Research in Science, Engineering and Technology (IJIRSET), Vol.2, issue 1,Jan 2013,pp.329-324.
- A.Srivastava, Md.K.Chowdhury, S.Sharma, N.Sharma, “Blood Glucose Monitoring Using Non Invasive Optical Method: Design Limitations and Challenges”, International Journal of Advanced Research in Electrical, Electronics and Instrumentation Engineering (IJAREEIE), Vol. 2, issue 1, Jan 2013, pp.615-620.
- S. Radel , M. Brandstetter, B.Lendl, ‘Observation of particles manipulated by ultrasound in close proximity to a cone-shaped infrared spectroscopy probe’, Ultrasonics 50 (2010), pp.240–246.
- W. Terence Coakley, ‘Ultrasonic separations in analytical biotechnology’, Trends in Biotechnology (1997), pp. 506-511.
- L.V. King, ‘On the acoustic radiation pressure on spheres’, Proceedings of the Royal Society of London (1934), pp.212–240. A147.
- K. Yosioka, Y. Kawasima, ‘Acoustic radiation pressure on a compressible sphere’, Acustica 5 (1955), pp.167–173.
- F. Petersson, A. Nilsson, C. Holm, H. Jonsson and T. Laurella, ‘Separation of lipids from blood utilizing ultrasonic standing waves in microfluidic channels’, The Analyst, The Royal Society of Chemistry,(2004),129,pp.938-943. doi: 10.1039/b409139f.
- Md. K. Chowdhury, A. Srivastava, N. Sharma, & S.Sharma, ‘The influence of blood glucose level upon the transport of light in diabetic and non-diabetic subjects’. International Journal of Biomedical and Advance Research, 4(5) (2013), pp.306-316. doi:10.7439/ijbar.v4i5.357.
- A. Srivastava, Md. K. Chowdhury, S. Sharma, N. Sharma, ‘Optical Clearance Effect Determination of Glucose by near Infrared Technique: An Experimental Study using An Intralipid Based Tissue Phantom’, International Journal of Advances in Engineering & Technology (IJAET), Volume 6 Issue 3, pp. 1097-1108, July 2013.
- K. Konig, “Multiphoton microscopy in life sciences”, Journal of Microscopy, vol. 200-2, 2000, pp. 83-104.
- J. Tenhunen, H. Kopola, and R. Myllyla, “Non-invasive glucose measurement based on selective near infrared absorption: requirements on instrumentation and special range,” Measurement, vol. 24, 1998, pp. 173–177.
- O.W. Assendelft, Spectrophotometry of Hemoglobin Derivates, Royal Vangorcum Ltd., Assen, 1970.
- Y.Mendelson, “Pulse oximetry: theory and applications for noninvasive monitoring,” Clin. Chem., vol. 38, 1992, pp.1601–1607.
- D. J. Cox, W. L. Clarke, L. Gonder-Frederick, S. Pohl, C. Hoover, A. Snyder, L. Zimbelman,W. R. Carter, S. Bobbitt, and J. Pennebaker, “Accuracy of perceiving blood glucose in IDDM,” Diabetes Care, vol. 8, no.6, pp. 529–536, 1985.
- W. L. Clarke, L. A. Gonder-Frederick,W. Carter, and S. L. Pohl, “Evaluating clinical accuracy of systems for self-monitoring of blood glucose,”Diabetes Care, vol. 10, no. 5, pp. 622–628, 1987.
- A. Maran et al. “Continuous Subcutaneous Glucose Monitoring in Diabetic Patients” Diabetes Care, Volume 25, Number 2, February 2002.
- B.P. Kovatchev et al. “Evaluating the Accuracy of Continuous Glucose Monitoring Sensors” Diabetes Care, Volume 27, Number 8, August 2004.
- E. Guevara and F. J. Gonzalez, Prediction of Glucose Concentration by Impedance Phase Measurements, in MEDICAL PHYSICS: Tenth Mexican Symposium on Medical Physics, Mexico City (Mexico), 2008, vol. 1032, pp.259-261.
- E. Guevara and F. J. Gonzalez, Joint optical-electrical technique for noninvasive glucose monitoring, REVISTA MEXICANA DE FISICA, vol. 56, no. 5, pp. 430-434, Sep. 2010.

