
Manuscript accepted on :
Published online on: 16-12-2015
Plagiarism Check: Yes
Sibi Jose1* and Ishaq Zaafarany2
1Department of Chemistry, Sadhu Vaswani College, Bairagarh, Bhopal - 462 001, India.
2Department of Chemistry, Umm-Al-Qura University, Makkah Al Mukarramah, Saudi Arabia.
Corresponding Author E-mail: kojose@yahoo.com
Abstract
This paper deals with the synthesis and characterization of a glimepiride-samarium complex a rare earth’s metal. Glimepiride is an oral hypoglycemic agent. The conductometric titrations were conducted using monovariation method which shows the ligand metal ratio as 2:1. Molar conductance value indicate that complex is non-ionic in nature. Analytical results agree to the molecular formula (C24H34N4O5S)2 Sm.4H2O. Rare earth’s element Sm shows the high coordination sites. The structure of the complex was assigned as hexagonal in which ligand moleculas joining the central Sm(III) atom with nH2O molecules. Infrared spectral studies have supported coordination of sulphonyl oxygen on one side and enolic oxygen attached from other side and four water molecule attached by four co-ordination sides with the samarium ion. Mass spectral and nuclear magnetic resonance studies of the complex proposed structure of the complex on the basis of analytical data.
Keywords
Synthesis; Characterization; Samarium Glimepiride complex
Download this article as:| Copy the following to cite this article: Jose S, Zaafarany I. Synthesis, Physico-chemical, Spectral and Hypoglycemic Activity of Samarium Complex of Glimepiride, An Oral Antidiabetic Drug. Biomed Pharmacol J 2013;6(1) |
| Copy the following to cite this URL: Jose S, Zaafarany I. Synthesis, Physico-chemical, Spectral and Hypoglycemic Activity of Samarium Complex of Glimepiride, An Oral Antidiabetic Drug. Biomed Pharmacol J 2013;6(1). Available from: http://biomedpharmajournal.org/?p=2628 |
Introduction
The study of chemistry and chemical reaction of co-ordination compound help in establishing structure activities relationship. It has been reported that in biological activity metal complex is more potent and less toxic as compared to the free ligand1-6. Inorganic chemistry and the use of metals in therapeutic drugs have become increasingly important over the last two of decades resulting in a variety of exciting and valuable drugs such as cis-platin for cancer.
Recently metals in medicine has been recognised internationally as an important area for research. In this account the role of rare earth’s metal neodymium has been undertaken for study7-10.
In recent years, much attention is given to the use of suphonyl ureas because their high complexing nature with essential metals. Sulphonyl ureas are effective for non-insulin dependent diabetes mellitus11-13.
These compounds are completely absorbed on oral administration. They are metabolized by liver and are excreted predominantly through urine. Complexation of sulphonyl ureas with rare earth’s metals have been studied in detail by several workers14-16. A persual of available literatures shows that systemic study on complexation samarium with variours hypoglycemic drugs is relatively more important17-19.
Here in the synthesis and characterization of samarium trioxide complex with glimepiride have been described20-22.
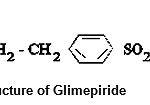 |
Figure 1: Structure of Glimepiride.
|
Ligand-metal ratio
For determining the ligand-metal ratio molar solutions were prepared of metal salt and ligand in 1:2 ratio and conductometric titrations were carried out by using monovariation method (Fig 2). The ligand-metal ratio (1:2) was also confirmed by the way of doing the jobs method23 of continuous variation using ” conductance. The indexed values were indicates 1:2 metal ligand ratio (Fig 3).
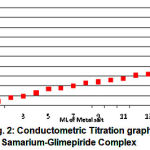 |
Figure 2: Conductometric Titration graph of Samarium-Glimepiride Complex.
|
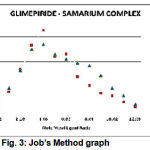 |
Figure 3: Job’s Method graph.
|
Table 1: Glimepiride with samarium trioxide (Job’s Method)
| Glimepride – 0.005 M | Sm2O3– 0.005 M | ||||
| Solvent – 90% Ethanol | Temperature 31±1°C | ||||
| Mole metal | Conductance | Conductance | Corrected-conductance | ||
| ligand | X10-4Mhos | X10-4Mhos | X10-4Mhos | ||
| ratio | M:S | S:L | M:L | C1+C2-C3 | |
| C1 | C2 | C3 | |||
| 00:12 | 0.94 | 1.62 | 2.52 | 0.04 | 0 |
| 01:11 | 1.57 | 1.55 | 2.96 | 0.16 | 0.12 |
| 02:10 | 2.2 | 1.48 | 3.34 | 0.34 | 0.3 |
| 03:09 | 2.8 | 1.46 | 3.73 | 0.53 | 0.49 |
| 04:08 | 3.45 | 1.36 | 4.16 | 0.65 | 0.61 |
| 05:07 | 3.95 | 1.15 | 4.66 | 0.44 | 0.4 |
| 06:06 | 4.47 | 1.06 | 5.07 | 0.46 | 0.42 |
| 07:05 | 4.58 | 0.89 | 5.29 | 0.28 | 0.24 |
| 08:04 | 5.14 | 0.75 | 5.68 | 0.21 | 0.18 |
| 09:03 | 5.13 | 0.71 | 5.69 | 0.15 | 0.11 |
| 10:02 | 5.62 | 0.42 | 5.19 | 0.13 | 0.09 |
| 11:01 | 6.21 | 0.32 | 6.45 | 0.08 | 0.04 |
| 12:00 | 6.69 | 0.22 | 6.87 | 0.04 | 0 |
Table 2: Glimepiride with samarium trioxide (Job’s Method)
| Glimepride – 0.002 M | Sm2O3– 0.002 M | ||||
| Solvent – 90% Ethanol | Temperature 31±1°C | ||||
| Mole metal | Conductance | Conductance | Corrected-conductance | ||
| ligand ratio | X10-4Mhos | X10-4Mhos | X10-4Mhos | ||
| M:S | S:L | M:L | C1+C2-C3 | ||
| C1 | C2 | C3 | |||
| 00:12 | 0.93 | 1.66 | 2.51 | 0.08 | 0 |
| 01:11 | 1.58 | 1.54 | 2.93 | 0.19 | 0.08 |
| 02:10 | 2.21 | 1.44 | 3.32 | 0.33 | 0.27 |
| 03:09 | 2.84 | 1.36 | 3.7 | 0.5 | 0.42 |
| 04:08 | 3.47 | 1.25 | 4.18 | 0.54 | 0.48 |
| 05:07 | 3.96 | 1.14 | 4.64 | 0.46 | 0.38 |
| 06:06 | 4.48 | 1.06 | 5.12 | 0.42 | 0.34 |
| 07:05 | 4.61 | 0.92 | 5.14 | 0.39 | 0.31 |
| 08:04 | 5.02 | 0.79 | 5.44 | 0.37 | 0.29 |
| 09:03 | 5.14 | 0.6 | 5.45 | 0.29 | 0.21 |
| 10:02 | 5.62 | 0.46 | 5.89 | 0.19 | 0.09 |
| 11:01 | 6.21 | 0.34 | 6.42 | 0.13 | 0.07 |
| 12:00 | 6.69 | 0.21 | 6.84 | 0.06 | 0 |
Experimental
Pure sample of glimepiride (trade name, amaryl) with m.f. (C24H34N4O5S) was received from Ipca laboratories Limited, Ratlam. Solvents and metal salts used were of the analytical grade. Melting point was determined by Parkin Elmer model melting point apparatus and are uncorrected, pH values determined on Lab. India pH analyser. IR spectra of ligand and complex were recorded with Perkin Elemer Spectrometer in the range of 4000-450 cm-1 (CDRI Lucknow). Nuclear magnetic spectral studies of ligand and complex were obtained from CDRI Lucknow (India).
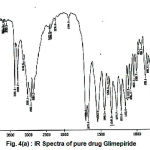 |
Figure 4(a) : IR Spectra of pure drug Glimepiride.
|
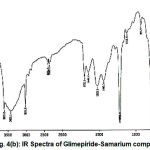 |
Figure 4(b): IR Spectra of Glimepiride-Samarium complex.
|
Table 3: Synthesis and physico chemical characteristics of Glimepiride-Samarium Complex.
| Ligand/Complex | Ligand | Colour | %yield | Stability | Free energy |
| Metal | constant | change | |||
| Ratio | Logk | (-DF) | |||
| (L/mole) | KCal/mole | ||||
| Glimepiride (Ref) | – | White | – | – | – |
| Glimepiride-samarium | 02:01 | Shiny | 58 | 11.83 | -16.26 |
| Complex | Greyish | ||||
| Crystal |
Synthesis
A weighed quantity of glimepiride (2mol.) was dissolved in minimum quatity of 80% DMF. The samarium trioxide solution was prepared by dissolving it separately in the same solvent. A few drops of alkali NaOH solution was added to metal solution to increase the solubility. Metallic solution was added slowly with stirring into the solution of ligand at room temperature maintaining the pH between 6 to 8 by adding dilute NaOH solution and refluxed for 2-4 hours24-27 at 80°C. The solutions were left for crystallization at room temperature for 18-20 hours, shiny grey coloured crystals of complex were obtained which were filtered, washed, dried and then their melting points determined were recorded.
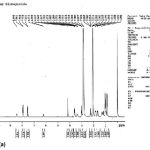 |
Figure 5(a):
|
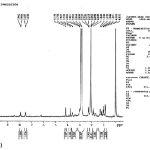 |
Figure 5(b):
|
Table 4: Analytical data of complex.
| Drug/Complex | Elemental analysis found (calculated) | M.P. | |||||
| C | H | N | S | Metal | Water | °C | |
| C24H34N4O5S | 58.77 | 6.93 | 11.92 | 6.53 | – | – | 207 |
| -58.8 | -6.95 | -11.94 | -6.57 | ||||
| (C24H34N4O5S)2.Sm(OH2)4 | 49.93 | 5.93 | 9.09 | 5.18 | 12.98 | 4.98 | 212 |
| -50.9 | -6.01 | -9.89 | -5.65 | -13.25 | -3.21 |
Analysis of complex
The resulting complex so formed was characterized by its elemental analysis through SEM-EDAX method and IR, NMR studies (table 5 and 6) and metal was estimated by EDTA method.
Table 5: IR Absorption data of the complex in cm-1.
| Ligand/Complex | u (NH) | u (C=O) | u (S=O) | u (C-O) | u (C=N) | u (SO2N | u (M-O) | u (H2O) |
| C24H34N4O5S | 3681 | 1706 | 1215 | – | – | 3020 | – | – |
| (C24H34N4O5S)2.Sm.4H2O | 3680 | 1702 | 1216 | 1648 | 2365 | 3021 | 670 | 3429 |
Results and Discussion
Structure determination
IR Absorption Studies
The infrared spectrum of glimepiride and metal complex were recorded on Perkin Elemer Spectrometer RX1 (4000-450 cm-1). The major absorption bands for the infrared frequencies and the corresponding assignments are listed in
Table 5.
Table 6: Some Important characteristics 1HNMR signals for glimepiride and its samarium complex.
| Glimepiride Pure | dValue (ppm) | Assignment |
| Ligand | Glimepiride-Samarium Complex | |
| 8.44(0.47 Hz) | 7.94(1 Hz) | 1HNMR signal for –NHCO group and for |
| Aronatic proton) | ||
| 6.23(0.39 Hz) | – | NH proton signal for –SO2NH group |
| 1.65(1.36 Hz) | 1.56(0.64 Hz) | -CH2 proton signal |
| 1.04(2.82 Hz) | 1.04(7.1 Hz) | Methyl (-CH3) proton signal |
| – | 3.78(1.11 Hz) | NHCO-M signal (M= metal) |
The Glimepiride metal complex showed a prominent IR absorption band in the region 1706 cm-1 and 1702 cm-1 due to (C=O) carbonyl group28-29. The next IR band of structure significance of the ligand appears at 1215 cm-1 which may be assigned to (S=O) which got shifted at 1216 cm-1 in the complex. The NH group observed at 3681 cm-1 in the ligand (glimepiride) shifted to 3680 cm-1 in samarium glimepiride complex. The IR frequencies of (C=N) group was appeared at 2365 cm-1 in the complex while absent in ligand. The linkage through amide-O and sulphone-O- atom was further supported by the appearance of a band in the far IR region at 670 cm-1 in the complex that may be assignable to M-O frequency which was absent in ligand. The IR frequency region at 3429 cm-1 was assigned to nH2O molecule that may be not found in ligand frequency region. In pure ligand there is no absorption band detected for C-O and C=N due to enolisation are further supporting the structure for glimepiride samarium complex.
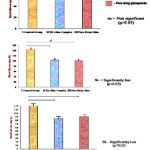 |
Figure 6: Graphical Representation of Comparative Antidiabetic Activity Analysis of Glimepiride-Samarium Complex by Oral Glucose Tolerance Test.
|
NMR Spectral Analysis
The samarium complex of glimepiride [Fig V (b)] the chemical shift ”d value for NH in NHCO was observed at 7.94 ppm while the same –d value in pure ligand glimepiride was observed at 8.44 ppm30 showing a (0.50 ppm) down field shifting. The sulphonyl group in the complex is deshielded to a greater extent. This may be due to the sulphonyl group being adjacent to the bonding site and hence greater deshielding occurs in it31-35.
Table 7: Hypoglycemic Activity by Oral Glucose Tolerance Test.
| Group | Treatment | Blood Glucose (mg/dL) | ||
| (mg/kg body weight) | Fasting | 30 min. | 90 min. | |
| I | Control group | 73.8±2.5884 | 142.8±2.8635 | 120.6±2.4083 |
| + Glucose (2g) | ||||
| + Vehicle | ||||
| II | Samarium complex of | 72.6±2.0736 | 103.8±2.3874* | 84.8±3.4928** |
| Glimepiride (2mg) + | ||||
| Glucose + Vehicle | ||||
| III | Pure drug Glimepiride | 74.4±2.8809 | 100.6±2.7018* | 90.2±2.5884** |
| (2mg) + Glucose + Vehicle |
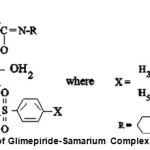 |
Figure 7: Structure of Glimepiride-Samarium Complex.
|
Antidiabetic activity
The isolated glimepiride-metal complex were found to be more potent as compared to the parent drug. Hence as compare to standard synthetic drug the glimepiride-samarium complex36-37 is having more hypoglycemic activity. The hypoglycemic effect of glimepiride as well as metal complex were investigated on the blood sugar levels of male wistar rats by Oral glucose tolerance test38. (PBRI, lab. Bhopal, M.P., India). Analysis of data presented in table (7) reveals that the drug caused a marked decrease in blood sugar level. On comparing the hypoglycemic effect of samarium complex with parent drug it was revealed that in case of Sm- glimepiride treated male wistar rats blood sugar falls to 84.8 ± 3.4928 mg/dl while in glimepiride treated rats blood sugar level falls to 90.2 2.5884 mg/dl. These results clearly indicate a better hypoglycemic activity of Sm-glimepiride complex over its parent drug.39-40
Conclusion
From the monovariation studies conducted by conductivity method and further confirmsed by Job’s method of continuous variation suggest the ligand-metal ratio as L2M. Analytical data agrees to the molecular formula (C24H34N4O5S)2.Sm.4H2O. The structure of the complex proposed on the basis of analytical data and stoichiometry was further supported by IR and NMR spectral studies which suggest the linking of sulphonyl and enolic oxygen to the metal atom. The disappearance of enolic hydrogen in complex as indicated by IR values. The results of NMR spectra are well in agreement with the mol.wt of the complex. Hypoglycemic activities of the complex shows more blood sugar lowering effect as compared to parent ligand. Calculating the toxicity in the complexes and on many trials on monkey’s and men the complex may be introduced as medicine in future.
Acknowledgements
The authors express their sincere and grateful thanks to principal, Sadhu Vaswani College Bairagarh for providing necessary lab facilities, and Quality Assurance Department of Ipca Laborateries Ltd. Ratlam for gift of Glimepiride and IR and NMR spectral analysis.
References
- Ammar, H.O., Salama, H.A., Ghorab, M., and Mahmoud, A.A., Asian J. Pharm. Sci., 2(2): 44-55 (2007).
- Massimo, M.B., Clin Ther., 25: 799-816 (2003).
- Kouichi et al., Diab. Res. Clin. Pract., 68: 250-57 (2005).
- Geinsen, K., Drug Res., 38: 1120-30 (1988).
- Baliar, S., Biswal, S., Sahoo, J., and Murthy, P.N., Inter .J. Pharm. Sci and Nanotech., 2: 1129 (2009).
- Iqbal, S.A., and Qureshi, R., Asian .J. Expt. Sci.,1: 68-70 (1985).
- Iqbal, S.A. and Jacob, G., Orient. J. Chem., 23(3): 1123-26 (2007).
- Iqbal, S.A., Jose, S., and Zaafarany, I., Orient. J. Chem., 28(1): 613-18 (2012).
- Bellamy, L.J., “The infrared spectra of complex molecules”. Methven & Co. Ltd. London (1954).
- Nakamoto, K., “Infra-red spectra of inorganic and co-ordination compound. John Wiley & Sons, Newyork (1963).
- Dyer, J., “Application of Absorption Spectroscopy of Organic Compounds” Prentice Hall of India Pvt. Ltd. Fourth printing., 36 (1978).
- Rao, C.N.R., “Chemical Application of Infrared spectroscopy”. Academic Press, Newyork 258 (1970).
- Chandran, A., Varghese, H.T., Yohannan, C., and Rajendran, G., Orient. J. Chem., 27(2): 611-17 (2011).
- Tawkir, M., Iqbal, S.A. Krishan, B., and Zaafarany, I., Orient. J. Chem., 27 (2): 603-09 (2011).
- Oliveira, G.G.G., Ferraz, H.G., and Matos, J.S.R., J. Therm. Anal. Colorimetry., 29: 267-70 (2005).
- Khan, M.R., and Sahdev., Orient. J. Chem., 27(2): 649-53 (2011).
- Santhi, S., and Namboori, C.G.R., Orient. J. Chem., 27(3): 1203-08 (2011).
- Verma, M., Llala, N.P., Rawat, R., and Phase, D.M., Orient. J. Chem., 27(4): 1775-78 (2011).
- Cullity, B.D. “Elements of X-ray Diffraction”., Second Edn, Wesley Publishing Company INC., 40 (1978).
- Zaitoon, B.A., Yousef, R., and Musleh, S.M., Orient. J. Chem., 27(4): 1357-74 (2011).
- Seshadri, N., Suresh, C., Seshaiah, K., and Suresh, M., Orient. J. Chem., 27(4): 1685-90 (2011).
- Geinier, A., “X-ray diffraction in Crystals, Imperfect Crystals and Amorphous Bodies”., San Francisco (1963).
- Job, P., Ann. Clin., 113: 10 (1928).
- Turner, S.E., and Anderson, R.C., J. Am. Chem. Soc., 912: 71 (1949).
- Pena, K., Garcia-cuello, V.S., Giraldo, L., and Moreno-Pirajan, J.C., Orient. J. Chem., 27 (4): 1293-1301 (2011).
- Mehta, A., Vasanti, S., and Tyagi, R., Current Trends in Biotech and Pharm., 3(1): 76-84 (2009).
- Pahovnik, D., Revan, S., Grdadolink, J., and Zagar, E., J. Pharm. Sci., 100 (11): 4700-09 (2011).
- Ashraf M., Siddiqui M.A. and Bhatty Talanta M.K., 15: 559 (1989).
- Rai, B.K., Vidyarthi, S.N., Singh, R- and Ojha A., Orient .J. Chem, 28(3): 1403-09 (2012).
- Bragg W.L. and Bragg W.H., The Crystalline State, A General Survey, London, Vol. l (1993)
- Jenkins R. and Devries J.L., Worked Examples in X-ray Analysis, New York, Springer Verlag (1970).
- Henry N.F.M., Lipson H. and Wooster W.A., The interpretation of X-ray Diffraction Photographs, Macmillan, London (1951).
- Siewers R.E., Nuclear Magnetic Resonance Shift Reagents, Academic, New York (1973).
- Sharma, K.Y. and Prasad, M., Orient .J. Chem., 28(3): 1419-24 (2012).
- Iqbal. S.A., Jose, S. and Zaafarany, I., Orient .J. Chem., 28(1) : 613-18 (2012).
- Nag., A.K., Orient .J. chem., 28(1): 514-45 (2012).s
- Soleymani, R., Salehi, Y.M.., Yousofzad, T., and Cheshmeh Ali, M.K., Orient. J. Chem., 28(2): 627-38 (2012).
- Obeidat, S.M., and Tayyem, B. AL., Orient. J. Chem., 28(2): 795-801 (2012).
- Rehman, F., and Mairaj, S., Orient. J. Chem., 28(2): 881-85 (2012).
- Mary, Y.S., Panicker, C.Y. and Varghese, H.T., Orient. J. Chem., 28(2): 937-41 (2012).

