
Manuscript accepted on :
Published online on: 15-12-2015
Plagiarism Check: Yes
Mohammad Tawkir
Department of Chemistry, Saifia Science College, Barkatullah University, Bhopal - 462 001, India.
Abstract
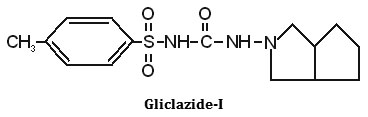
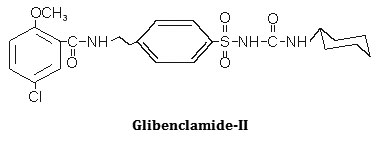
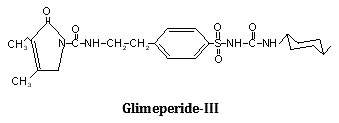
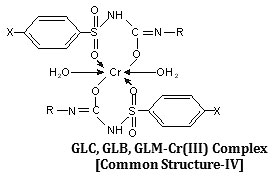
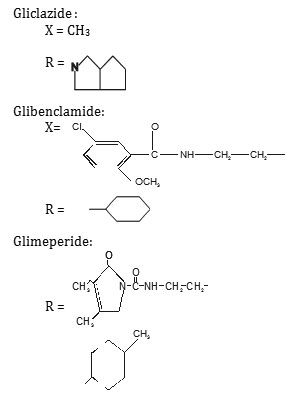
Synthesis, characterization and hypoglycemic activity of chromium(III) complexes with Gliclazide (GLC), Glibenclamide (GLB) and Glimeperide (GLM) oral antidiabetic allopathic drugs have been studied. The conductometric titration using monovariation method indicates that complexes are non-ionic and L2M type. Analytical data agrees with the molecular formulae of complexes viz., (C15H21N3O3S)2Cr·2H2O, (C23H28N3O5SCl)2Cr·2H2O, (C24H34N4O5S)2Cr·2H2O. Structure of complexes was assigned as octahedral in which ligand molecules lie horizontally joining the central chromium atom and two water molecules attached vertically with the metal. Infra-red spectral studies confirm the coordination of sulphonyl oxygen on one side and enolic oxygen from other side with metal ion, IR, Mass and 1H-NMR studies supports structure IV for the complex proposed on the basis of analytical data. Magnetic susceptibility a suggest that the complexes are diamagnetic,
Keywords
Sulphonyl Ureas complexes; Hypoglycemic activity; HPMC-5CPS pellets
Download this article as:| Copy the following to cite this article: Tawkir M. Synthesis, Characterization and Hypoglycemic Activity of Cr (III) Complexes of Sulphonyl-ureas, As Oral Antidiabetics. Biomed Pharmacol J 2013;6(1) |
| Copy the following to cite this URL: Tawkir M. Synthesis, Characterization and Hypoglycemic Activity of Cr (III) Complexes of Sulphonyl-ureas, As Oral Antidiabetics. Biomed Pharmacol J 2013;6(1). Available from: http://biomedpharmajournal.org/?p=2612 |
Introduction
Chromium is an essential metal that appears to have beneficial role in regulation of insulin action, metabolic syndrome and cardiovascular disease. Chromium function in our bodies is critical without it, the harmone insulin would not work. Most of the people are familiar with insulin as the shot diabetes give themselves in order to control their high blood sugar. But what most of the people don’t realize is that insulin is the “Master hormone of our metabolism, it is not only controls blood sugar levels and many other aspects of carbohydrate break down and storage but also directs much of the metabolism involving fat, proteins and energy (calories). Because insulin requires chromium to function properly1. Chromium reduces insulin resistance, this essential trace element could therefore have wide ranging effects on high blood pressure and abnormal blood lipid in addition to lowering blood sugar2.
Kaats et al.,3 suggest that supplementation with chromium picolinate can lead significant improvement in body consumption when a BCI (Body Consumption Index) is used as the outcome criterion that represent a sume of the net gain in non fat mass added to sum of the net looses of body fat. Chromium is a true potentiator of insulin and is known as glucose tolerance factor (GTF) trivalent chromium Cr(III) has been claimed to be a constituent of glucose tolerance factor. Schwartz and Mertz (1959) showed that trivalent chromium (Cr3+) cured the impaired glucose tolerance observed in rats an a chromium deficient diet.
Pandey et al.,4 studied the Cr(III) complexes with Di-benzyl sulphide ligand.
Louise et al5., synthesized homoleptic trimethyl silylacetylide complex of Cr(III), LiF et al6., Synthesize Cr(III) complex and compare anti-hyperglycemic activity shows enhanced antidiabetic activity.
Yang X et al7., synthesize a new chromium complex-chromium (phenylalanine) improves insulin responsiveness and reduces whole body glucose tolerance.
Complexation of sulphonylueas with transition and inner transition metal has been studied in detail by Yoshinaga and Yamamotto8-9 (1966 a,b), Iqbal et al.,10 (1984, 1985, 1986), Dury and Al-Jibori11(2012) Shahriare and Ghammamy12(2012)Modhaviya13(2012),AbdulVudood et al.,14(2012),Sunilkumar and Sharma15(2012) and Jacob and Iqbal16(2010).
A perusal of available literature shows that systemic study on complexation of chromium(III) with sulphonyl ureas is relatively scanty. The study of chemistry and chemical reaction of coordination compounds helps in estabilishing structure activity relationship. It has been reported that the biological activity of metal complexes is more potent and less toxic as compared to the free ligand Singel17 (1982), Brown18 (1982), Phipps19 (1976), Williams20 (1976), Lippard21 (1983), Meares and Wensel22 (1984). In view of the above and in continuation of our work, it is interesting to have an insight into the synthesis of chromium(III) complexes with Gliclazide, Glibenclamide and Glimeperide and to study various structural aspects of the isolated complexes. here, the synthesis and characterization of chromium(III) complexes with sulphonyl ureas have been described.for following drugs.
Experimental
Ligand-Metal ratio
Pure gliclazide m.p. 180°C (Lit.179.5-180.5), 0.005M,pure Glibenclamide m.p. 172.08°C (Lit.170.5-173.5), 0.005M and Glimeperide m.p. 207.00°C (Lit. 206.5-208.00), 0.005M, with chromium chloride 0.01M prepared (AnalaR grade) were separately prepared in purified 90% ethanol, Gliclazide, Glibenclamide and Glimeperide (20 ml.) was diluted to 200 ml. each and titrated conductometrically against chromium chloride at 29±1° Results were plotted in the form of graph which indicates ligand metal ratio as 2:1 (L2M).
Formation of 2:1 (L2M) ratio was also confirmed by Job’s method15 of continuous variation as modified by Turner and Anderson16, using Dconductance as index property. From these values the stability constant (logk) and free energy change (-DF), were also calculated (Irving and Rossotti23-25 (1953, 1954, 1955), Willard et al26., (2000).
Synthesis of complexes
The chemicals used in this synthesis were all of analytical grade. A weighed quantity of Gliclazide, Glibenclamide and Glimeperide (2mol.) was dissolved separately in minimum quantity of 90% ethanol. The chromium chloride solution was prepared by dissolving it separately in the same solvent. Metallic solution was added slowely with stirring into the solution of the ligand at room temperature maintaining the pH between 6.0 to 6.5 by adding dilute NaOH solution. On refluxing the mixture for 3h and on cooling, the complexes separated out, which were filtered off, washed well with ethanol and finally dried in vacuum and weighed.
The elemental analysis of the isolated complexes were carried out using the reported method Jeffery et al27., (1989), Mohammed28 (1989), Scott29 (1960) while chromium was estimated as chromium oxide.
The IR spectrum of the ligands as well as of the complexes were recorded on Perkin Elmer Spectrum RX1 model FTIR (CDRI Lucknow) India, 1H-NMR spectra of the ligand and isolated complexes were recorded on a Bruker AM-200 Spectrometer (CDRI Lucknow) and d6-DMSO was used as a solvent From stochiometry and analytical data,(Table-1,2) the composition of the complex comes out to be (C15H21N3O3S)2Cr·2H2O, (C23H28O5N3SCl)2Cr·2H2O and (C24H34N4O5S)2Cr·2H2O for GLC, GLB and GLM respectively which favours 2:1 (L2:M) ratio. The tentative common structure IV assigned to the complexes on the basis of analytical data is further supported by Thermogravimetric study and XRD data. Cullity30(1978), Bragg and Bragg 31 (1993), Guinier 32 (1952), Henry et al.,33 (1951).
Table 1: Physico-chemical and analytical data of GLC-Cr, GLB-Cr and GLM-Cr complexes.
| S.N. | Complexes | Colour | Yield (%) | M.P. (°C) | Molar conductance W-1cm-1mol-1 |
| 1 | (C15H21N3O3S)2Cr·2H2O | Green | 50.61 | 180 | 29.50 |
| 2 | (C23H28O5N3SCl)2Cr·2H2O | Green | 69.75 | 181 | 27.40 |
| 3 | (C24H34N4O5S)2Cr·2H2O | Green | 54.61 | 180 | 29.50 |
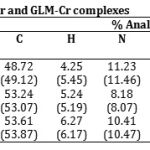 |
Table 2: Elemental analysis of GLC-Cr, GLB-Cr and GLM-Cr complexes.
|
Results and Discussion
Infra-red spectral studies
The IR spectra of ligand and isolated complexes were recorded the range 4000-400 cm-1. The assignments of the infrared spectral bands are based on literature. (Table 5) The strong band in its region of 3355cm-1 (GLC), 3340cm-1 (GLB) and 3350 cm-1(GLM) indicates the presence of coordinated water which was further confirmed by thermal studies.
The proposed structure for the isolated complexes also supported by IR absorption with reference to pioneer workers, Weissberger39 (1956), Cotton40 (1960), Nakamotto41 (1963), Rao42 (1963), Bellamy43 (1964). IR bonds obtained at 1143 ± 20 cm-1, which is the characteristic of combination frequencies resulting form C=O stretching vibration and M-O stretch. Absorption bands due to C=N stretching Dyer et al44., (1966) vibrations are also found in the region 2522 ± 5cm-1. The complexes also displays a band at 1142 cm-1. Which is considered to be associated with nSO2-N band Iqbal et al.,(Table-3)
Table 3: Specific IR assignment of sulphonyl ureas-chromium complexes.
| IR frequencies (cm-1) | Assignments | ||
| GLC-Cr | GLB-Cr | GLM-Cr | |
| 670±5 | 680±2 | 665±10 | Metal oxygen bond |
| 909 | 980 | 908±10 | Aromatic ring vibration |
| 998 | 1020±20 | 990±20 | S=0 frequencies (LJB/359) Bellamy 1964 |
| 1018 | 1055 | 1060 | C-0 of Chelate ring |
| 1142±5 | 1120 | 1128 | SO2-N frequency |
| 1442 | 1435±10 | 1437 | Six membered enolic ring structure modified in complex |
| 1643±5 | 1655±10 | 1640±20 | C-0 stretching frequency (KN/184) Nakamotto 1963 |
| 2522 | 2550±5 | 2520±10 | C=N stretching frequency |
| 3355 | 3340±10 | 3350 | Coordinated water |
| 710±5 | 705±10 | 708±5 | Ar-S linkage (LJB/355) Bellamy 1964 |
| 813±10 | 820±10 | 810±10 | 1-4 disubstituted benzene ring frequency |
1H-NMR Studies
The 1H-NMR spectral data are given in (table 6). It was observed that the singlet due to the amide (NH) proton around (d8.74) in the spectrum of the ligand disappeared in the complex shows the formation of M-O band. This also confirms the deprotonation of amide NH group through enolisation (the appearance of > C=N stretching band observed in IR spectra) (Table-4)
Table 4: 1H-NMR Assignment of GLC-Cr, GLB-Cr and GLM-Cr complexes.
| COMPLEXES | Assignment |
| GLC-Cr | δ0.944-1.855 (t,H,CH3), δ2.264-2.826 (d,H,O-H), δ3.396-4.461 (s,2H,NH), δ7.129 (d,4H,Ar-H), δ7.679 (t,6H,Ar-H), δ7.993 (s,6H,Ar-H) and δ11.343-11.519 (t,H,Cr-OH2). |
|
GLB-Cr |
δ1.407-1.986 (d,2H,CH2), δ2.034-2.852 (d,2H,O-CH3), δ2.935-3.866 (d,3H,NH), δ7.129-7.230 (d,3H,Ar-H), δ7.485-7.669 (d,4H,Ar-H) and δ8.239-8.255 (t,H,Ar-H). |
|
GLB-Cr |
δ1.11-1.44 (CH2), δ1.71-1.96 (CH2), δ3.00-3.14 (NH), δ3.77 (-O-CH), δ6.42 (aromatic), δ3.77 (NH,-CO-Cr), δ6.40 (aromatic), δ6.83-6.89 (aromatic), δ7.30-7.51 (aromatic), δ7.87-7.90 (aromatic), δ7.97-7.94 (aromatic), δ8.11-8.15 (aromatic) and δ10.14 (H,Cr-OH2) |
Other feature of NMR spectrum were the aromatic proton resonances located and the presence of unresolved multiplet suggestive of excessive deshielding of aromatic protons Slichter45 (1963), Akitt46 (1973), Rai and Sharma47 (1973), Dixit and Singh48.,( 2001), Pandey et al.49,( 2003)Iqbal et al.,

Hypoglycemic Studies
Pharmacology is mainly concerned with the responses of living organisms to chemical stimuli. One may further divide the subject from a medical view point, into pharmacodynamics and pharmacotherapy , the former is concerned with the response of living organism to chemical stimuli in the absence of disease, while the later with the response the organism to such stimuli in a pathogenic state. This is the phase of pharmacology (i.e. pharmacotherapy) which is of special interest to the physician.
Pharmacotherapy includes the treatment of the sick with drugs and therefore is of prime importance in practice of medicine. It is fundamental to the health-economy of the people. A compound or a complex which is to be recommended as a drug of utility, must be capable of easy absorption and excretion. It is also essential that neither the absence itself nor the metabolic products thereof should exercise toxicity or any adverse side effect to the patient55-57.
Animal Study
Where necessary such tests should be carried out on animals as rats, rabbits and dogs. When a substance has given satisfactory results for the aforesaid animals then only it may be tried on monkeys and men.
Dosage forms- HPMC-5CPS
enteric coated granules/pellets in capsule shell.
Composition of enteric coated granules
Drug – 5 mg/dose
Lactose – 100 mg.
Starch/sugar sphere – 100 mg.
HPMC- 5CPS – 10 mg.
Water – s.
Preparation of Enteric Coated Grannules
Make a blend of drug and lactose paste the blend through 100# sieve HPMC-5CPS is dissolved in water (2% solution) keep the starch/sugar spheres in conventional coating pan and using HPMC-5CPS solution layering of blend is carried out by conventional method. Pellets prepared, dried in tray dryer at 50°C. Dried pellets are filled in capsule shells.58-60
Hypoglycemic Study on animals(Folin Wu method)68
Pharmacological studies were carried out on male albino rats weighing 150 to 200 g. Animals were divided in three groups A, B and C each group containing eleven animals, so selected that the total weight of animals in each group remained the same.
Animals of all the three groups were kept in experimental conditions and were fed on a fixed particular diet (i.e. milk and bread). When animals were acclimatized to the laboratory conditions then fasting blood sugar was estimated colorimetrically (as abridged in Table 5) for four days using Folin and Wu method17 to ascertain an average blood sugar level. On fourth day doses of Gliclazide, Glibenclamide and Glimeperide were given separately to the animals of group A, B and C respectively.
Table 5: Colorimetric estimation of blood glucose of male albino rats.
| Test Sample | Glucose Standard-I | Glucose Standard-II | Glucose Standard-III |
| 0.05 ml. blood + 3.9 ml. copper reagent + 0.05 ml. sodium tungstate (to coagulate protein) and centrifuge the solution. | 0.01% standard glucose solution (I) | 0.0025% standard glucose solution (II) | |
| 2.0 ml. supernatant liquid of the sample + 2 ml. Harding’s B-solution (NaHCO3 + potassium oxalate + sodium tartrate) | 2 ml. glucose solution + 2 ml. Hardings B – solution | 2 ml. glucose + 2 ml. Harding’s B-solution | 2 ml. Cu reagent + 2 ml. Harding’s B-solution |
| Sample (a) | Sample (b) | Sample (c) | Sample (d) |
| glucose/100 ml. of blood in mg. | II | glucose/100 ml. of blood in mg. |
In case of group (A) animals, after the oral administration of Gliclazide (5.0 mg/kg) fall in blood sugar was noted with increasing duration of time i.e. after ½, 1½, 3½ and 5½ hours.
Table 6(A): Hypoglycemic Activity of Gliclazide Alone.
| Fasting sugar estimated in mg/100 ml. of blood of albino rats
(Group A)(11 Animals) |
Least blood sugar values | Fall in blood sugar | % fall in blood sugar | Average % fall in blood sugar | ||||||||
| I day | II day | III day | IV day | Average Values | IV day after oral administration of Gliclazide 5 mg/kg | |||||||
| 7.30 am. | 8 am | 9 am | 11 am | 1 pm | ||||||||
| 99 | 101 | 103 | 98 | 100.25 | 71 | 70 | 69 | 72 | 69 | 31.25 | 31.17 | |
| 102 | 99 | 98 | 96 | 98.75 | 73 | 72 | 69 | 68 | 68 | 30.75 | 31.14 | |
| 99 | 100 | 101 | 103 | 100.75 | 70 | 69 | 72 | 71 | 69 | 31.75 | 31.51 | 33.88 |
| 99 | 98 | 101 | 102 | 100 | 69 | 65 | 68 | 71 | 65 | 35 | 35.00 | |
| 96 | 98 | 102 | 103 | 99.75 | 62 | 68 | 65 | 75 | 62 | 37.75 | 37.84 | |
| 100 | 102 | 103 | 99 | 101 | 68 | 64 | 72 | 78 | 64 | 37 | 36.63 | |
Table – 6(B): Hypoglycemic Activity of Gliclazide and its Chromium Complex.
| Fasting sugar estimated in mg/100 ml. of blood of albino rats (Group A) | Least blood sugar values | Fall in blood sugar | % fall in blood sugar | Average % fall in blood sugar | ||||||||
| V day | VI day | VII day | VIII day | Average Values | VIII day after oral administration of Gliclazide complex | |||||||
| 7.30 am. | 8 am | 9 am | 11 am | 1 pm | ||||||||
| 98 | 102 | 101 | 99 | 100 | 72 | 73 | 58 | 75 | 58 | 42 | 42.00 | |
| 103 | 101 | 99 | 98 | 100.25 | 71 | 59 | 71 | 74 | 59 | 41.25 | 41.17 | |
| 99 | 102 | 98 | 101 | 100 | 71 | 58 | 71 | 78 | 58 | 42 | 42.00 | 43.31 |
| 98 | 101 | 100 | 102 | 100.25 | 68 | 66 | 55 | 74 | 55 | 45.25 | 45.16 | |
| 98 | 99 | 102 | 101 | 100 | 53 | 68 | 69 | 73 | 53 | 47 | 47.00 | |
| 100 | 103 | 101 | 99 | 100.75 | 69 | 58 | 71 | 73 | 58 | 42.75 | 42.51 | |
On IV day drug was administered orally.
On VII day complex was administered orally at 7.35 am.
N.B. All readings are represented in whole number
The peak time of the effect of Gliclazide has been found to be 1 to 2 hours and duration of action to be 4 to 6 hours.
Table 7(A): Hypoglycemic Activity of Glibenclamide Alone.
| Fasting sugar estimated in mg/100 ml. of blood of albino rats (Group B) | Least blood sugar values | Fall in blood sugar | % fall in blood sugar | Average % fall in blood sugar | |||||||||
| I day | II day | III day | IV day | Average Values | IV day after oral administration of Glibenclamide 5 mg/kg | ||||||||
| 6.00 am. | 8 am | 10 am | 12 noon | 2 pm | 4 pm | ||||||||
| 99 | 103 | 104 | 98 | 101 | 70 | 69 | 68 | 73 | 74 | 68 | 33 | 32.67 | |
| 102 | 100 | 99 | 97 | 99.5 | 70 | 68 | 72 | 74 | 72 | 68 | 31.5 | 31.66 | |
| 101 | 100 | 102 | 103 | 101.5 | 70 | 69 | 70 | 72 | 73 | 69 | 32.5 | 32.02 | 33.72 |
| 100 | 102 | 101 | 101 | 101 | 69 | 68 | 64 | 71 | 75 | 64 | 37 | 36.63 | |
| 98 | 100 | 99 | 102 | 99.75 | 63 | 64 | 69 | 70 | 72 | 63 | 36.75 | 36.84 | |
| 100 | 102 | 103 | 98 | 100.75 | 69 | 68 | 72 | 72 | 74 | 68 | 32.75 | 32.51 | |
Table 7(B): Hypoglycemic Activity of Glibenclamide and its Chromium Complex.
| Fasting sugar estimated in mg/100 ml. of blood of albino rats (Group B) | Least blood sugar values | Fall in blood sugar | % fall in blood sugar | Average % fall in blood sugar | |||||||||
| V day | VI day | VII day | VIII day | Average Values | VIII day after oral administration of Glibenclamide complex | ||||||||
| 6.00 am. | 8 am | 10 am | 12 noon | 2 pm | 4 pm | ||||||||
| 100 | 101 | 103 | 99 | 100.75 | 71 | 51 | 74 | 79 | 80 | 51 | 49.75 | 49.45 | |
| 103 | 101 | 100 | 98 | 100.5 | 70 | 59 | 70 | 76 | 78 | 59 | 41.5 | 41.34 | |
| 101 | 100 | 103 | 99 | 100.75 | 70 | 58 | 69 | 70 | 74 | 58 | 42.75 | 42.51 | 43.61 |
| 101 | 103 | 102 | 102 | 102 | 58 | 69 | 72 | 74 | 76 | 58 | 44 | 43.33 | |
| 99 | 101 | 102 | 100 | 100.5 | 57 | 69 | 68 | 70 | 74 | 57 | 43.5 | 43.33 | |
| 101 | 103 | 101 | 99 | 101 | 59 | 69 | 73 | 74 | 76 | 59 | 42 | 41.68 | |
On IV day drug was administered orally at 6.10 am.
On VII day complex was administered orally at 6.10 am.
N.B. All readings are represented in whole number.
Thereafter animals of group A, were further maintained for normal blood glucose level by way of feeding them on same experimental diet for three more days (i.e. without giving drug or complex). On the 8th day when it was confirmed that all the eleven animals of this groups have returned to their normal blood sugar level, then only the animals were orally administered a dose of Gliclazide-Cr(III) complex (5.0 mg/kg) and fasting blood glucose was recorded again with increasing duration of time (table 8)
Table 8(a): Hypoglycemic activity of Glimeperide alone.
| Fasting sugar estimated in mg/100 ml. of blood of albino rats (Group C) | Least blood sugar values | Fall in blood sugar | % fall in blood sugar | Average % fall in blood sugar | |||||||||
| I day | II day | III day | IV day | Average Values | IV day after oral administration of Glimeperide 5 mg/kg | ||||||||
| 7.00 am. | 8 am | 10 am | 12 noon | 2 pm | 4 pm | ||||||||
| 102 | 101 | 98 | 99 | 100 | 61 | 65 | 67 | 70 | 72 | 61 | 39 | 39.00 | |
| 97 | 98 | 100 | 101 | 99 | 71 | 68 | 69 | 72 | 74 | 68 | 31 | 31.31 | |
| 99 | 96 | 99 | 100 | 98.5 | 63 | 67 | 61 | 70 | 71 | 61 | 37.5 | 38.07 | 37.42 |
| 99 | 98 | 100 | 101 | 99.5 | 69 | 64 | 59 | 64 | 72 | 59 | 40.5 | 40.70 | |
| 98 | 100 | 103 | 102 | 100.75 | 64 | 65 | 67 | 61 | 73 | 61 | 39.75 | 39.45 | |
| 101 | 102 | 99 | 98 | 100 | 68 | 64 | 69 | 72 | 78 | 64 | 36 | 36.00 | |
Table 8(b): Hypoglycemic activity of Glimeperide and its chromium complex.
| Fasting sugar estimated in mg/100 ml. of blood of albino rats (Group C) | Least blood sugar values | Fall in blood sugar | % fall in blood sugar | Average % fall in blood sugar | |||||||||
| V day | VI day | VII day | VIII day | Average Values | VIII day after oral administration of Glimeperide complex | ||||||||
| 7.00 am. | 8 am | 10 am | 12 noon | 2 pm | 4 pm | ||||||||
| 94 | 92 | 96 | 92 | 93.5 | 60 | 52 | 48 | 71 | 72 | 48 | 45.5 | 45.66 | |
| 91 | 90 | 91 | 90 | 90.5 | 67 | 50 | 49 | 44 | 74 | 44 | 46.5 | 46.38 | |
| 94 | 93 | 94 | 93 | 93.5 | 68 | 52 | 49 | 72 | 44 | 44 | 49.5 | 48.94 | 47.07 |
| 96 | 90 | 95 | 93 | 93.5 | 67 | 50 | 49 | 44 | 71 | 44 | 49.5 | 48.94 | |
| 96 | 100 | 99 | 98 | 98.25 | 69 | 53 | 47 | 41 | 73 | 41 | 47.25 | 47.27 | |
| 100 | 99 | 96 | 98 | 98.25 | 68 | 52 | 48 | 43 | 71 | 43 | 45.25 | 45.23 | |
On IV day drug was administered orally at 7.05 am.
On VII day complex was administered orally at 7.05 am.
N.B. All readings are represented in whole number.
Taking fresh groups of animals and using the same procedure, hypoglycemic activity of Glibenclamide and Glimeperide (oral antidiabetics) were also studied and compared with their complexes. In case of Glibenclamide fasting blood sugar was recorded after 2, 4, 6, 8 and 10 hrs. The peak time of the effect of these drugs was proved to be about 4 to 6 hrs. and duration of action to be upto 10 to 12 hrs. After the administration of drugs On the days of administration of drugs or its complex the diet was given to the animals after final observation i.e. at 2.0 p.m. to group A animals and 4.0 p.m. to the animals of group B and C (Table 6-8).
As the reported metal complexes of Gliclazide, Glibenclamide and Glimeperide drugs are able to dissociate at stomach pH, therefore its dosages, to be given to subject animals should be such that it should not be dissociate in stomach i.e. at pH 1.2 for this complexes prepared enteric coated to make at the drug bioavailable as it is, i.e. at duodenum and small intestinal pH (5.5 to 6.8 pH)
Drug is coated with a polymer HPMC-5CPS (Hydroxy propylmethyl cellulose) which does not permit drug to dissolve in stomach (i.e. pH 1.2) and such polymer dissolves rapidly at dedenal pH (5 above 5.5) thus drug releases at 5.5 pH and is available for absorption. At this pH complex at stable, non-dissociatable and absorbable. Therefore dosage forms for animals study is prepared as enteric coated, polymerized in this dosage forms are not soluble at pH 12. This drug delivery system is adopted for further study60-67
The hypoglycemic effects of Gliclazide, Glibenclamide and Glimeperide the well known sulphonyl ureas, were inverstigated on the blood sugar levels of male albino rats by using Folin Wu method.68 . Analysis of data presented in table 2,3 and 4 would show that all these drugs caused a marked decrease in blood sugar level to the extent of 33.88%, 33.11% and 33.72% while their complexes reduced the blood sugar level to 43.31%, 43.61% and 47.07% respectively.
This blood sugar lowering effect of sulphonyl ureas seems to be related to the stimulation of insulin secretion on the other hand, many studies have strongly indicated the presence of long term or extra pancreatic action of sulphonyl ureas69. The hypoglycemic activity of sulphonyl ureas may also be attributed to the stimulation of glycolysis and to the inhibition of glycogenesis in the liver by itself or by enhancing insulin action.
Further, on comparing the hypoglycemic effect of complexes of these sulphonyl ureas in relation to time, it becomes evident from tables 2, 3 and 4 that on the whole the maximum fall in blood sugar was observed after 1½. 6.0 and 5.0 hrs. with the administration of Gliclazide, Glibenclamide and Glimeperide complexes respectively. On comparing the hypoglycemic effect of these complxes with their parent drugs, it was revealed that in the three groups Gliclazide-Cr(III), Glibenclamide-Cr(III) and Glimeperide-Cr(III) treated albino rat had lowest blood sugar level being 42 mg/100 ml., 32.5 mg/100 ml. and 45.6 mg/100 ml. respectively on an average. These facts clearly indicate a better hypoglycemic activity of complexes as compared to their parent drugs which is in agreement with the earlier findings of Iqbal and co-worker71. This improved hypoglycemic activity may be related to smaller particle size of metal complexes than drugs as on complexation particle size is reduced which may promote the ratio of absorption of complexes in gastro-intestinal tract.
Results of the present work are also in conformity with the hypoglycemic effect of copper-phenformin complex over parent drug phenformin as mentioned by Piccini et al.,70.
These interesting observations on metal-complexes of oral sulphonylureas used as anti-diabetic agents for lowering blood sugar concentration may likely substantiate the use of these complexes after extensive clinical studies.
References
- Barry Mennen. : Dietry Chromium an overview, executive information Bureau Inc.
- Reaven G.M., : Role of Insulin Resistance Human disease,Diabetes 37,1595 Dec.(1998)
- Kaats G.R.,Blum K.,Fisher J.A.,and Adelman J.A. : Current Therapeutic Res. 57(10);747-765,Oct(1996)
- Pandey R.N.,Rajnish Kumar Singh and Kalpana: Asian J.of Chem.23(6),2739-2741(2011)
- Louise A.,Berben and Jeffery.R.,Lang :Inorg.Chem.J. 44,8459-8468(2005)
- Li F,Wu Y,Zou Y.ZhaoT.,Xhang M.,Feng W,.,Yang L: Food Chem. Toxical 50(5),1623-1631 Epub.Feb-18(2012)
- Yang X,Palanichamy K.,Onto A.C.,Rao M.N.,Fang C.X.,J,and Sreejayan N. : FEBS Lett. Feb, 28,579(6),1458-1464(2012)
- Yashinaga I.,Yammamotto Y. : E ndocrinologie (Gen.), 50,3(1966a)
- Yashinaga I.,Yammamotto Y. :J.Osaka 1,3(1966b)
- Iqbal, S.A., George J.,and Zaafarany. : Jou of Saudi Chem Soc. 14; 345-350 (2010)
- Dury and Al-Jibori. : Orient J. Chem. 28(2), 781-786 (2012)
- Shahriare Ghammamy: Orient J. Chem. 28(2), (2012)
- Modhavadiya V.A. : Orient J. Chem. 28(2), 921-925 (2012).
- Abdul Vudood,, Manish Kumar and Saxena P.N. : Orient J. Chem. 28(2), 1019-1023 (1012)
- Sunil Kumar and Sharma T.R. : Orient J. Chem. 28(2), 963-967 (2012).
- Iqbal.S.A., George J. and Zaafarany, I. : Journal of Saudi Chemical Society,14,345-350(2010)
- Singel,H.(Ed.),Dekker: Metal Ions in Biological SystemsVol-14(1982)
- Brown D.A., : Metal Ions in Biological SystemsVol-14,125,(1982)
- Phipps,D.A. : Metals and Metabolism, Oxford University Press p.63(1976)
- Williams,D.R.: An Introduction to Bioinorganic Chemistry C.C.Thomas,p.32
- Lippard: Platinum,Gold and other metals as chemotherapeutic Agents,American chemical Society(1983)
- Meares,C.F.,Wensel,T.G. : Metal chelates as probes of biological system.Acc.Chem.Res.17, 202-209(1984)
- Irving H,Rossotti H.S. : J.Chem.Soc.3397(1953)
- Irving H,Rossotti H.S. : J.Chem.Soc.2904(1954)
- Irving H,Rossotti H.S. : J.Chem.Soc.1176(1955)
- Willard,H.,Merrit.L.L and Dean J.A. : Instrumental methods of Analytical,5th Ed pearson Education publishers, Singapore,(1975)
- Jeffery,G.H.,Bassett,J.,Mendham,Denney R.C. : Vogels Text book of Quantitative chemical Analysis 5th Ed. Pearson Education Publisher, Singapore, p-473.
- Mohammed,Ashra : Talenta,15,559-562(1989)
- Scott.A., : Standard methods of chemical Analysis. Von Nostrnd,p-634(1960)
- Cullity B.D. : Elements of X-ray diffraction 2nd Ed. Addison Wesley, publishing company, Inc.(1978)
- Bragg,W.L.and Bragg,W.H. : The crystalline state, Chemical Heritage foundation. AgeneralSurvey, vol.1 London (1952)
- Guinier,Andrey: X-ray Crystallographic Technology I. Liger and Watts London (1993)
- Henry N.F.M.,Lipson H. and Wooster W.A. : The Interpretation of X-ray diffraction photographs,Mc Millon London (1951)
- Madhusudhyan P.M,Krishan,K and Ninan K.N. : Thermochem. chem. Acta 97;189(1986)
- Singh S. Kumar, V. Sharma S.K., and Kaumar A. : Orient. J. Chem. 26(1) 93-101 (2010).
- Janabi, A.S., Saumadaiy, G.A., and Jhear-Allah, B.A. : Orient J. Chem. 27(4), 1465-73 (2011)
- Tamani,B.,Yangesh H.and Koohmarch G,A. : Iran.Polym.J. 14(5),785-792(2005)
- Yangesh, H. and Ataei, S.M. : Iran.Polym.J. 14(5),449-455(2005)
- Weisberger A. : Chemical application of spectroscopy,Interscience publishers, NY. (1956)
- Cotton F.A. : Modern co-ordination chem..Interscience pub. Ed. (1960)
- Nakamotto,K: Infra-red spectra of Inorganic and co-ordination compounds, John Willey and son’s NY. (1963)
- Rao,C.N.R. : Chemical Applications of Infra-red spectroscopy,Academic press NY. (1963)
- Bellamy L.J. : The Infra-red spectra of complex molecules.Matheun and co. Ltd. London (1964)
- Dyer J.R. : “Application of Absorption spectroscopy of organic compounds”Prenlice Hall of India Pvt. Ltd (1966)
- Slichter C.P. : Principal of magnetic Resonance, Harper and Row, (1963)
- Akitt J.W. : NMR and chemistry; An Introduction to Nuclear magnetic resonance Spectroscopy Chapman and Hall,(1973)
- B.K.Rai and K.K.Sharma : Orient J.Chem.27(1),143-148,(2011)
- Dikshit, D.D. and Singh, S.B. : Orient J. Chem. 26(1)., 171-74 (2010).
- Pandey, R.N., Nag, A.K., Pande, Prasashti and Singh S.K. : Orient J. Chem. 26(1), 109-12 (2010).
- Cotton F.A., Wilkinson G., Murillo C.A., Bochmann M: Advanced Inorganic chemistry,6th Ed.Wiley,New York, (1999)
- G.Valarmathy.R. Subbalakshmi, R.Selvameena and V.Gomathi:Orient j.Chem.29(1),351-320(2013)
- Balkrishan.,Omprakash and E.H.EL-Mossalamy : Orient J.Chem.29(1),381-388((2013)
- Muvvala Subrahmany Sudhir.,Pavuluri Madan Mohan and Ratnakaram Venkata Nadh: Orient J.Chem.29(1),235-240(2013)
- F.A.Kora.,A.I.EL-Shenaway and M.S.Refat: Orient J.Chem.29(1),205-218(2013).
- A. Shcroft F.W.,Gribble F.M. : Journal of Diabetes and its complications; 14,192-196 (2000), British Journal of Pharmacology,133,193-199(2001)
- Song D.K.,Asharaft F.W. : Pharm.Acta.Helv. 60,110-111(1985)
- Peppas N.A. : Biopharmacuetics and Pharmacokinetics, A treatise 1st New Delhi Vallabh prakash,p-58(1995)
- Brahmankar D.M. and Jaiswal S.B. : S.J.Pharm.Sci .2(2),53-58(2009)
- Muhammed Shahidul Islam,Moniruzzaman, Rukhuzzamann: Biochem.1(43),463(1951)
- Sanger P,and Tuppi F. : J.Org.Chem, 23,927(1958)
- Marshal F.J. Sigal M.V. Idem: 43rd Congress of Medicine and Neurology Montpellier 415 (1942)
- Frank H., and Fuchs J. : Einneues,Antidiabetisches,Prinzip,Dentsch,Med.Wschr
- Maske H. : Deut.Med.Wochschr, 81,823(1956)
- Mc. Lamore W.M.,Fanelli G.M. and Pan S.Y. : Ann.NY,Acad.of sci. 74,443(1959)
- Varshosaz J.,Tabbakhian M.and Zahrooni M. : Journal of Macrocapsulation 24(3),253-262(2007)
- Folin O. and Wu H. : J. Biol.Chem. 41,367(1920)
- Anturlikar S.D.,Chauhan B.L.and Mitra S.K. Indian J.of Physiology and Pharmacology 39, 95-100 (1995)
- Otutu, J.O., Osabohien, E., and Efurhievwe, E.M. Orient J.Chem. 27(4)., 1389-96 (2011).
- Qureshi R.,and Iqbal S.A: Indian J. Appliied and pure Biol. 2(2),65-67(1987)
- Piccinni F.,Murazzi E.,Uberti and Lucatelli I. : Pharmaco(pavia) Ed.sci. 15,521(1960)

