
Manuscript accepted on :
Published online on: 16-12-2015
Plagiarism Check: Yes
Sibi Jose1 and S. A. Iqbal2
1Department of Chemistry, Sadhu Vaswani College, Bairagarh, Bhopal - 462 001, India.
2Department of Chemistry, Crescent College of Technology, Bhopal - 462 038, India.
Abstract
This paper deals with the synthesis and characterization of a glimepiride-neodymium complex, rare earth’s metal. Glimepiride is an oral hypoglycemic agent. The conductometric titrations were conducted using monovariation method which shows the ligand metal ratio as 2:1. Molar conductance value indicate that complex is non-ionic in nature. Analytical results agree to the molecular formula (C24H34N4O5S)2 Nd.4H2O. rare earth’s element Nd shows the high coordination sites. The structure of the complex was assigned as hexagonal in which ligand moleculas joining the central Nd(III) atom with nH2O molecules. Infrared spectral studies have supported coordination of sulphonyl oxygen on one side and enolic oxygen attached from other side and four water molecule attached by four co-ordination sides with the neodymium ion. Mass spectral, thermal and magnetic studies supports structure of the complex proposed on the basis of analytical data X-ray diffraction studies.
Keywords
Synthesis; Characterization; neodymium-Glimepiride complex
Download this article as:| Copy the following to cite this article: Jose S, Iqbal S. A. Synthesis, Characterization and Antidiabetic Study of Nd (III) Complex of 1-(p-(2-(3-ethyl-4-methyl-2-oxo-3-pyrroline-1-carboxamido)Ethyl) Phenyl)Sulfonyl)-3-(trans-4-methyl Cyclohexyl) Urea Amaryl or Glimepiride, An Oral Antidiabetic Drug. Biomed Pharmacol J 2013;6(1) |
| Copy the following to cite this URL: Jose S, Iqbal S. A. Synthesis, Characterization and Antidiabetic Study of Nd (III) Complex of 1-(p-(2-(3-ethyl-4-methyl-2-oxo-3-pyrroline-1-carboxamido)Ethyl) Phenyl)Sulfonyl)-3-(trans-4-methyl Cyclohexyl) Urea Amaryl or Glimepiride, An Oral Antidiabetic Drug. Biomed Pharmacol J 2013;6(1). Available from: http://biomedpharmajournal.org/?p=2640 |
Introduction
The study of chemistry and chemical reaction of co-ordination compound help in establishing structure activities relationship. It has been reported that in biological activity metal complex is more potent and less toxic as compared to the free ligand1-6. Inorganic chemistry and the use of metals in therapeutic drugs have become increasingly important over the last two of decades resulting in a variety of exciting and valuable drugs such as cis-platin for cancer.
Recently metals in medicine has been recognised internationally as an important area for research. In this account the role of rare earth’s metal neodymium has been undertaken for study7-10.
In recent years, much attention is given to the use of sulphonyl ureas because their high complexing nature with essential metals. Sulphonyl ureas are effective for non-insulin dependent diabetes mellitus11-13.
These compounds are completely absorbed on oral administration. They are metabolized by liver and are excreted predominantly through urine. Complexation of sulphonyl ureas with rare earth’s metals have been studied in detail by several workers14-16. A persual of available literatures shows that systemic study on complexation neodyamium with variours hypoglycemic drugs is relatively more important17-19.
Here in the synthesis and characterization of neodymium trioxide complex with glimepiride have been described20-22.
Ligand-metal ratio
For determining the ligand-metal ratio molar solutions were prepared of metal salt and ligand in 1:2 ratio and conductometric titrations were carried out by using monovariation method (Fig II). The ligand-metal ratio (1:2) was also confirmed by the way of doing the jobs method23 of continuous variation as modified by Turner and Anderson24 using Δ conductance as index property. The indexed values were indicates 1:2 metal ligand ratio (Fig III).
Fig (I) Structure of Glimepiride
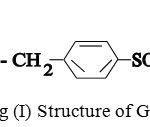 |
Scheme 1: Structure of Glimepiride.
|
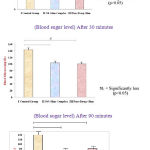 |
Figure 1: Oral Glucose Tolerance
|
Experimental
Pure sample of G.P (trade name, amaryl) with m.f. (C24H34N4O5S) was received from Ipca laboratories Limited, Ratlam. Solvents and metal salts used were fo the analytical grade. Melting point was determined by Parkin Elmer model melting point apparatus and are uncorrected, pH values determined on Lab. India pH analyser. IR spectra of ligand and complex were recorded with Perkin Elemer Spectrometer in the range of 4000-450 cm-1 (CDRI Lucknow). Mass spectral results of ligand and complex were obtained from CDRI Lucknow, India while X-ray diffraction studies were carried out by X-ray diffractometer model with 45kV rotating anode and Cuka (1w=1.54060A) radiation (Panjab University, India). Thermal analysis (DSC) was also varied the proposed structure of complex.
Synthesis
A weighed quantity of glimepiride (2mol.) was dissolved in minimum quatity of 80% DMF. The neodymium trioxide solution was prepared by dissolving it separately in the same solvent. A few drops of alkali NaOH solution was added to metal solution to increase the solubility. Metallic solution was added slowly with stirring into the solution of ligand at room temperature maintaining the pH between 6 to 8 by adding dilute NaOH solution and refluxed for 2-4 hours 25-27 at 800 5C. The solutions were left for crystallization at room temperature for 18-20 hours, shiny grey coloured crystals of complex were obtained which were filtered, washed, dried and then their melting points determined were recorded.
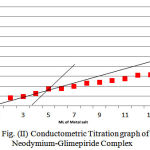 |
Figure 2: Conductometric Titration graph of Neodymium-Glimepiride Complex.
|
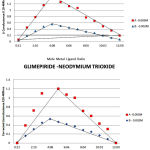 |
Figure 3: Modified by Turner Anderson.
|
Table 1 : Synthesis and physico chemical characteristes of Glimepiride-neodymium Complex
| Ligand/Complex | Ligend Metal Ratio | Colour | %yield | Stability constant Logk (L/mole) | Free energy change (-ΔF) Kcal/mole |
| Glimepiride (Ref) | – | White | – | – | – |
| Glimepiride-neodymium Complex | 2:1 | Shiny Greyish Crystal | 60 | 11.93 | -16.40 |
Analysis of complex
The resulting complex so sormed was characterized by its elemental analysis through SEM-EDAX method and IR, Mass, X-ray, and Thermal studies table. 3, 4, 5 and 6 and metal was estimated by EDTA method.
Table 2 : Analytical data of complex
| Drug/Complex | Elemental analysis found (calculated) | m.p.0C | |||||
| C | H | N | S | Metal | Water | ||
| C24H34N4O5S | 58.77
(58.80) |
6.93
(6.95) |
11.92
(11.94) |
6.53
(6.57) |
– | – | 207 |
| (C24H34N4O5S)2.Nd(OH2)4 | 48.78
(49.61) |
5.78
(9.64) |
8.97
(9.64) |
6.20
(6.13) |
12.01
(12.40) |
5.18
(3.10) |
218 |
Result and Discussion
Structure Determination
IR Absorption Studies
The infrared spectrum of glimepiride and metal complex were recorded on Perkin Elemer Spectrometer RX1 (4000-450cm-1). The major absorption bands for the infrared frequencies and the correspondign assignments are listed in Table 3.
The Glimepiride metal complex showed a prominent IR absorption band in the region 1706cm-1 and 1701cm-1 due to (C=O) carbonyl group28-29. The next IR band of structure significance of the ligand appears at 1215cm-1 which may be assigned to (S=O) which got shifted at 1216cm-1 in the complex. The NH group observed at 3681cm-1 in the ligand (glimepiride) shifted to 36080cm-1 in neodymium glimepiride comlex. The IR frequencies of (C=N) group was appeared at 2363cm-1 in the complex while absent in ligand. The linkage through amide-O and sulphone-O- atom was further supported by the appearance of a band in the far IR region at 670cm-1 in the complex that may be assignable to M-O frequency which was absent in ligand. The IR frequency region at 3403cm-1 was assigned to nH2O molecule that may be not found in ligand frequency region. In pure ligand there is no absorption band detected for C-O and C=N due to enolisation are further supporting the structure for glimepiride neodymium complex.
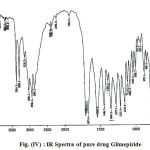 |
Figure 4 : IR Spectra of pure drug Glimepiride.
|
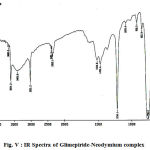 |
Figure 5: IR Spectra of Glimepiride-Neodymium complex.
|
Table 3: IR Absorption data of the complex in cm-1.
| Ligand/Complex | u (NH) | u (C=O) | u (S=O) | u (C-O) | u (C=N) | u (SO2N | u (M-O) | u (H2O) |
| C24H34N4O5S | 3681 | 1706 | 1215 | – | – | – | – | – |
| (C24H34N4O5S)2.Nd.4H2O | 3680 | 1701 | 1216 | 1656 | 2363 | 3021 | 670 | 3403 |
Mass spectral studies
NMR data of the complex get summarized in Table-6 and their proposed structure are given in Fig-IV. the 1HNMR spectra of the ligand was reported on a Bruker DRX-300 spectrometer (CDRI Lucknow) and isolated complex was reported on a Bruker Avance II 400 NMR spectrometer (Saif Panjab University, Chandigarh). DMSO was used as a solvent. The other features of NMR spectrum were the aromatic proton resonances located and the presence of unresolved multiplet is suggestive of excessive deshielding of aromatic protons26-30. The NMR signal of enolic OH group is observed in the ligand while absent in the complex indicates the involvement of enolic OH group in complexation. Moreover the enolization of N1 hydrogen is not possible because it is simultaneously attracted from the groups SO2 from one side and C=O on the other side31.
 |
Figure 6: Mass Spectra of Pure Ligand Glimepiride.
|
 |
Figure 7: Mass Spectra of Glimepiride-Neodymium complex.
|
The mass spectrum of the pure ligand (Fig VI) shows a molecular ion peak m+ at m/z 491 due to (C24H34N4O5S) Parent ion peak30 which is in accordance with the proposed formula of the ligand. The other peak of appreciable intensity has been observed at m/z value 352 correspond to species (C17H16N3O4S) due to loss of (C7H18NO) Fragment radical cation having a molecular mass132 and the mass spectrum of [Nd(C24H34N4O5S)2.(H2O)4] shows a moleclar ion peak m.+ at m/z 1417 which corresponds to molecular weight of complex and also the excess co-ordination nature of the metal ion with supporting ligand31-32. The peaks of appreciable intensity have been observed at m/z values 149, 237, 283, 315, 413, 485, 513, 591, 606, 633, 705, 727, 803, 880, 961, 1093, 1205, 1310, and 1417. The peak observed at m/z 1205 corresponds to exact molecular weight of complex [Nd(C24H34N4O5S)2(H2O)4].
Table 4: Mass Spectral Intensities of Metal Complex of Glimepiride.
| S.No. | Ligand/Metal Complex | Ms (ESI) m/z Values | Assignment |
| 1. | Pure ligand Glimepiride | 491 (m ) (C24H34N4O5S) | molecular ion peak or parention |
| m/z 352 (C17H16N3O4S) | fragmention or major production | ||
| 2. | Glimepiride-Neodymium Complex | m/z 1417 (m ) | molecular ion peak |
| m/z 1205 [Nd(C24H34N4O5S)2(H2O)4] | molecular weight of complex | ||
| m/z 1093 Nd(C24H34N4O5S) | due to loss of co-ordinated water | ||
| m/z 591 (C32H39N4O5S) | base peak |
X-ray diffraction studies
X-ray diffractometer model 00011023505 with 45kV rotating anode X-ray generator was used for scanning the ligand and respective complex. Radiation used was Cu (1w=1.54060A). The samples were scanned in the range 250C. Powder data was indexed using computer software (Panjab University). X-ray diffraction studies also confirm the complexation and formation of new bands.
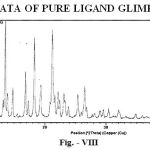 |
Figure 8: Xrd Data Of Pure Ligand Glimepiride
|
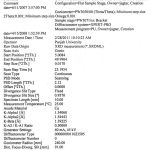 |
Figure A
|
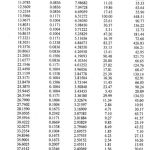 |
Table 1
|
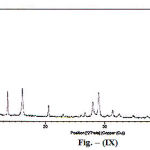 |
Figure 9: Xrd Data Of Glimepiride-Neodymium Complex
|
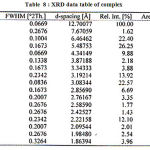 |
Table 2
|
The numbers of peaks in the complex is 17 which indicated that the complex formed is a well knit one33-35. Moreover the complexe lack of periodicity in the diffractrogram of the resultant complex indicates its amorphous nature36.
Particle Size Analysis
Paricle size and Elemental Analysis of Glimepiride Pure by SEM-EDAX Method
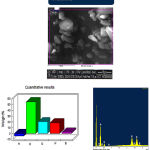 |
Figure 10
|
Paricle size and Elemental Analysis of Glimepiride-Nd Complex by SEM-EDAX Method
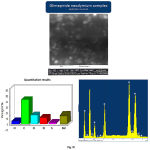 |
Figure 11
|
Table 5 : Particle Size Analysis of Glimepiride-nedymium complex.
| Drug/Complex | Particle size (in microns) mm | Appearance |
| Pure drug (Glimepiride) | 10 | heavy compact crystals |
| Glimepiride neodymium complex | 2 | minute particles |
Thus the particle size analysis shown in Fig X and XI have revealed that the original morphology of pure components disappeared, which supported that the metal complex is more potent and being absorbed more readily than its parent drug37-38.
Antidiabetic activity
The isolated glimepiride-metal complex were found to be more potent as compared to the parent drug. Hence as compare to standard synthetic drug the glimepiride-neodymium39-41 complex is having more hypoglycemic activity. The hypoglycemic effect of glimepiride as well as metal complex were investigated on the blood sugar levels of male wistar rats by Oral glucose tolerance test42. (PBRI, lab. Bhopal). Analysis of data presented in table (6) reveals that the drug caused a marked decrease in blood sugar level. On comparing the hypoglycemic effect of neodymium complex with parent drug it was revealed that incase of Nd- glimepiride treated male wistar rats blood sugar falls to 64.8+ 3.4928 ng/dl while in glimepiride treated rats blood sugar level falls to 90.2 +2.5884 mg/dl. These results clearly indicate a better hypoglycemic activity of Nd-glimepiride complex over its parent drug.43-46
Table 6 : Anti diabetic Activity Analysis by Oral Glucose Tolerance Test
Observation Table Oral Glucose Tolerance Test
| Group | Treatment | Blood Glucose (mg/dL) | ||
| (mg/kg body weight) | Fasting | 30 min. | 90 min. | |
| I | Control group
+ Glucose (2g) + Vehicle |
73.8 2.5884 | 142.8 2.8635 | 120.6 2.4083 |
| II | Neodyamium complex of Glimepiride (2mg) + Glucose + Vehicle | 72.6 2.0736 | 103.8 2.3874* | 84.8 3.4928** |
| III | Pure drug Glimepiride (2mg)
+ Glucose + Vehicle |
74.4 2.8809 | 100.6 2.7018* | 90.2 2.5884** |
References
- Ammar, H.O., Salama, H.A., Ghorab, M., and Mahmoud, A.A., Asian J. Pharm. Sci., 2(2)., 44-55 (2007).
- Massimo, M.B., Clin Ther., , 799-816 (2003).
- Kouichi et al., Res. Clin. Pract., 68., 250-57 (2005).
- Geinsen, K., Drug Res., , 1120-30 (1988).
- Baliar, S., Biswal, S., Sahoo, J., and Murthy, P.N., Inter .J. Pharm. Sci and Nanotech., 2., 1129 (2009).
- Iqbal, S.A., and Qureshi, R., Asian .J. Expt. Sci.,, 68-70 (1985).
- Iqbal, S.A. and Jacob, G., J. Chem., 23(3)., 1123-26 (2007).
- Iqbal, S.A., Jose, S., and Zaafarany, I., J. Chem., 28 (1)., 613-18 (2012).
- Bellamy, L.J., “The infrared spectra of complex molecules”. Methven & Co. Ltd. London (1954).
- Nakamoto, K., “Infra-red spectra of inorganic and co-ordination compound. John Wiley & Sons, Newyork (1963).
- Dyer, J., “Application of Absorption Spectroscopy of Organic Compounds” Prentice Hall of India Pvt. Ltd. Fourth printing., 36 (1978).
- Rao, C.N.R., “Chemical Application of Infrared spectroscopy”. Academic Press, Newyork 258 (1970).
- Chandran, A., Varghese, H.T., Yohannan, C., and Rajendran, G., J. Chem., 27(2)., 611-17 (2011).
- Tawkir, M., Iqbal, S.A. Krishan, B., and Zaafarany, I., J. Chem., 27 (2)., 603-09 (2011).
- Oliveira, G.G.G., Ferraz, H.G., and Matos, J.S.R., Therm. Anal. Colorimetry., 29., 267-70 (2005).
- Khan, M.R., and Sahdev., J. Chem., 27(2)., 649-53 (2011).
- Santhi, S., and Namboori, C.G.R., J. Chem., 27(3)., 1203-08 (2011).
- Verma, M., Llala, N.P., Rawat, R., and Phase, D.M., J. Chem., 27(4)., 1775-78 (2011).
- Cullity, B.D. “Elements of X-ray Diffraction”., Second Edn, Wesley Publishing Company INC., 40 (1978).
- Zaitoon, B.A., Yousef, R., and Musleh, S.M., J. Chem., 27 (4)., 1357-74 (2011).
- Seshadri, N., Suresh, C., Seshaiah, K., and Suresh, M., J. Chem., 27 (4)., 1685-90 (2011).
- Geinier, A., “X-ray diffraction in Crystals, Imperfect Crystals and Amorphous Bodies”., San Francisco (1963).
- Job, P., Clin., 113., 10 (1928).
- Turner, S.E., and Anderson, R.C., Am. Chem. Soc., 912., 71 (1949).
- Pena, K., Garcia-cuello, V.S., Giraldo, L., and Moreno-Pirajan, J.C., J. Chem., 27 (4)., 1293-1301 (2011).
- Mehta, A., Vasanti, S., and Tyagi, R., Current Trends in Biotech and Pharm., 3 (1)., 76-84 (2009).
- Pahovnik, D., Revan, S., Grdadolink, J., and Zagar, E., Pharm. Sci., 100 (11)., 4700-09 (2011).
- Ashraf M., Siddiqui M.A. and Bhatty Talanta M.K., 15, 559 (1989).
- Rai, B.K., Vidyarthi, S.N., Singh, R- and Ojha A., Orient .J. Che., vol 28(3) : 1403-09 (2012).
- Bragg W.L. and Bragg W.H., The Crystalline State, A General Survey, London, Vol. l (1993)
- Jenkins R. and Devries J.L., Worked Examples in X-ray Analysis, New York, Springer Verlag (1970).
- Henry N.F.M., Lipson H. and Wooster W.A., The interpretation of X-ray Diffraction Photographs, Macmillan, London (1951).
- Siewers R.E., Nuclear Magnetic Resonance Shift Reagents, Academic, New York (1973).
- Sharma, K.Y. and Prasad, M., Orient .J. chem., vol 28(3) : 1419-24 (2012).
- S.A., Jose, S. and Zaafarany, I., Orient .J. chem., vol. 28(1) : 613-18 (2012).
- , A.K., Orient .J. chem., 28(1)., 514-45 (2012).s
- Soleymani, R., Salehi, Y.M.., Yousofzad, T., and Cheshmeh Ali, M.K., J. Chem., 28(2)., 627-38 (2012).
- Obeidat, S.M., and Tayyem, B. AL., J. Chem., 28(2)., 795-801 (2012).
- Rehman, F., and Mairaj, S., J. Chem., 28(2)., 881-85 (2012).
- Mary, Y.S., Panicker, C.Y. and Varghese, H.T., J. Chem., 28(2)., 937-41 (2012).
- Mdhavadiya, V.A., J. Chem., 28(2)., 921-25 (2012).
- Saxena, A., J. Chem., 28(2)., 1067-1070 (2012).
- Vardhan, V., and Sharma., T.R., J. Chem., 28(2)., 1077-80 (2012).
- Kakadiya, J., Shah, M., and Shah, N., J. Applied Bio. And Pharm. Tech., 1(2)., 276 (2010).
- Jha, V.K., Chem., 23(7)., 3285-86 (2011).
- Sumana, G., and Suryawanshi, S.A., J. Experi Biology., 39., 748-58 (2001).
- Rasheed, K., Tariq, M.I., Munir, C., Hussain, I., and Siddiqui, H.L., Chemical & Pharmaceutical Bulletin., 56(2)., 168 (2008).

