
Manuscript accepted on :June 25, 2010
Published online on: 21-11-2015
Plagiarism Check: Yes
Madhav V. Upadhye and Ujwala Jadhav
Department of Life Sciences, University of Mumbai, Santacruz (E), Mumbai - 400 098 India.
Abstract
Bivalve Parreysia corrugata is an important component of freshwater ecosystem of Indian sub-continent. In the present study an attempt was made to evaluate the genetic diversity of P. corrugata populations using RAPD markers.
Keywords
Genetic diversity; Parreysia corrugata; RAPD-PCR; Freshwater bivalve
Download this article as:| Copy the following to cite this article: Upadhye M. V, Jadhav U. Evaluation of Genetic Diversity of Pearly Mussel, Parreysia Corrugata by Randomly Amplified Polymorphic DNA (RAPD). Biomed Pharmacol J 2010;3(1) |
| Copy the following to cite this URL: Upadhye M. V, Jadhav U. Evaluation of Genetic Diversity of Pearly Mussel, Parreysia Corrugata by Randomly Amplified Polymorphic DNA (RAPD). Biomed Pharmacol J 2010;3(1). Available from: http://biomedpharmajournal.org/?p=1251 |
Introduction
Freshwater bivalve Parreysia corrugata is reported to be widely distributed in the states like Punjab, Bihar, Madhya Pradesh, Maharashtra, Orissa, and Karnataka1. Recently it has been found to be a potential candidate species for freshwater pearl production 2. Further Parreysia spp. is known to have medicinal importance 3.
Evaluation of the genetic diversity of populations of P. corrugata is important to assess the health of this species. If low genetic diversity is found, measures can be put into place to protect and potentially help these endangered populations recover their genetic diversity. This will increase the long term chances of survival for this important species.
RAPD analysis based on the PCR amplification of discrete regions of genome with short oligonucleotide primers of arbitrary sequence has been used to evaluate genetic diversity for species, subspecies and stock identification in a number of aquatic organisms. In spite of importance of P. corrugata, there are absolutely no reports available on the use of these markers for studying genetic variation in P. corrugata. Therefore, an attempt has been made to evaluate the use of RAPD markers to analyze genetic diversity of P. corrugata collected from five different locations within the state of Maharashtra.
Materials and Methods
corrugata were hand collected from five distantly located districts in Maharashtra viz. Thane, Ahmednagar, Ratnagiri, Aurangabad and Nanded, brought alive to Aquaculture laboratory of Department of Life Sciences and acclimatized for 24 hrs in separate glass aquaria. After acclimatization, 10-15 live mussels were sacrificed and different body parts were carefully dissected and separated for isolation of genomic DNA.
Isolation of Genomic DNA
Genomic DNA was isolated from fresh mantle tissue (approximately 100 mg) by grounding in 2 ml of extraction buffer and after repeated centrifugation and treatment with suspension buffer, SDS, proteinase K, ammonium acetate, chloroform – isoamyl alcohol (24:1) and absolute ethanol. The pellet was dissolved in 200 μl elution buffer and store at 4°C. The agarose gel electrophoresis (0.8%) was carried out to check the presence of DNA. Purity and concentration of DNA was estimated by calculating the ratio of the optical density measured at 260 and 280 nm with a spectrophotometer.
Table 1: RAPD analysis of P. corrugata
| Primer Name | Sample | Total Scorable Bands | Molecular weight range | Total Polymorphic bands |
| OPA-01 | Thane | 0 | 1 | |
| Aurangabad | 1 | 1900 | ||
| Nanded | 0 | |||
| Ratnagiri | 0 | |||
| Ahmednagar | 0 | |||
| OPA-09 | Thane | 1 | 650 | 11 |
| Aurangabad | 3 | 400-1700 | ||
| Nanded | 4 | 300-800 | ||
| Ratnagiri | 0 | |||
| Ahmednagar | 3 | 320-650 | ||
| OPA-13 | Thane | 3 | 550-750 | 11 |
| Aurangabad | 3 | 800-1100 | ||
| Nanded | 1 | 750 | ||
| Ratnagiri | 0 | |||
| Ahmednagar | 4 | 350-720 | ||
| OPB-01 | Thane | 0 | 2 | |
| Aurangabad | 2 | 600-950 | ||
| Nanded | 0 | |||
| Ratnagiri | 0 | |||
| Ahmednagar | 0 | |||
| OPD-02 | Thane | 0 | 10 | |
| Aurangabad | 3 | 500-1300 | ||
| Nanded | 3 | 480-1000 | ||
| Ratnagiri | 2 | 450-550 | ||
| Ahmednagar | 2 | 450-550 | ||
| OPD-08 | Thane | 2 | 500-1300 | 9 |
| Aurangabad | 4 | 500-1700 | ||
| Nanded | 1 | 500 | ||
| Ratnagiri | 0 | |||
| Ahmednagar | 2 | 500-650 | ||
| OPD-20 | Thane | 3 | 450-1000 | 13 |
| Aurangabad | 3 | 750-1200 | ||
| Nanded | 2 | 200-300 | ||
| Ratnagiri | 2 | 450-650 | ||
| Ahmednagar | 3 | 450-1000 |
RAPD analysis
The isolated genomic DNA was subjected to PCR amplification with 12 random 10-mer primers (Operon Technologies, California). Amplification of genomic DNA was carried out in 50 μl reaction mixture containing 1μl genomic DNA as template, 25μl PCR master mix, 2 μl primer and 22 μl of nuclease free water. DNA amplification was performed in a DNA thermal cycler (Biometra, Germany) with standardized PCR conditions. Amplified PCR products were analyzed using electrophoresis in 1.4% agarose gel. DNA markers (Fermentas) of different sizes were also run along side the PCR products. The gel was stained in solution containing 5 μl of ethidium bromide and observed under UV transilluminator for DNA bands. Photographs of the gel were taken.
Table 2: Percentage of polymorphic loci of five populations of P. corrugata
| Population | Percentage of Polymorphic loci |
| Thane | 57.14 % |
| Aurangabad | 100.0 % |
| Nanded | 71.43 % |
| Ratnagiri | 28.57 % |
| Ahmednagar | 71.43 % |
Statistical Analysis of RAPD profile
The RAPD markers were scored visually on the basis of their presence (1) or absence (0), separately for each individual and primer. The scores obtained from all the seven primers were then pooled together for constructing a single data matrix. The data obtained for all the five populations of P. corrugata was statistically analyzed using POPGENE version 1.32 software 4 under the assumption of Hardy-Weinberg equilibrium.
Table 3: A summary of coefficient of genetic variability
| Populations | Observed number of alleles na subscript | Effective number of alleles ne | h = Nei’s gene diversity | Shannon’s information Index (I) |
| Thane | 1.5714 | 1.0512 | 0.0464 | 0.0989 |
| Aurangabad | 2.0000 | 1.1158 | 0.1025 | 0.2077 |
| Nanded | 1.7143 | 1.0630 | 0.0566 | 0.1196 |
| Ratnagiri | 1.2857 | 1.0224 | 0.0208 | 0.0459 |
| Ahmednagar | 1.7143 | 1.0806 | 0.0719 | 0.1473 |
| Mean | 2.0000 | 1.0657 | 0.0606 | 0.1339 |
Results and Discussion
Molecular genetic information has been increasingly used to detect the population genetic structure and genetic diversity among morphologically similar populations of a same species. Of the many molecular approaches available today, RAPD-PCR was chosen for this study as it is simple and rapid method for determination of genetic variability in various organisms without prior knowledge of the genome under study.
Table 4: Analysis of gene diversity in subdivided populations
| Primer / Locus | Ht | Hs | Gst | Nm |
| OPA-01 | 0.0074
|
0.0073 | 0.0150 | 32.8096 |
| OPA-09 | 0.0878 | 0.0858 | 0.0224 | 21.8227 |
| OPA-13 | 0.0805 | 0.0789 | 0.0199 | 24.6819 |
| OPB-01 | 0.0150 | 0.0145 | 0.0304 | 15.9315 |
| OPD-02 | 0.0731 | 0.0722 | 0.0119 | 41.3832 |
| OPD-08 | 0.0661 | 0.0648 | 0.0198 | 24.7805 |
| OPD-20 | 0.0939 | 0.0938 | 0.0019 | 258.4096 |
| Mean | 0.0606 | 0.0596 | 0.0153 | 32.1347 |
RAPD analysis clearly indicated polymorphism in the wild study populations of bivalve, P. corrugata collected from five different geographical regions of Maharashtra. Out of the twelve primers tried out for PCR, seven primers viz. OPA- 01, OPA-09, OPA-13, OPB-01, OPD-02, OPD-08 and OPD-20 showed amplification product and DNA fingerprint for DNA samples from at least a single location. Remaining five primers i.e. OPB-02, OPB-08, OPB-16, UBC456 and UBC457 however, failed to produce any amplification. Primer OPD-20 produced maximum number of polymorphic bands i.e. 13 whereas OPA-01 produced a single polymorphic band (Table 1). Primer OPA-09 and OPA-13 both gave rise to 13 polymorphic bands followed by primer OPD-02 and OPD-08 with 10 and 9 polymorphic bands respectively. Primer OPB-01 produced only couple of polymorphic bands. Thane sample showed a total of 9 polymorphic bands, whereas Aurangabad, Nanded, Ratnagiri and Ahmednagar samples produced a total of 19, 11, 4 and 14 polymorphic bands respectively. Total number of polymorphic bands produced by the 7 RAPD primers for P. corrugata from five different locations was 57.
Table 5: Genetic identity and Genetic distance between the five populations of P. corrugata
| Population | Thane | Aurangabad | Nanded | Ratnagiri | Ahmednagar |
| Thane | ***** | 0.9989 | 0.9987 | 0.9991 | 0.9996 |
| Aurangabad | 0.0011 | ***** | 0.9992 | 0.9983 | 0.9994 |
| Nanded | 0.0013 | 0.0008 | ***** | 0.9991 | 0.9993 |
| Ratnagiri | 0.0009 | 0.0017 | 0.0009 | ***** | |
| Ahmednagar | 0.0004 | 0.0006 | 0.0007 | 0.0013 | ***** |
Nei’s genetic identity (above diagonal) and genetic distance (below diagonal).
Statistical analysis of RAPD profile
Polymorphism in different populations
The maximum polymorphic loci were found in Aurangabad population (100%) and minimum (28.57%) in Ratnagiri population indicating polymorphism in each of the five populations of P. corrugata (Table 2).
Gene diversity index (h)
The overall genetic diversity ranged from 0.0208 (Ratnagiri) to 0.1025 (Aurangabad) with a mean of 0.0606 (Table 3).
Shannon’s Informative index (I)
The informative index ranged from 0.0459 to 0.2077 in all the individuals of the five populations (Table 3). Average value was 0.1339. This mean index value clearly indicates diversity between and within the populations proving that the genetic diversity has been retained in P. corrugata. This is in agreement with results observed in freshwater mussels 5 and marine bivalves 6, 7 suggesting that the wild populations of aquatic invertebrates maintain the genetic diversity.
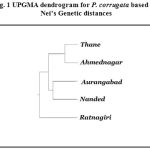 |
Figure 1: UPGMA dendrogram for P. corrugata based on Nei’s Genetic distances |
Coefficient of genetic differentiation
To assess genetic differences among the populations and the level of population differentiation, the index of inter population differentiation (Gst) was calculated. The value of Gst normally varies from 0 to 1 8. Gst varied from 0.0001 to 0.1886. Mean Gst between populations was found to be 0.0153 (Table 4) which shows that genetic differentiation is moderate suggesting that all the populations under study are not completely isolated. The number of migrants among local populations (Nm), total genetic diversity (Ht) and the mean sample genetic diversity (Hs) were also computed. Hs and Ht was 0.0596 and 0.0606 respectively. Gene flow plays a critical role in differentiation among populations. When Nm is greater than 1, gene flow can resist genetic drift in the population and prevent differentiation among them 9. Mean Nm value was 32.1347 indicating that the gene flow of these populations has resisted genetic drift.
Dendrogram based on Nei’s (1972) Genetic distances10
The genetic distance values ranged from 0.0004 to 0.0013 among the five populations (Table 5). Low genetic distances confirmed that all the populations belong to same species. A UPGMA dendrogram based on Nei’s genetic distance 10 indicated the segregation of these populations into distinct clusters according to geography (Fig. 1). The dendrogram linked Thane and Ahmednagar populations separated from Aurangabad and Nanded populations with Ratnagiri population as an out group.
Overall, the RAPD technique showed genetic variation in wild populations of P. corrugata. The present study may serve as a reference point for future examinations of the genetic variation within populations of this important freshwater pearly mussel. Furthermore, it can be used as a model for other studies relating to genetic diversity.
References
- Subba Rao N. V. Handbook of Freshwater Mollusc of India. Zoological Survey of India, Calcutta, India, pp. 1-194 (1989).
- Janakiram, K. and Misra G. Current Science, 85, 727-729 (2003).
- Dey A. Records of the Zoological Survey of India, Kolkata, Occasional paper 289, 1-54 (2008).
- Yeh F. C., Yang R-C., Boyle T. B.J., Ye Z-H. and Mao J. X. POPGENE version 1.32, the user-friendly shareware for population genetic analysis.University of Alberta, Canada (1999).
- Van der Bank F. H. and van der Bank M. Animal Genetics, 26, 31-35 (1995).
- Aranishi F. and Okimoto T. Appl. Genet., 45(4), 435-443 (2004).
- Baozhong L., Bo D., Jianhai X. and Zaizhao W. Chinese Journal of Oceanology and Limnology, 24(3), 295-299 (2006).
- Lowe A., Harris S. and Ashton P. (2004). Ecological genetics: design, analysis, and application. Blackwell Publishing, USA, pp. 1-326 (2004).
- Slatkin Ann. Rev. Ecol. Syst., 16, 393-430 (1985).
- Nei M. Naturalist., 106, 283-292 (1972).

