
Manuscript accepted on :Decemebr 04, 2009
Published online on: 16-11-2015
Plagiarism Check: Yes
M. S. Mohamed Jaabir¹*, JF. Rosario², S. Senthil kumar¹ and P. Geraldine³
1Department of Biotechnology, Jamal Mohamed College (Autonomous), Tiruchirappalli - 620 020 Idnia.
²Department of Obstetrics and Gynecology, University of Texas, Health Science Center, San Antonio, Texas-78229-3900 Mexico.
³Department of Animal Science, Bharathidasan University, Tiruchirappalli - 620 024 India.
Abstract
To assess the effect of maternal dietary micronutrient restriction during preconception, conception and postnatal days on insulin resistance, fat metabolism and systolic blood pressure in offspring. Female weanling mice received a control or a 50% micronutrient restricted (MR) diet and mated with control males. Pups born to the dams on the restricted diet were weaned on to the restricted diet till postnatal day (PD) 360. At birth, pups from deficient dams had reduced birth weight and crown rump length. Increased fasting glucose, insulin, total cholesterol and triglycerides levels were observed in the offspring of MR group. At PD-120, MR restricted offspring had an elevated systolic blood pressure than controls. Compared with controls, total body electrical conductivity measurements indicated significantly higher body fat percentage, lower lean body mass and fat-free mass in MR offspring besides elevated plasma triacylglycerols. Maternal micronutrition restriction per se resulted in an increased body fat and in plasma triglycerides, free fatty acids and total cholesterol concentrations in the offspring. These changes seem to predispose the offspring to insulin resistance and hypertension in later life.
Keywords
Micronutrient restriction; Insulin Resistance; Hypertension; TOBEC
Download this article as:| Copy the following to cite this article: Jaabir M. S. M, Rosario JF, S. Senthil kumar S, Geraldine P. Maternal Dietary Micronutrient Restriction During Preconception, Conception and Postnatal Life Predispose the Offspring to Insulin Resistance and Hypertension in Adult Life. Biomed Pharmacol J 2009;2(2) |
| Copy the following to cite this URL: Jaabir M. S. M, Rosario JF, S. Senthil kumar S, Geraldine P. Maternal Dietary Micronutrient Restriction During Preconception, Conception and Postnatal Life Predispose the Offspring to Insulin Resistance and Hypertension in Adult Life. Biomed Pharmacol J 2009;2(2).Available from: http://biomedpharmajournal.org/?p=755 |
Introduction
Many studies have demonstrated a link between fetal nutrition, low birth weight and coronary heart disease, hypertension and impaired glucose tolerance in adults1. The mechanism(s) by which these nutritional insults exert their effects remains unclear. To this end several animal models have been established using global caloric restriction2 or alteration in a specific dietary component and include protein3 fat4 and minerals such as calcium5 and iron (Fe)6,7. While protein restriction is of great significance in underdeveloped countries, and increased fat intake is a westernized problem, it is the micronutrient deficiency model that is applicable to the etiology of insulin resistance and hypertension of both developed and developing countries. Multiple vitamin deficiencies, particularly during pregnancy and/or postnatal days, are common in the developing world and maternal vitamin and mineral deficiencies are associated with low birth weights and increased rates of perinatal mortality and morbidity8. In view of the literature cited above, we hypothesized that maternal dietary micronutrient restriction during preconception, conception and postnatal days linked to increased oxidative stress and hyperlipidemia, body fat percentage per se predispose the offspring to insulin resistance and hypertension in later life.
Material and Methods
All animal experimental procedures were carried out with the approval from the ethical committee of the Department of Animal sciences, Bharathidasan University, Tiruchirappalli, Tamil Nadu, India.
Feeding and maintenance of the experimental mice
Female weanling Swiss albino mice were housed individually in polypropylene cages with wire mesh bottoms and maintained at 22 ± 2 °C, under standard lighting conditions (12-h light: dark cycle). For 12 weeks, the group of six mice was fed a basal diet (AIN-93G- composition of diet and vitamin mixture)9, with 50% restriction of vitamin and mineral mixture (MR). The other group of 6 mice served as the control. All the animals were provided deionised water. At the end of 12 weeks of feeding, blood was collected from supra orbital sinus to determine the vitamins A, E and folic acid, and minerals such as iron, zinc, copper, magnesium, selenium and calcium in plasma; in addition to the following biochemical parameters: haemoglobin, glucose, insulin, cholesterol and triacylglycerol. After assessment of their vitamin and minerals status, the female mice were naturally mated with proven fertile control male over night and vaginal plugs were identified on the following morning and maintained on their respective diets throughout gestation.
Litter management
At term, pups born to the dams on the MR, as well as control group were weaned on the same restricted or control diet respectively. At birth, the body / placenta weight, crown rump length of neonates and gestational length of dams were recorded. In all groups, a uniform litter size of 8 pups/dam (equal number of male and females) was maintained from PD 3, until weaning on PD 21 and litters were weighed weekly from birth. Offspring born to the dams of control and MR were weaned onto the respective control and micro nutrient restricted diets. From weaning, 8 male pups from 4–5 dams of the corresponding group were maintained in each group and they consumed their respective diets and deionized water ad libitum until PD 360. To avoid the possible effects of estrous cycle on glucose and fat metabolism and insulin resistance, only male pups were included in this study. Daily diet intake and weekly body weights were recorded in mothers and offspring.
Measurements in plasma
Blood collected from offspring on PD 30, 60, 90, 180 and 360 were utilized for the measurements of biochemical parameters such as Vitamins A, E, folic acids, iron, calcium were measured in maternal plasma by using commercially available kits from Sigma, St. Louis, USA. Zinc, copper, magnesium concentrations were determined using flame atomic absorption spectrophotometer (Perkin-Elmer model 460, Norwalk, CT), as described previously10,11. Selenium concentrations were determined by flameless atomic absorption spectroscopy after a sampling dilution procedure, with a Perkin-Elmer model 5100 fitted with a HGA 600 graphite furnace12. Plasma glucose and high density lipoprotein (HDL) cholesterol, free fatty acids, serum triglycerides (TG), total cholesterol (TC) levels were measured by using the using commercially available kits from Ranbaxy, India. LDL-cholesterol and VLDL cholesterol were calculated by using Friedewald formula13. Plasma insulin was measured using a radioimmunoassay kit from BRIT, Mumbai, India.
Oral Glucose Tolerance Test (OGTT)
An oral glucose-tolerance test (OGTT) was performed in the offspring on PD 90, 180 and 360. After an overnight fast, glucose (300 gm/l) was administered orogastrically at a dose of 2.5 g/kg body weight and blood samples were obtained from the orbital sinus at 0, 60 and 120 min for determination of plasma glucose and insulin concentrations.
Oxidative stress and antioxidant status
On PD 360, the animals were killed by decapitation. The livers were dissected out immediately, washed thoroughly with ice-cold 0.9% NaCl, frozen in liquid nitrogen and stored at -80 °C until the analysis. About 1 g liver (from the biggest lobe) was weighed out, minced and homogenized (10% w/v) in 50 mmol/l phosphate buffer (pH 7.0). The homogenate was centrifuged at 1000 g for 20 min at 4 °C. A part of the supernatant was used to estimate lipid peroxidation and protein carbonyls. The remaining supernatant was further centrifuged at 12,000 g for 20 min at 4° C to obtain the post mitochondrial supernatant. This was used to estimate reduced glutathione (GSH) and activities of the following antioxidant enzymes such as catalase (CAT), superoxide dismutase (SOD) and glutathione peroxidase (GPx).
Fasting blood samples were collected on PD 360 from all the MR and control group animals, for the measurement of lipid peroxide and total glutathione. Lipid peroxidation was measured by
the thiobarbituric acid color reaction for malondialdehyde (MDA)14. Protein carbonyl content was measured spectrophotometrically using 2,4-dinitro-phenyl-hydrazine15. Total GSH (GSH + GSSG) was determined enzymatically in the acidic protein-free supernatant16. The assay of oxidized glutathione (GSSG) was performed after masking–reduced glutathione (GSH) by adding 2-vinylpyridine to the deproteinized extract. After this procedure, GSSG was also enzymatically determined. Catalase was assayed by monitoring the disappearance of H2O2 at 240 nm17. A coupled enzyme procedure, with cumene H2O2 as a substrate, was used to determine total GSH-Px activity18. The protein content was determined using the modified Lowry method19.
Blood pressure measurements
Systolic blood pressure was determined at 120, 180, 260 and 360 days of age in both control and MR group by tail cuff plethysmography using an IITC model-229 blood pressure monitor (Linton Instruments, UK). After 1-hour acclimatization, recordings were made “blind” (mean of four per mice) by coding animals and if heart rate exceeded 480 beats/minute (indicative of stress), results were discarded.
Body composition of the offspring
Total body composition of the offspring was determined at PD 180 and 360 using a Total Body Electrical Conductivity (TOBEC) – small animal body composition analysis system (EM-SCAN, Model SA-3000 multi detector, Springfield, IL, USA)20.
Statistical analysis
Data are expressed as means ± SE. Statistical analyses were performed using paired Students’t-test or one way ANOVA followed by Bonferroni analysis where ever appropriate. Statistical significance was determined at the 0.05 level.
Results
Parameters in mothers
Maternal growth, mineral, vitamin status, lipid profile and glucose homeostasis.
At the end of 12 weeks of feeding there was no significant difference in the daily food intake and body weight gain between the control and MR groups. However, hemoglobin concentration was significantly decreased (P < 0.001) in MR animals than in control. In addition, food intake was not significantly different between the MR and control group throughout growth, pregnancy and lactation. There was, however, a significant decrease in the plasma concentration of copper (P<0.001), zinc (P<0.001), iron (P<0.001), magnesium (P<0.001), calcium (P<0.01), Selenium (P<0.001), vitamin-E (P<0.001), vitamin-A (P<0.05) and folic acid (P<0.001) in MR animals compared with controls after 12 weeks of feeding (Table 1). There were no significant differences between the concentrations of fasting glucose and HOMA index in control and MR group. However there was a slight increase in fasting plasma insulin level in MR group as compared with control. There were no statistical differences in plasma total cholesterol levels; however there was a significant increase in the plasma triglyceride levels in MR mice compared with control.
Maternal dietary micronutrient restriction impairs fetal growth, litter size and placental weight
Feeding of restricted micronutrient during preconception and conception periods resulted in fetal intrauterine growth retardation (Fig. 1A and 1B). Mean birth weight (P <0.001) and crown rump length (P <0.001) were significantly lower in the MR group than in control. Placental weight was decreased by 26 % (P <0.001) in MR group as compared with control (Table-2). However there was no difference in gestational length between two groups.
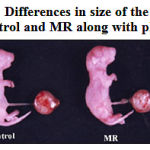 |
Figure 1a: Differences in size of the neonate of Control and MR along with placenta.
|
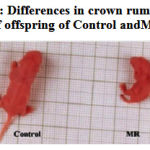 |
Figure 1b: Differences in crown rump length of offspring of Control and MR.
|
Parameters in offspring
Growth characteristics of the offspring
The offspring of the MR dams which had a lower birth weight (P<0.05) continued to weigh less until PD 360 (Fig. 2).
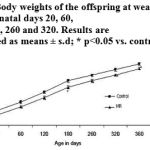 |
Figure 2: Body weights of the offspring at weaning and on post-natal days 20, 60,120, 180, 260 and 320. Results are presented as means ± s.d; * p<0.05 vs. control.
|
Micronutrient status in offspring
Chronic micronutrient dietary restriction continuation during postnatal days significantly decreased the plasma concentration of Cu, Zn, Fe, Mg, Se, Ca, folic acid and Vit E, A in MR group on PD 30, 60, 90, 180 and 360, (p<0.001) obviously indicating the sub normal supplementation through the diet .
Glucose Homeostasis
There were no significant differences among control and MR groups in fasting plasma glucose and insulin levels till PD 90. On PD 180 and 360, the MR group had significantly higher fasting glucose (p<0.01) and insulin levels than controls (Table 3). Similarly, oral GTT results also indicated significant changes on PD180 (p<0.001) and 360 (p<0.001) confirming the onset of Insulin resistance in later life (Table 4, 5).
Lipid Profile and oxidative stress
Levels of total cholesterol, HDL and triglycerides were significantly higher on PD 180 and 360 (p<0.001) in the MR group than the control indicating impairment in the lipid metabolism
(Table 6). Chronic maternal micronutrient restriction resulted in a significant increase in lipid peroxides (TBARS) and a decrease in GSH (P< 0.001) levels in both plasma and liver. Compared with the control group, blood GSSG (P< 0.001) and GSSG/GSH ratio (P< 0.001) were also significantly higher in the MR group. Protein carbonyl levels in the liver was also significantly elevated than in control group. Hepatic and plasma SOD, Catalase and GPx activities were significantly higher in micronutrient restricted offspring than in control (P<0.001) (Table 7 and 8).
Body composition
Compared with control group, body fat percent (p<0.001) and adiposity index was significantly higher (p<0.001) in offspring of MR group on PD 180 and 360. Other markers of adiposity like lean body mass and fat-free mass were significantly lower (P<0.001) on PD 180 and 360 (Table-9).
Hypertension
Systolic blood pressure in offspring of MR group was significantly elevated (P<0.001) on PD 120, 180, 260 and 360 than the control indicating hypertension (Fig. 3).
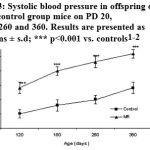 |
Figure 3: Systolic blood pressure in offspring of MR and control group mice on PD 20, 180, 260 and 360. Results are presented as means ± s.d; *** p<0.001 vs. controls1-2.
|
1 Number of observations in each group (n=8)
2Control, control diet throughout; MR, mineral and vitamin restriction diet throughout
Discussion
The effect of micronutrient restriction during preconception, conception and postnatal days appears to predispose the offspring to insulin resistance and hypertension in later life. Chronic maternal dietary micronutrient restriction affected the birth and placental weights of the offspring. Interestingly, decrease in the bodyweight was continued at weaning and thereafter, in micronutrient restricted group. Our data support the few previous experimental21,22 and epidemiological23 studies that showed, prenatal under nutrition can affect body weight in adulthood. In our experiment, maternal micronutrition restriction reduced the placental weight, which might be a causative factor responsible for the reduced birth weight in micronutrient restricted group by modulating placental nutrient transfer and metabolism. Chronic maternal micronutrient restriction and its postnatal continuation in the offspring had no discernable effect on their fasting plasma glucose and insulin levels or oral glucose tolerance until PD 180. However, elevated fasting glucose, insulin and impaired GTT were observed from PD-180 onwards. These observations are comparable with the previous reports on maternal protein and calorie malnutrition24, which showed that maternal protein or caloric restriction affected glucose tolerance in the offspring in experimental rat model. Beside insulin resistance, maternal micronutrient restriction increased the systolic blood pressure from PD120. These observations are in agreement with Woodall and coworkers25, who showed that maternal undernutrition or iron restriction in rats elevated blood pressure in adult life.
Micronutrient restriction moderately increases the circulating total, LDL, VLDL cholesterol and triglycerides levels. The increased triglyceride levels in MR could also be linked to the high formation of glycerol-3-phosphate leading to an increased synthesis of VLDL by liver. However, HDL cholesterol levels were moderately decreased in MR group. This finding support the hypothesis, based on epidemiological studies in humans, that restricted growth before birth can have long-term deleterious effects on cholesterol homeostasis26.
The finding in our study that both Lean Body Mass (which includes tissue-associated fat) and Fat Free Mass showed a significant decrease in MR compared with control appears to suggest that tissue-associated fat may be decreased in MR mice, whereas visible fat percent increased. These changes in body fat % are in agreement with those found by Lucas et al.27. The high body fat% along with low body weight in the MR offspring observed here appear to be similar to those reported in the “thin-fat” neonatal phenotype28 seen in developing countries such as India, an abnormal condition attributed to maternal malnutrition29.
There are reports that lipid abnormalities and insulin resistance are associated with an abnormal antioxidant defense and increased oxidative stress30. It has also been suggested that oxidative stress plays a role in the development of insulin resistance31. In line with these reports, we observed an increase in oxidative stress and decreased antioxidant status in micronutrient restricted mice compared with control.
Zinc is a biological antioxidant32, and its depletion can lead to oxidative stress33 and reduced insulin sensitivity34. In particular, this metal is associated with the apoprotein of superoxide dismutase; thus its depletion could alter the protein as previously shown35. Thus, micronutrient restricted mice had increased oxidative stress. The increased catalase activity in MR is an indicator of increased production of peroxide radicals. This probably corroborates the importance of non-enzymatic antioxidants (especially vitamins and trace elements) as the primary line of defense against oxidative stress suggesting that maternal micronutrient restriction modulates/programs antioxidant enzymes in the offspring to cope with the increased oxidative stress36. It appears that the increased oxidative stress observed in maternal and/or post-natal micronutrient restriction could be involved in the changes in adiposity and/or lipid metabolism, the well-recognized forerunners of insulin resistance and hypertension.
References
- Barker, D.J., Gluckman, P.D., Godfrey, K.M., Harding, J.E., Owens, J.A. and Robinson, J.S. “Fetal nutrition and cardiovascular disease in adult life.” Lancet 341: 938-941 (1993).
- Ravelli, A.C., Van der Meulen, J.H., Michels, R.P., Osmond, C. and Barker, D.J. “Glucose tolerance in adults after prenatal exposure to famine.” Lancet 351: 173-177 (1998).
- Woodall, S.M., Johnston, B.M., Breier, B.H. and Gluckman, P.D. “Chronic maternal undernutrition in the rat leads to delayed postnatal growth and elevated blood pressure of offspring.” Pediatr Res 40: 438-443 (1996).
- Langley Evans, S.C. and Jackson, A.A. “Increased systolic blood pressure in adult rats induced by fetal exposure to maternal low protein diets.” Clin Sci 86: 217-222 (1994).
- Koukkou, E., Ghosh, P., Lowy, C. and Poston, L. “Offspring of normal and diabetic rats fed saturated fat in pregnancy demonstrate vascular dysfunction.” Circulation 98: 2899-2904 (1998).
- Bergel, E. and Belizan, J. “A deficient maternal calcium intake during pregnancy increases blood pressure of the offspring in adult results.” Br J Obst Gynaecol 109:
540-545 (2002). - Crowe, C., Dandekar, P., Fox, M., Dhingra, K., Bennet, L. and Hanson, M.A. “The effects of anaemia on heart, placenta and body weight, and blood pressure in fetal and neonatal rats.” J Physiol 488: 515-519 (1995).
- Lewis, R.M., Petry, C.J., Ozanne, S.E. and Hales, C.N. “Effects of maternal iron restriction in the rat on blood pressure, glucose tolerance, and serum lipids in the 3-month-old offspring.” Metabolism 50:
562-567 (2001). - Black, R.E. “Micronutrients in pregnancy.” Br J Nutr 85: S193-S197 (2001).
- Reeves, P.G. “Components of the AIN–93 Diets as improvements in the AIN–76A Diet.” J Nutr 127: 838S-841S (1997).
- Arnaud, J., Bellanger, J., Bienvenu, P., Chappuis, P. and Favier, A. “Recommended method for assaying zinc with flame atomic absorption.” Ann. Biol. Clin. 44: 77-87 (1984).
- Arnaud, J., Bellanger, J., Bienvenu, P., Chappuis, P., Favier, A. and Galliot, M. “Recommendations for the assay of serum copper by flame absorption spectrometry.” Ann. Biol. Clin. 43: 297-318 (1993).
- Friedewald, W.T., Levy, R.I. and Fredrickson, D.S. “Estimation of the concentration of low density lipoprotein cholesterol in plasma without use of the preparative ultracentrifuge.” Clin Chem 18: 499-502 (1972).
- Balasubramanian, K.A., Manohar, M. and Mathan, V.I. “An unidentified inhibitor of lipid peroxidation in intestinal mucosa.” Biochimica et Biophysica Acta 962: 51-58 (1988).
- Uchida, K., Kanematsu, M. and Sakai, K. “Proteinbound acrolein: potential markers for oxidative stress.” Proc Natl Acad Sci USA 95: 4882-4887 (1998).
- Akerboom, T.P.M. and Sies, H. “Assay of glutathione disulfide and glutathione in the control group, this observation could be linked to a one mixed disulfides in biological samples.” Methods Enzymol. 77: 373-382 (1981).
- Aebi, H. “Catalase in vitro.” Methods Enzymol 105: 121-126 (1984).
- Paglia, D.E. and Valentine, W.N. “Studies on the quantitative and qualitative characterization of erythrocyte glutathione peroxidase.” J Lab Clin Med 70: 158-169 (1967).
- Schacterle, G.R. and Pollack, R.L. “A simplified method for the quantitative assay of small amounts of protein in biologic material.” Anal Biochem 51: 654-655 (1973).
- Bracco, E.F., Yang, M.U., Segal, K., Hashim, S.A. and Van Itallie, T.B. “A new method for estimation of body composition in the live rat.” Proceedings of the Society for Experimental Biology and Medicine 74: 143-146 (1983).
- Jones, A.P. and Friedman, M.I. “Obesity and adipocity abnormalities under nutrition during pregnancy.” Science 215: 1518-9 (1982).
- Jones, A.P., Simson, E.L. and Friedman, M.I. “Gestacional of obesity in rats.” J Nutr 114: 1484-92 (1984).
- Ravelli, G.P., Stein, Z. and Susser, M. “Obesity in young men and early infancy.” N Engl J Med 295: 349-53 (1976).
- Langley, S.C., Browne, R.F. and Jackson, A.A. “Altered glucose tolerance in rats exposed to maternal low protein diets in utero.” Comparative Biochemistry and Physiology 109: 223-229 (1994).
- Woodall, S.M., Johnson, B.M., Breier, B.H. and Gluckman, P.D. “Chronic maternal undernutrition in the rat leads to delayed postnatal growth and elevated blood pressure of offspring.” Pediatr Res 40: 438-43 (1996).
- Barker, D.J.P., Martyn, C.N., Osmond, C., Hales, C.N. and Fall, C.H.D. “Growth in utero and serum cholesterol concentrations in adult life.” Br. Med. J. 307: 1524-1527 (1993).
- Lucas, A., Baker, B.A., Desai, M. and Hales, C.N. “Nutrition in pregnant or lactating rats programs lipid metabolism in the offspring.” British Journal of Nutrition 76: 605-612 (1996).
- Fall, C.H.D., Yajnik, C.S., Rao, S., Coyaji, K.J. and Shier, R.P. “The effects of maternal body composition before pregnancy on fetal growth: the Pune Maternal Nutrition and Fetal Growth Study. In: Fetal Programming. Influences on Development and Disease in Later Life”. edited by O’Brien PMS, Wheeler T, and Barker DJP. London: RCOG Press, 231–245, (1999).
- Yajnik, C.S., Fall, C.H. and Coyaji, K.J. “Neonatal anthropometry: the thin-fat Indian baby. The Pune Maternal Nutrition Study.” International Journal of Obesity and Related Metabolic Disorders 27: 173-180 (2003).
- Urakawa, H., Katsuki, A. and Sumida, Y. “Oxidative stress is associated with adiposity and insulin resistance in men.” J Clin Endocrinol Metab 88: 4673-4676 (2003).
- Evans, J.L., Goldfine, I.D., Maddux, B.A. and Grodsky, G.M. “Oxidative stress and stress-activated signaling pathways: a unifying hypothesis of type 2 diabetes.” Endocr Rev 23: 599-622 (2002).
- Bray, T. M. and Bettger, W. J. “The physiological role of zinc as antioxidant.” Free Radical Res. Med.; 8: 281–291 (1990).
- Faure, P., Roussel, A. M. and Richard, M.J. “Effect of an acute zinc depletion on rat lipoprotein distribution and peroxidation.” Biol. Trace Elem. Res. 28: 135-146 (1991).
- Faure, P., Roussel, A. M., Martini, M., Favier, A. and Halimi, S. “Insulinsensitivity in zinc depleted rats: assessment with the euglycemic hyperinsuli nic clamp technique.” Diabetes Metab. 17: 325-331 (1991).
- Coudray, C., Richard, M.J., Laporte, F., Faure, P., Roussel, A.M. and Favier, A. “Superoxide dismutase activity and zinc status: a study in rats and man.” J. Nutr. Med. 3: 13-26 (1992).
- Vertuani, S., Angusti, A. and Manfredini, S. “The antioxidants and pro-oxidants network: an overview.” Curr Pharm Des 10: 1677-1694 (2004).

