
Manuscript accepted on :August 28, 2009
Published online on: 16-11-2015
Plagiarism Check: Yes
Fatemah Habibi and Asieh Yahyazadeh*
Department of Chemistry, University of Guilan, P.O. Box 1914, Rice Research Institute of Iran (RRII), Rasht Iran.
Abstract
Cooked rice texture and other aspects of rice starch functionality are influenced by amylose and amylopectin content and structure. With using of high performance size exclusion chromatography and capillary electrophoresis, we can determine amylose content, molecular mass of amylose and the weight- and molar-based distributions and degree of polymerization (DP) of amylose and amylopectin .this traits are the properties of starch that can be influenced on rice cooking and eating quality. For evaluation of starch and its component 10 of Iranian rice varieties with similarity in amylose content and the same gelatinization temperature were selected and after debranching of starch chain with isoamylase, the difference between varieties determined. In this procedure the structural analysis of Iranian varieties starches are described.
Keywords
Rice; Starch; Amylose; Amylopectin; Degree of polymerization; Chain length distribution
Download this article as:| Copy the following to cite this article: Habibi F,Yahyazadeh A. Evaluation of Starch Polymer Structure in Rice Grain and its Affect on Cooking Quality. Biomed Pharmacol J 2009;2(2) |
| Copy the following to cite this URL: Habibi F,Yahyazadeh A. Evaluation of Starch Polymer Structure in Rice Grain and its Affect on Cooking Quality. Biomed Pharmacol J 2009;2(2).Available from: http://biomedpharmajournal.org/?p=738 |
Introduction
Rice is one of the most important crops of the world. The biodiversity of rice is larger than that of other cereal grains (maize and wheat). Recent studies demonstrated that deference in physical behavior and functionality of rice starch are related to starch structure (Nakamura et al., 2002; Qi, Tester, Snape, & Ansell, 2003; Vandeputte, Vermeylen, Geeroms, & Delcour, 2003).
Starch is the major component of grains and a common ingredient used in the food industry. rice starch composes approximately 90% of milled rice. It is made up of two major glucose polymers, amylose, which is a slightly branched, primarily long chain a (1-4) glucan, and amylopectin, which is highly branched through (1-6) linkages. The amylose content of rice starch ranges from 0 to 30% (w/w). Cooked rice texture and rice starch functional properties are reported to be primarily impacted by amylose content (Bhattacharya, Sowbhagya, & Indudhara Swamy, 1982). However, evidence is building that variation in other aspects of rice kernels are also important determinants of rice cooking and processing quality (Bergman, Bhattacharya, & Ohtsubo, 2004). Some of these determinants include: water-soluble versus insoluble amylose content and debranched amylopectin chain length (CL) distribution (Qi, Texter, Snape, & Ansell, 2003).
Amylose content has historically been determined by the iodine-binding procedure through spectrophotometric detection (Juliano, 1971). However, iodine also binds with the amylopectin
(DP > 60), which causes overestimation of the amylose content. Furthermore, the phospholipids and free fatty acids compete with iodine in forming complexes with amylose, which tends to cause underestimation of the amylose content. Size-exclusion chromatography (SEC) is a new method that has also been used to determine amylose content by quantitation of the amount of amylose relative ta- Amylose Structure
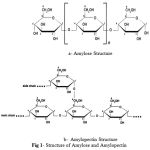 |
Figure 1: Structure of Amylose and Amylopecti.
|
b- Amylopectin Structure
Materials and Methods
Materials
10 Iranian rice varieties with the same amylose content and gelatinization temperature were selected for analyzing of starch component structure. However these varieties are same in type of amylose and gelatinization temperature but they are different in some of quality properties.
Methods
SEC (Size Exclusion Chromatography)
For SEC, the starch was solubilised and an enzyme was used to hydrolyse the branch. The Chains of starch were then injected into a column and separated on the basis of their molecular weight. It shows that chains from amylose can be separated from chains from amylopectin, and that amylose chains increase proportionately with amylose content. SEC can potentially be used to calibrate. For Using SEC, we can separate debranched chains of starch into long (consistent with being amylose) and short (consistent with being amylopectin).
Hot Water Soluble (HWS)
In order to analyze the hydrodynamic volume distribution of molecules in the hot water soluble (HWS) component of flour and the starches, a sample (250 mg) was suspended in 12.5 mL water and put in boiling water bath in 10 minutes with stirring.
For debranching an aliquot (794 μl) of the HWS starch solution was mixed with 206 of sodium acetate buffer (0.2 M, pH 4), and then isoamylase (7 μl) was added. The sample was incubated (50°C, 2h). Following incubation, the sample was boiled for 10 min to denature the isoamylase, and then centrifuged (12500g, 10min). The supernatant was desalted for 45min on 300 mg mixed bed resin (Bio-Rad) and then an aliquot (40 μl) of the desalted and debranched solution was analyzed by SEC using the calibrated UH 250 column.
Hot Water insoluble (HWI)
Whole flour (50mg) was placed into a scintillation vial and wetted with ethanol and a stirring magnet added. Sodium hydroxide (1mL.0.25M) was added with constant stirring and mixture refluxed on a hotplate (120°C, 10min). The mixture was then adjusted to 4 g water. For debranching ,an aliquot (794 μl) of the starch solution was mixed with 206 of (5 mL sodium acetate buffer (0.2 M,pH4) with glacial acetic acid (180 μl) and then isoamylase(7 μl) was added. The sample was incubated (50°C, 2h). Following incubation, the sample was boiled for 5 min to denature the isoamylase, and then centrifuged (12500g, 10min). The supernatant was desalted for 45min on 300 mg mixed bed resin (Bio-Rad) and then an aliquot (40 μl) of the desalted and debranched solution was analyzed by SEC using the calibrated UH 250 column.
CE (Capillary Electrophoresis)
Amylopectin is a highly branched polymer composed of glucose monomers. Enzymatic removal of the branches leaves many straight chains of different glucose chain lengths, or degrees of polymerisation (DP).
Capillary electrophoresis allows the separation of the differently sized chains. However, since carbohydrates do not have functional groups that are detected by conventional detectors, reductive amination with a fluorophore is necessary to detect the amylopectin chains. The fluorophore, APTS, binds only to the reductive end of the chain, so each chain has one fluorophore each. Thus, the intensity detected by the FACE corresponds to the concentration of each DP, while each peak corresponds to one DP. Hence, the amylopectin chain length distribution.
The distribution of the different sizes of chains then gives an insight on how the amylopectin affects the cooking and eating qualities of starch.
The aim of this test is to determine the chain length distribution of amylopectin.
Reagents
Water (deionised and purified with the Millipore system), 8-aminopyrene-1, 3, 6-trisulfonic acid (APTS), Sodium cyanoborohydride, Maltose mobility marker, Glucose ladder
Preparing of blank
5μl maltose mobility marker Put into an empty microfuge tube and then dried down in speed vac. 3.5μl APTS solution and 3.5μl sodium cyanoborohydride solution added to solution then the mixed with Vortex and after that incubated for 24 hours at 50°C. 40μl 6M urea and 40μl Millipore water added and mixed carefully. After Spin down for 30 seconds at 12000rpm , the sample Put in boiling water bath for 1 minute and transferred the labeled sample into a spin column and Spined for 2 minutes .it Prepared for CE run .
Prarariung Glucose ladder for Control
5μl maltose mobility marker put into the dried glucose ladder and then continued the steps as preparing of blank.
Preparing samples (in replicates)
100μl aliquot of the debranched sample collected into a fresh microfuge tube and then dried down in speed vac. 5μl maltose mobility marker added in to the dried sample and then continued the steps as preparing of blank . the amylopectin structure in samples evaluated with CE.
Statistical Analysis
Analysis of variance in a completely randomized design was made to detect significant differences among rice. Duncan’s multiple range test was employed to identify significantly different means. Statistical analyses were made with MSTATC Software.
Results and discussion
There is a dire need for alternative parameters that could adequately explain the complexities in rice functionality, especially within similar grain type. To gain a better understanding about the starch structure-functionality mechanisms in rice, we examined the structural features of the starches from ten Iranian rice cultivars which exhibit different grain quality and functional properties.
Our ultimate goal was to understand whether these cultivars showed distinct differences in starch molecular size distribution and amylopectin branch chain-length distribution, which may substantially explain observed variations in the functionality of these varieties such as milling quality, chalkiness, gelatinization, pasting behavior, and the like.
Chemical properties of Iranian rice varieties
In table1, the results of amylose content and gelatinization temperature are summarized. amylose content determined by colometric method and gelatinization temperature studied with DSC this traits are two main character to estimate quality in rice varieties but in many of local Iranian varieties, the amylase content and gelatinization temperature are same (one range).but they are have different properties in cooking and eating quality.
Fine Structure and Functionality of Rice Starch
Rice starch consists of two components: AP (very large and highly branched molecules); AM (smaller and predominantly linear molecules); (Hizukuri et al 1989). These fractions constituted a trimodal chromatogram based on the SEC analysis of native rice starch (Fig 3). The percentages of AM and AP based on the peak area of the SEC chromatogram. The ten cultivars were statistically comparable in the amount of AM.all of varieties are significant different at P=0.01 in HWS fraction and HWI fraction. We can use of this two traits for comparing of varieties.
The AP fractions resolved by CE were classified into chain types and corresponding degree of polymerization (DP) by Hanashiro et al (1996) (Table 3). Respectively, which were close to the reported range of 18.8–22.7 for rice amylopectin (Jane et al 1999). As shown in Table 3 and Fig4. , the AP chain-length distribution differed among the ten cultivars.
The differences in AP chain length distribution of the ten rice starches may explain their differences in thermal properties and pasting behavior, and possibly milling quality and grain physical attributes. It appears that variations in structural features of rice starch may be also associated with the observed differences in the milling quality, grain chalkiness, and translucency among the ten cultivars. The higher percentage of chalky kernels, lower translucency, and lower head rice yield were linked to lower amount of shorter chain AP (A and B1) and higher amount of the longer chains (B2 and B3 longer chains). It is speculated that variations in the molecular structures of starch may result in different inter- and intramolecular interactions or associations, affect the packing and stability of starch granules that make up the rice kernels, and eventually bring about some differences in rice functionality. However, more work is needed to validate the observed trends.
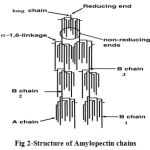 |
Figure 2: Structure of Amylopectin chains.
|
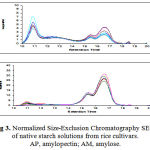 |
Figure 3: Normalized Size-Exclusion Chromatography SEC) of native starch solutions from rice cultivars. AP, amylopectin; AM, amylose.
|
The results in table 3 showed that all of Iranian local varies in this research are significant different at P= 0.01 with evaluating of A,B and long chains we can find difference between varieties.
Table1- Physicochemical Properties of Milled Rice Flour from Iranian Rice varieties
| Domsefid | Domsorkh | Sangtarom | Domzard | Hasanseraee | salari | Taromsari | Domsiah | Shahak | tarom | |
| % Amylose | 23.65 | 21.14 | 22.53 | 21.4 | 22.73 | 22.87 | 22.83 | 22.6 | 21.8 | 22.7 |
| Gelatinization Temperature | 71.17 | 73.74 | 72.94 | 71.69 | 72.86 | 72.49 | 71.68 | 73.80 | 72.62 | 71.64 |
Table 2- Molecular Weight Distribution of Starch of Iranian Rice varieties by SEC
| Domsefid | Domsorkh | Sangtarom | Domzard | Hasanseraee | salari | Taromsari | Domsiah | Shahak | tarom | |
| HWS Amylose | 42.99a | 33.15c | 30.02d | 31.97c | 25.56f | 42.74a | 36.37b | 29.47d | 28.53de | 26.90ef |
| HWS Amylopectin | 35.92 | 35.76 | 40.78 | 42.13 | 47.49 | 30.78 | 33.25 | 38.24 | 39.38 | 46.28 |
| HWI Amylose | 4.25cd | 5.75ab | 4.74bc | 2.92cd | 4.34de | 6.72a | 1.81f | 4.78cd | 4.98bc | 3.37e |
| HWI Amylopectin | 90.29 | 89.65 | 89.29 | 93.43 | 89.96 | 87.33 | 93.00 | 89.48 | 89.04 | 91.13 |
| Retention time for AM | 11.22a | 11.19a | 11.21a | 10.91c | 10.91bc | 10.90c | 10.99bc | 10.93b | 10.90c | 10.92bc |
| Retention time for AP | 17.00 | 16.98 | 16.97 | 16.60 | 16.59 | 16.57 | 16.59 | 16.57 | 16.59 | 16.59 |
| DPa for AM | 2582.64 | 2694.87 | 2638.00 | 3945.94 | 3945.94 | 3945.9 | 3513.99 | 3765.68 | 3945.94 | 3854.48 |
| DP for Ap | 19.12 | 19.52 | 19.93 | 30.43 | 30.98 | 31.54 | 30.98 | 31.54 | 30.98 | 30.98 |
a- Degree Of Polymerization
Table 3: Chain-Length Distribution (DP) of Amylopectin from Isoamylase-Debranched Starch of Iranian Rice varieties by CE.
| %Distribiution | |||||||||||
| DP range | Chain type | Domsefid | Domsorkh | Sangtarom | Domzard | Hasanseraee | salari | Taromsari | Domsiah | Shahak | tarom |
| 6-12 | A | 24.45e | 27.75ab | 26.37c | 27.98a | 25.22de | 25.83cd | 26.78bc | 28.03a | 28.07a | 26cd |
| 13-24 | B1 | 52.87e | 58.86abc | 58.04bcd | 56.87d | 57.82bcd | 57.68bcd | 56.96bcd | 59.19ab | 59.79a | 57.18cd |
| 25-36 | B2 | 10.82a | 9.56bc | 10.00a | 10.3ab | 10.97a | 10.79a | 10.41ab | 9.43c | 9.12c | 10.93a |
| 37-60 | B3+
long chains |
11.55a | 4.04cd | 5.08bc | 4.83bc | 5.96b | 5.67b | 5.42bc | 3.32d | 3.00d | 5.86b |
Table 4-Analysis of Variance for Molecular Weight Distribution of HWS and HWI Amylose of Iranian Rice varieties by SEC
| Mean Square | ||||
| Source | Degree Of Freedom | HWS Fraction | HWI
Fraction |
 (Visited 969 times, 1 visits today) (Visited 969 times, 1 visits today)
|
