
Manuscript accepted on :April 13, 2009
Published online on: 13-11-2015
Plagiarism Check: Yes
C. Narasimha Rao¹,2, K. Balaji¹, and P.Venkateswarlu¹*
¹Department of Chemistry, Sri Venkateswara University, Tirupati - 517 502 India.
²Department of Zoology, Sri Venkateswara University, Tirupati - 517 502 India.
Abstract
Cyclic voltammetry and differential pulse voltammetry methods were used to determine Azathioprine (AZP) and Rocuronium (RCR) in biological fluid samples. To enhance the sensitivity of the proposed method, a clay modified carbon paste electrode (CMCPE) was used which showed increased peak currents compared to bare carbon paste electrode (CPE).The linearity was observed in the concentration ranges of 2.2×10⁻⁹ to1.2×10-5 M (AZP) and 0.2×10⁻⁹ to1.2 ×10-5 (RCR) with detection limits of 2.1×10⁻⁹ M (AZP) and 0.4×10⁻⁹ M (RCR). From the experimental results, it is found that the proposed method exhibited good repeatability and reproducibility. The present method has been successfully applied for the determination of AZP and RCR in spiked human serum samples and urine samples.
Keywords
Cyclic voltammetry; differential pulse voltammetry; Azathioprine; Rocuronium
Download this article as:| Copy the following to cite this article: Rao C. N, Balaji K, Venkateswarlu P. Determination of Azathioprine and Rocuronium in Biological Fluid Samples by Voltammetry. Biomed. Pharmacol. J.2009;2(1) |
| Copy the following to cite this URL: Rao C. N, Balaji K, Venkateswarlu P. Determination of Azathioprine and Rocuronium in Biological Fluid Samples by Voltammetry. Biomed. Pharmacol. J.2009;2(1). Available from: http://biomedpharmajournal.org/?p=632 |
Introduction
Azathioprine [6-[(1-methyl-4-nitro-1H-imidazol-5-yl)sulfanyl]-7H-purine] (AZP) is a 6-mercaptopurine derivative used as an immunosuppressive agent for prevention of transplant rejection and for the treatment of rheumatoid arthritis and various autoimmune diseases.
Rocuronium [[3-hydroxy-10,13-dimethyl-2-morpholin-4-yl-16- (1-prop-2-enyl-2,3,4,5-tetrahydropyrrol-1-yl)-2,3,4,5,6,7,8,9,11,12,14,15,16,17-tetradecahydro- 1H-cyclopenta[a] phenanthren-17-yl] acetate] (RCR) is a non-depolarizing agent neuromuscular blocking agent used as an adjunct in general anaesthesia and as skeletal muscle relaxant during surgery.
AZP was determined by 1H NMR spectroscopy (1), spectrophotometric (2) and chromatographic (3- 6) methods. RAN was determined by HPLC (20), GC-MS (22) and LC (23) methods which are expensive and time consuming. In the present work, a cheaper and selective voltammetric determination of AZP and RCR has been reported.
Experimental
Voltammograms were recorded with Metrohm 757 VA computrace (Herisau, Switzerland).AZP and RCR were purchased from Sigma. Graphite powder (l-2 mm particle size), paraffin oil and Clay from Aldrich India Ltd., Bangalore. All chemicals used for the preparation of buffers and supporting electrolytes are of reagent grade.
Recommended Procedure
A suitable amount of analyte is transferred into the electrolytic cell containing Britton-Robinson buffer solution. To remove oxygen, the solution is purged with nitrogen gas for 10 min. The voltammograms are recorded after each aliquot of the standard solution is added.
Results and Discussion
Cyclic Voltammetry
Figs. 1 and 2 illustrate the cyclic voltammograms recorded for AZPand RCR at carbon paste (CPE) and clay modified carbon paste electrode (CMCPE). On scanning towards a negative potential on a bare carbon paste electrode, only a much smaller cathodic peak is observed. When CMCPE is used a large increase in the peak currents is observed. No peaks are observed in the anodic sweep indicating that the reduction of AZP and RCR is of irreversible process.
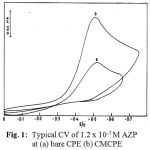 |
Figure 1: Typical CV of 1.2 x 10⁻⁷ M AZP RCR at (a) bare CPE (b) CMCPE.
|
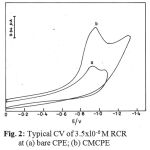 |
Figure 2: Typical CV of 3.5xl0-6 M at (a) bare CPE; (b) CMCPE.
|
Differential Pulse Voltammetry
Figs. 3 and 4 illustrate differential pulse voltammograms obtained at bare carbon paste electrode and clay modified carbon paste electrodes of AZP and RCR in BR buffer. From the obtained results the peak current obtained at clay modified carbon paste electrode are almost twice than those at carbon paste electrode of AZP and RCR.
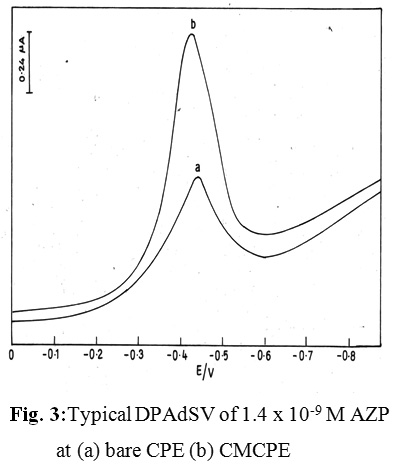 |
Figure 3:Typical DPAdSV of 1.4 x 10⁻⁹ M AZP at (a) bare CPE (b) CMCPE.
|
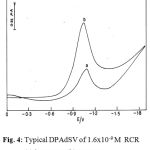 |
Figure 4: Typical DPAdSV of 1.6×10⁻⁹ M RCR (a) bare CPE; (b) CMCPE.
|
This peak in the voltammogram of AZP is attributed to the four electron reduction of nitro group to the corresponding hydroxylamine group according to the currently accepted mechanism for electroreduction of nitro compounds (82-84).
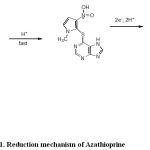 |
Scheme 1: Reduction mechanism of Azathioprine.
|
The peak in the voltammogram of RCR is attributed to the reduction of carbon, carbon double bond according to the currently accepted mechanism for the electroreduction of carbon, carbon double bond containing compounds.(25, 26).
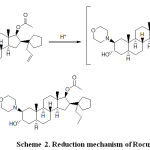 |
Scheme 2: Reduction mechanism of Rocuronium.
Click here to View Scheme |
Table 1: Chosen Experimental Conditions.
| Variables | Chosen Value | |
| AZP | RCR | |
| pH | 8.5 | 3.0 |
| Buffer volume (ml) | 10 | 10 |
| Accumulation potential (V) | – 0.16 | -0.4 |
| Accumulation time (s) | 160 | 150 |
| Rest time (s) | 15 | 25 |
| Stirring rate (rpm) | 2000 | 2000 |
| Scan rate (mVs-1) | 10 | 10 |
| Pulse amplitude (mV) | 50 | 50 |
Table 2: Experimental data of AZP and RCR
| Parameters | AZP | RCR | ||
| CPE | CMCPE | CPE | CMCPE | |
| Linearity range (M) | 2.0 ´ 10-8 to
3.0 ´ 10-7 |
2.2 ´ 10-9 to
1.2 ´ 10-5 |
1.2 ´ 10-8 to
1.0 ´ 10-5 |
0.2 ´ 10-9 to
1.2 ´ 10-5 |
| Calibration curve equation | Y(mA)=0.30214X +0.03535 | Y(mA)=0.2985X+ 0.0442 | Y(mA)=0.9815X +0.1139 | Y(mA)= 0.9865 X +0.1063 |
| Correlation coefficient | 0.9971 | 0.9995 | 0.9865 | 0.9815 |
| L.O.D (M) | 1.5 ´ 10-8 | 2.1 ´ 10-9 | 1.4 ´ 10-8 | 0.4 ´ 10-9 |
| L.O.Q (M) | 0.5 ´ 10-7 | 0.667 ´ 10-8 | 0.466 ´ 10-7 | 0.133 ´ 10-8 |
| Repeatability of
peak currents %RSD) |
4.28 | 4.86 | 4.29 | 4.32 |
| Repeatability of
Peak potentials %RSD) |
0.32 | 0.38 | 0.54 | 0.59 |
| Reproducibility of peak currents
%RSD) |
3.92 | 4.02 | 4.91 | 4.98 |
| Reproducibility of potentials
%RSD) |
0.51 | 0.53 | 0.32 | 0.38 |
| Numbers of assays | 12 | 12 | 12 | 12 |
Table 3: Determination of AZP and RCR in spiked human serum samples
| Name of the drug | Amount labelld (m.g/L) | *Average amount found
(m.g/L) |
Recovery percentage
(%) |
+ S.D | RSD |
| AZP | 2 | 1.961 | 98.0 | 0.0200 | 1.02 |
| 4 | 3.93 | 98.25 | 0.0461 | 1.173 | |
| 6 | 5.956 | 99.26 | 0.0208 | 0.349 | |
| RCR | 4 | 3.923 | 98.07 | 0.0513 | 1.307 |
| 8 | 7.93 | 99.125 | 0.0655 | 0.825 | |
| 12 | 11.9167 | 99.30 | 0.0611 | 0.5127 |
* Each value is an average of three determinations.
Table 4: Determination of AZP and RCR in spiked human urine samples
| Name of the drug | Amount Spiked (m.g/L) | *Average amount found
(m.g/L) |
Recovery percentage
(%) |
+ S.D | RSD |
| AZP | 2 | 1.97 | 98.50 | 0.004 | 0.2030 |
| 4 | 3.94 | 98.5 | 0.0624 | 1.583 | |
| 6 | 5.71 | 95.31 | 0.07 | 1.17 | |
| RCR | 2 | 1.98 | 99.0 | 0.0206 | 1.040 |
| 4 | 3.903 | 97.57 | 0.032 | 0.81 | |
| 6 | 5.72 | 95.33 | 0.0670 | 1.17 |
* Each value is an average of three determinations.
Conclusion
Clays are complex micro porous media with an appreciable surface area helped in increasing the sensitivity of the proposed method. Due to CMCPE, stability, accuracy and low expensive, it offers a good possibility as a substitute for the previous approaches used in routine analysis, such as colorimetric, spectrophotometric and chromatographic methods. Results obtained in the developed method shows that drugs can be determined accurately and reliably at a lower expens
References
- Nilgun Gunden Goger, H. Kursat Parlatan, Hasan Basan, Aysel Berkkan, Tuncel Ozden,J. Pharm. Biomed. Anal., 21 (1999) 685-689.
- Chilukuri S.R. Lakshmi, Manda N. Reddy, Talanta, 47 (1998) 1279-1286.
- Erik C. Van OS, Jeffrey A. McKinney, Bradley J. Zins, Dennis, C. Mays, Zachary H. Schriver, William J. Sandborn, James J. Lipsky, J. Chrom. B: Biomed. Sci. Appli., 679 (1996) 147-154.
- Kimiko Tsutsumi, Yoshie Otsuki, Toshio Kinoshita, J. Chrom. B. Biomed. Sci. Appli., 231 (1982) 393-399.
- R. Boulieu, A. Lenoir, C. Bory, J. Chrom. Biomed. Sci. Appli., 615 (1993) 352-356.
- Teck Ling Ding, Leslie Z. Benet, J. Chrom. B: Biomed. Sci. Appli., 163 (1979) 281-288.
- Agata Blazewicz, Zbigniew Fijalek, Malgorzata Warowna-Grzeskiewicz, Magdalena Boruta, J. Chrom. A., 1149 (2007) 66-72.
- Ling Gao, Iqbal Ramzan, Barry Baker, J. Chrom. B: Biomed. Sci. Appli., 757 (2001) 207-214.
- C. Farenc, C. Enjalbal, P. Sanchez, F. Bressolle, M. Audran, J. Martinez, J.L. Aubagnac, Chrom. A, 910 (2001) 61-67.
- P. J. Declerck, C. J. De Ranter, Analusis 15 (1987) 148-159.
- P. zuman, Z. Fijalek J.electroanal. Chem., 296 (1990) 589-593.
- El. Jammal, J. C. Vire, G. J. Patriarche, O. N. Palmeiro, Electroanalysis 4 (1992) 57-64
- S. Fedez, de Bentono, J. M. Moreda, A. Arranz, j. F. arranz, Anal. Chim. Acta 329 (1996) 25-31
- M. Sreedhar, Madhusudana T. Reddy, K. Balaji, Jayarama S. Reddy, Intern. J. Environ. Anal. Chem. 86 (2006) 757-767.

