
Manuscript accepted on :September 26, 20
Published online on: --
Plagiarism Check: Yes
Bh. Ch. Narasimharaju¹, G. Devalarao² and Sikharam Ramanjaneyulu³
¹A.S.N.Pharmacy College, Burripalem Road, Tenali (India).
²KVSR Siddhartha College of Pharmaceutical Sciences, Vijayawada (India).
³St.Ann’s College of Pharmacy, Chirala (India).
Corresponding Author E-mail: bhchnraju@yahoo.com
Abstract
A Simple and reproducible spectrophotometric method has been developed for the determination of Ezetimibe in bulk and in dosage forms. The lmax of Ezetimibe was found to be 234 nm. Linearity for this method lies in the range of 5-20 µg/ml. The proposed method is sensitive, accurate, reproducible and useful for the routine determination of Ezetimibe in tablet dosage form. No interference was observed from the excipients.
Keywords
Ezetimibe; UV Spectrophotometer
Download this article as:| Copy the following to cite this article: Narasimharaju B. C, Devalarao G, Ramanjaneyulu S. Spectrophotometric Method for the Determination of Ezetimibe in Pharmaceutical Formulations. Biomed. Pharmacol. J.;1(1) |
| Copy the following to cite this URL: Narasimharaju B. C, Devalarao G, Ramanjaneyulu S. Spectrophotometric Method for the Determination of Ezetimibe in Pharmaceutical Formulations. Biomed. Pharmacol. J.;1(2). Available from: http://biomedpharmajournal.org/?p=475 |
Introduction
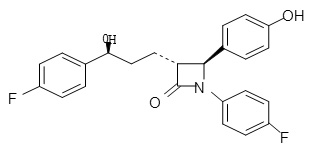
Ezetimibe is a new Class of lipid lowering drug, which differs from other classes of cholesterol reducing compounds. It is chemically as (3R, 4S)-1-(4-Flourophenyl-3 Hydroxy propyl]-4-(Hydroxy pheny-2-azetidinone1.
James E.Patrick et al studied the Ezetimibe pharmacokinetics2. Literature survey reveals the availability of few analytical methods such as HPCL3-5 ,LC-MS6, derivative spectrophotometry7 and voltammetry8 for determination of Ezetimibe in pharmaceutical Formulations. In the present investigation the authors propose a simple, sensitive and Reproducible spectrophotometric method for determination of Ezetimibe.The method is based on the measurement of light absorption in UV region in ethanol.
Expermental
Instrument
Spectral and absorbance measurements were made
On Shimadzu UV/V is spectrophotometer 1601 with 1 cm matched quartz cells.
Materials and Methods
Hetero Drug House private limited, Hyderabad, supplied Ezetimibe gratis. The tablets were obtained commercially. All other chemicals were of analytical grade.
Method
UV Spectrophotometer
The stock solution of Ezetimibe was prepared by dissolving 50 mg of pure drug in ethanol in a 50ml volumetric flask. It was diluted as and when required. The absorbance of 10-μg/ml was measured against a solvent blank between 200-400 nm. A graph was plotted and the absorption maximum was determined as 234 nm, which is shown in fig 1. A calibration curve was obtained at 234 nm for a series of concentrations in the range of 5-20 μg/ml. It was found to be linear and hence, suitable for the estimation of the drug. The slope, intercept correlation coefficient and optical characteristics9 and summarized in Table 1.
Table 1: optical characteristic and precision data.
|
PARAMETERS |
UV METHOD VALUE |
|
Absorption Maximum (nm) Beer’s law limit (mcg/ml) Sand ell’s sensitivity ( μg/cm2/0.001 abs. units) Molar Extinction Coefficient (L.mol-1cm-1) Correlation coefficient (r) Slope (m) Intercept (c) % RSD % Range of errors: 0.05 significance level 0.01 significance level |
234
5-20
0.0217
188730
0.9998
0.04
0.0059
0.523
0.0021
0.0028 |
For five replicate analysis with in Beer’s law limits
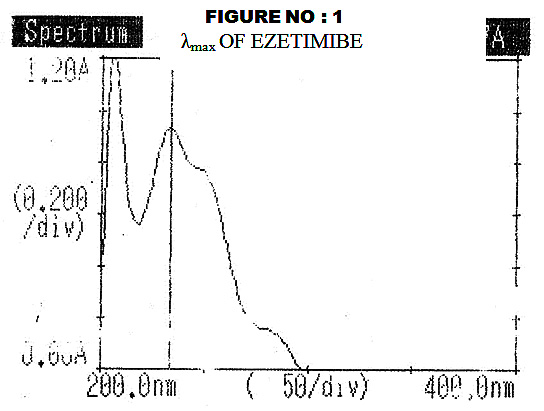 |
Figure 1 : Λmax Of Ezetimibe.
|
Market sample Analysis
Twenty tablets were weighed and finely powered. An accurately weighed portion of this equivalent to 50 mg of Ezetimibe was transferred in the 50 ml volumetric flasks containing about 25ml ethanol. The contents were sonicated for 30 min with intermittent shaking to ensure the complete solubility of the drug and then filtered through 0.45µm membrane filter. The volume was made to the mark with ethanol. The results are shown in table 2,
Table 2: Results of Assay.
| Sample | Label claim
(mg) |
UV-Method | |
| Amount found (mg) | (%) R.S.D | ||
| Tablet-1
Tablet-11
|
10
10 |
9.95
9.98 |
0.661
0.583 |
Recovery studies
To study the accuracy and reproducibility10 of the proposed method, adding a known amount of drug to preanalysed sample at three levels and the percentage of recoveries were found out. The results are summarized in Table 3, which was found to be satisfactory.
Table 3: Recovery studies of Ezetimibe.
|
Sample concentration (μg/ml)
|
Fortified concentration (μg/ml) |
Percentage Recovery |
|
| Tablet A | Tablet B | ||
|
10 |
8
10
12 |
99.11
97.10
96.95
|
98.0 98.70 97.50
|
Results and discussion
The λ max of Ezetimibe in ethanol was found to be 234 nm. The amount of drug determined by the proposed method was in good agreement with label claimed providing the accuracy of the proposed method. The low percentage relative standard deviation indicates the reproducibility of the method. The method is useful for tablet formulation where there is no interference of excipients in the absorbance of Ezetimibe.Thus the proposed method was simple, accurate and reproducible and can be used for the routine analysis of Ezetimibe in bulk and in pharmaceutical dosage forms.
Acknoledgements
The authors are grateful to m/s Hetro Drug House Private Limited, Hyderabad, for providing the authentic of Ezetimibe sample and Dr. Ceeal Analytical Lab, Chennai, for providing the facilities to carry out the present investigation.
References
- The Merck index, maryadele J.o. Neil. Eds, In: 13th edition, Published by Merck Research Lab, Division of Merck and Co., White House Station, NJ, USA. 2002, PP.3949.
- James E.Patrick, Teddy Kosoglou, kathe l. Stauber, Kevin B.Alton, Stephen E.Maxwell, YaliZau, PaulStatkevich, RobertIannucci, Swapan Chowdhury, Melton Affrime, and Mitchell N.Cayen, Disposition of the Selective Cholesterol Absorption Inhibitor Ezetimible in Healthy Male Subjects, Journal of Drug metabolism and Disposition, 2002:30(4); 430-437.
- MuhammadAshfaq,IslamUllahkhan,SyedShanazQutab,SyedNaeemrazzaq ,HPLC Determination of Ezetimibe and simvastatin in pharmaceutical Formulations.J.Chil .chem.soc 52 no 3(2007).1220-1223.
- G.Carlucci,P.MazzecoL.Biordi,M.BolognaJ.Pharm..Biomed.Anal.10(9),693 (1992).
- H.Ochiai.N.Uchiyama,K.Imagaki.S.Hata.T.Kamei.J.Chromatogr.B.Biomed .Sci.Appl.694(1),211(1997)
- B.Barrett,JHuclova.V.Borek_Dohalsky,B.Nemec,I.JelinekJ.Pharm.Biomed.Anal.41(2), 517(2006).
- L.Wang,M.Asgharnejad J.Pharm.Biomed,Anal21(6),1243(2000).
- O.Corah.S.AOzkan.Pharmazie,61(4),285(2006)..
- Frederick J Gravette’s, Lancy B and Wallnau, Essential of Statistics for the behavioral Sciences, 2nd Edition, West Publishing Company, 1995, PP2-4, 173-175.
- ICH Steering Committee, Validation of analytical procedures/methodology, ICH Harmonized Tripartite Guidelines, 1996.

