
Manuscript accepted on : July 16, 2008
Published online on: --
Plagiarism Check: Yes
M. Rama Rao¹*, S. V. Raja Gopal¹, A. D. Naveen Kumar1 and G. Satyanvani²
1Department of Biotechnology, College of Science, Gitam University, Visakhapatnam (India).
2Department of Biochemistry, College of Science, Gitam University, Visakhapatnam (India).
Corresponding Author E-maiil:ramaraomalla@rediffmail.com.rrmalla@gitam.edu
Abstract
A number of Indian medicinal plants have been used for thousands of years in the traditional system of Ayurvedic medicine. Ayurvedic system that provides protection from diseases of ageing is called rasayana. This group of plants generally possessing strong antioxidant activity, but only a few have been investigated in detail. In the present study, eight such plants are screened for the presence of enzymatic and non-enzymatic antioxidants. Among the enzymatic antioxidants studied in medicinal plants, SOD and catalase are predominant in A. vera and peroxidase in A. indica where as non-enzymatic antioxidants such as reduced glutathione and vitamin C are predominant in O. sanctum and total phenolic in E. hirta. The effect of the plant extracts on lipid peroxidation are as follows: O. sanctum (IC 50=58µg/ml) >E. hirta (IC 50 = 60µg/ml)>T.procumbens (IC 50=62µg/ml)> A. vera (IC 50=65 µg/ml) >A. indica (IC50=75 µg/ml) >P. betel (IC50 =76 µg/ml) >S. cumini (IC50=85 µg/ml) >C. gigantea (IC50 = 90 µg/ml). The present study clearly emphasizing the antioxidant potential of these plants and their importance in rasayana.
Keywords
Indian medicinal plants; Rasayana; antioxidant activity; lipid peroxidation
Download this article as:| Copy the following to cite this article: Rao M. R, Gopal S. V. R, Kumar A. D. N, Satyanvani G. Comparative Evaluation of the Antioxidant Potential of Selected Indian Medicinal Plants (Rasayanas). Biomed. Pharmacol. J.2008;1(2) |
| Copy the following to cite this URL: Rao M. R, Gopal S. V. R, Kumar A. D. N, Satyanvani G. Comparative Evaluation of the Antioxidant Potential of Selected Indian Medicinal Plants (Rasayanas). Biomed. Pharmacol. J.2008;1(2). Available from: http://biomedpharmajournal.org/?p=460 |
Introduction
The medicinal properties of plants have been investigated in the light of recent scientific developments throughout the world, due to their potent pharmacological activities, low toxicity and economic viability. The principles of Ayurvedic rasayana, which prevents disease and counteracts the ageing process by means of optimization of homeostasis. Natural compounds from medicinal plants having antioxidant activities, have been using as potential therapeutic agents of aging 9. Super oxide dismutase and catalase represent potential protein drugs for antioxidant therapy31.
A number of highly reactive oxygen species, which include the superoxide anion, the hydroxyl radical and hydrogen peroxide are produced as unavoidable side products in the normal metabolism. Organisms have a comprehensive array of antioxidant defense mechanisms to reduce free radical formation or reduce their damaging effects. These include enzymes such as superoxide dismutase and catalase to degrade superoxide and peroxides respectively and essential radical scavengers like ascorbic acid and reduced glutathione24. However, oxidative stress is generated when equilibrium favors free radical generation as a result of a depletion of antioxidant levels. An improved antioxidant status helps to minimize the oxidative damage and thus to delay or prevent pathological changes. Potential antioxidant therapy should be therefore including either natural free radical scavenging antioxidant enzymes or agents which are capable of augmenting the activity of the antioxidant enzymes2.
Medicinal plants (Rasayanas) like Aloe vera, Azadiracta indica, Calotropis gigantea, Euphorbia hirta, Ocimum sanctum, Piper betel, Syzigium cumini, Tridax procumbens have been extensively used in the Indian traditional system of medicine for management of ageing diseases such as cancer, diabetes, hemorrhoids, ulcers, inflammation, rheumatism, asthma and bronchitis 4,6,11,13,25,26,28,33.
In order to contribute further to the knowledge of Indian traditional plants, in the present study, eight medicinal plants (rasayanas) were screened for both enzymatic and non-enzymatic antioxidant activities. Effect of their extracts on lipid peroxidation was also studied.
Materials and Methods
Chemicals
Xanthine, xantine oxidase, cytochrome c, EDTA, Ascorbic acid, 2, 6-dichloro phenol indophenol, benzidine, are obtained from Sigma chemical Company, USA. All other chemical used in the present study were of analytical grade and obtained from local suppliers.Double distilled water obtained from all glass distillation apparatus was used through out the experiment unless otherwise stated. Plant samples were authenticated by the department of Botany, Andhra University.
Plant samples
Leaves of A. vera, A. indica, C. gigantea, E. hirta, O. sanctum, S. cumini, T. procumbens were obtained from local garden and P. betel leaves were obtained from local market.
Preparation of enzyme extract
The leaves of A. vera, A. indica, C. gigantea, E. hirta, O. sanctum, P. betel, S. cumini, T. procumbens were thoroughly washed. The extracts (10% W/V) were separately prepared by grinding the 1g of wet tissue in 10 ml of phosphate buffer, pH, 7.5 using chilled mortar and pestle. The homogenates were centrifuged at 10,000 g for 15 min and the supernatants were used for assaying enzymatic and non-enzymatic antioxidant activities and their effects on lipid peroxidation.
Total antioxidant activity
The total antioxidant capacity of the samples was evaluated by the method of Prieto et al., 19. An aliquot of each sample (0.05ml) was mixed with 0.5ml of reagent (0.6M sulphuric acid, 28 mM sodium phosphate and 4mM ammonium molybdate) in 1.5 ml eppendorf tube. The tubes were capped and boiled in a boiling water bath at 95°C for 90 min and cooled. The absorbance of each sample was measured at 695nm against blank in a spectrophotometer. A typical blank contained 0.5ml of reagent solution and 0.05ml of buffer and treated in the same manner as test. The antioxidant capacity was expressed as micro moles of ascorbic acid equivalents of antioxidant capacity (AEAC).
Assay of superoxide dismutase
The enzyme of super oxide dismutase was assayed according to the modified procedure of Mc Cord and Fridovich15. The absorbance of reaction mixture containing 0.64ml of distilled water, 0.7ml of 216mM phosphate buffer, pH 7.8, 0.02 ml of 10.7mM EDTA solution, 0.04ml of 1.10mM cytochrome c solution and 1.40 ml of 0.108mM xanthine solution was monitored in a spectrophotometer at 550nm until it reaches constant value. The reaction was initiated by adding 0.1ml of xanthine oxidase solution (100 units) and 0.1ml of extract. After mixing the sample the increase in absorbance was recorded for one min. Blank was carried out with out extract. A unit of enzyme activity was expressed as the inhibition of rate of reduction of cytochrome c by 50% per min per mg protein.
Assay of catalase
The catalase activity was assayed by the titrimetric method based on the procedure described by Radhakrishnan and Sarma 20. 2.5ml of 0.1M sodium phosphate buffer, pH 7.5and 2.5ml of 0.9% hydrogen peroxide(v/v) in the same buffer were taken and 0.5ml of enzyme extract was added and incubated at 28°C for 3min. The reaction was then arrested by adding 5ml of 2N H2SO4 and the residual H2O2 was titrated with 0.1N KMnO4 solution. Blank was carried out with out extract. Unit of catalase activity was expressed as ml of 0.1N KMnO4 equivalents of hydrogen peroxide decomposed per min per mg protein
Assay of peroxidase
Peroxidase activity was assayed according to the method described by Seevers et al.,27. The reaction mixture containing 0.5ml of 20mM sodium acetate buffer, pH 5.0, 0.5ml of 1.3mM benzidine and 0.5ml of suitably diluted extract was taken in a cuvette. The enzyme reaction was initiated by the addition of 0.1ml of 30mM hydrogen peroxide. The reference contained all the components of the reaction mixture except hydrogen peroxide, which was substituted by an equal volume of the buffer. The increase in the optical density at 420nm was recorded for 10 min at 1min intervals in a UV-Visible spectrophotometer. Peroxidase activity was expressed as an increase in optical density (0.1) from the linear portion of graph at 420nm / min/mg protein.
Assay of ascorbate oxidase
Assay of ascorbate oxidase activity was carried out according to the method of Vines and Oberbacher 30. To 3.0 ml of ascorbate solution (18.8 mg ascorbic acid is dissolved in 300ml of 0.1M Phosphate buffer, pH 5.6), 0.1 ml of enzyme extract was added and the change in the absorbance at 265nm is measured at an interval of 30 sec for a period of 5 min. One enzyme unit was equivalent to 0.01 O.D change per min/ mg protein.
Determination of protein content
Protein concentration of the enzyme extract was determined by the method of Lowry et al.,12 using crystalline BSA as standard.
Estimation of reduced glutathione
The amount of reduced glutathione (GSH) in the samples was estimated by the method of Boyne and Ellman3. 1.0 ml of the extract was treated with 4.0 ml of precipitating solution (1.67 g of glacial metaphosphoric acid, 0.2 g of EDTA and 30 g of NaCl in 100ml water). After centrifugation, 2.0 ml of the protein-free supernatant was mixed with 0.2 ml of 0.4 M NaHPO4 and 1.0 ml of DTNB reagent (40 mg DTNB in 100 ml of aqueous 1% tri sodium citrate). Absorbance was read at 412 nm within 2 min against a blank containing precipitating solution instead of the sample. Standard consisting different concentrations of glutathione (20 -100 n mol/ml) were also treated similarly and standard curve was drawn. GSH concentration was expressed as n mol per g tissue.
Determination of ascorbic acid
Ascorbic acid content of different plant extracts was determined by titrimetric method of David Emlyn5. In the estimation of Vitamin C, 5.0ml of standard ascorbic acid (0.04mg/ml) was taken in the conical flask, 1.0 ml of glacial acetic acid was added and titrated against the 2, 6-dichlorophenol indophenol. 5.0 ml of suitable diluted plant extract was also titrated with dye and the amount of vitamin C in the sample was determined using standard and expressed as mg per g tissue.
Total phenolic compound analysis
The total phenolics present in leaves of different plants were determined as reported by Javanmardi et al., 10. To 0.5ml of each sample, 2.5ml of diluted Folin Cio-Calteau reagent and 2ml of 7.5% (w/v) sodium carbonate were added and incubated at 45°C for 15 min. The absorbance of samples was measured in a spectrophotometer at 765nm. Gallic acid was used as standard and the results were expressed as mg of gallic acid equivalent (GAE) per gm tissue.
Inhibition of in vitro lipid peroxidation
Effect of different medicinal plant extracts on lipid peroxidation induced by FeSO4-ascorbate system in sheep liver homogenate was estimated as thiobarbituric acid reacting substances (TBARS) by the method of Ohkawa et al., 16. The reaction mixture contained 0.1ml of sheep liver homogenate (25%) in Tris-HCl buffer (20mM, pH 7.0; KCl (30mM); FeSO4 (NH4) SO4.7H2O (0.06 mM) and various concentrations of plant extracts (10, 50,100,250 and 500µg/ml) in a final volume of 0.5ml. The reaction mixture was incubated at 37oC for 1h. After the incubation, 0.4ml was removed and treated with 0.2ml sodium dodecyl sulphate (SDS) (8.1%), 1.5ml thiobarbituric acid (TBA) (0.8%) and 1.5ml of acetic acid (20%, pH 3.5). The total volume was made up to 4.0ml with distilled water and then kept in a water bath at 95oC for 1h. After cooling, 1.0ml of distilled water and 5.0ml of n-butanol and pyridine mixture (15:1) were added to the reaction mixture, shaken vigorously and centrifuged at 4000g for 10 min. The butanol pyridine layer was removed and its absorbance was measured at 532 nm. Inhibition of lipid peroxidation was determined by comparing the optical density (OD) of the extract with that of the control. Quercetin was used as standard.
Statistical analysis
Each value is an average of five determinations and the values were expressed as mean ± SD. The statistical significance was evaluated by student’s t-test. Level of significance was set at p<0.05. IC50 values are calculated by Regression line analysis using five values.
Results and Discussion
Total antioxidant activity
The total antioxidant activity of different medicinal plant extracts were shown in the figure 1. The total antioxidant activity ranged from 10.8 to 119.7 m M of ascorbic acid equivalents in C. gigantea and A. vera extracts respectively. However the total antioxidant activity of greater celandine was 90.06 m M and of Garcinia indica was 47.0 m M of ascorbic acid equivalents1, 14.
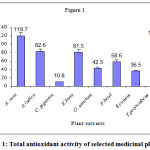 |
Figure 1: Total antioxidant activity of selected medicinal plants.
|
All the values are an average of five determinations and expressed as mean ± S.D
Enzymatic antioxidants
The levels of antioxidant enzymes assessed in different medicinal plant extracts were shown in table 1. In various inflammation inhibition tests, plant SODs are found to exhibit significantly greater anti-inflammatory activity34. The super oxide dismutase activity was observed to be maximum in A. vera (18.5 units/mg protein) and minimum in C. gigantia (2.42 units /mg protein). The SOD activity of T. procumbens, E. hirta, P. betel, O. sanctum, A. indica and S. cumini is in the range of 15.22 to 9.56 units/mg protein. How ever SOD activity of Berries was 13.24 units /mg protein 22.
Table 1: Enzymatic antioxidant potentials of selected medicinal plants.
| Plant extract | Super oxide dismutase
(Units/mg protein) |
Catalase
(Units/mg protein) |
Peroxidase
(Units/mg protein) |
Ascorbic acid oxidase
(Units/mg protein) |
| A. vera | 18.52±0.74 | 98.86±0.1 | 0.05±0.02 | 0.18±0.01 |
| A. indica | 8.22±0.56 | 4.25±0.1 | 0.39±0.02 | 0.49±0.01 |
| C. gigantea | 2.42±0.48 | 49.42±0.2 | 0.26±0.01 | 0.41±0.01 |
| E. hirta | 12.54±0.22 | ND | ND | 0.72±0.03 |
| O. sanctum | 10.00±0.05 | 31.28±0.1 | 0.08±0.01 | 0.95±0.05 |
| P. betel | 12.96±0.12 | 32.84±0.1 | 0.18±0.02 | 0.62±0.02 |
| S. cumini | 9.50±0.32 | 96.52±0.2 | 0.03±0.01 | 0.82±0.03 |
| T. procumbens | 15.22±0.24 | 32.96±0.2 | 0.42±0.02 | 0.22±0.02 |
All the values are an average of five determinations and expressed as mean ± S.D
Catalase promotes wound healing through the degradation of hydrogen peroxide to oxygen and water. This specific action protects cell structure during the primary inflammatory reaction of wound healing. Among the eight plants, the highest activity of catalase was observed in A. vera (98.86 units/mg protein) and S. cumini (96.52 units / mg protein) where as lowest activity was observed in A. indica (4.25 units /mg protein). The activity is almost two times observed to be lower in C.gigantea, P. betel, T. procumbance, O. sanctum but the activity was not detected in the leaf extract of E. hitra. Catalase activity has been reported to exist in many medicinal plants such as Spinach and Caster bean17. Peroxidase activity was found to be very high in A. indica (0.39 units/mg protein) and T.procumbance (0.42 units/mg protein). However, the activity in other plant extracts in the present study ranges from 0.03 to 0.26 units/mg protein. The peroxidase activity was reported to be as 2.31 units/mg protein in Chinese cabbage32.
Ascorbic acid oxidase activity was highest in O. sanctum (0.95units/mg protein) and S. cumini (0.82 units/mg protein). The predominant ascorbic acid oxidase activity in O. sanctum and S. cumini is associated with high SOD activity and low activity of catalase, peroxidase emphasizing the importance ascorbate system in these plants. Ernesto et al., reported that the ascorbic acid oxidase activity of squash fruits and pepper fruit are 3.32 and 0.143 units/ µg protein respectively7.
Non-enzymatic antioxidants
The concentration of different non-enzymatic antioxidants in different medicinal plants was also assessed and the results are represented in Table 2. Reduced glutathione was found to be maximum in O. sanctum (563.57 nM/g tissue), while in S. cumini and E. hitra, it ranges from 380-480 nM/ g tissue. GSH level of A. India was low about two times when compared to that of O. sanctum. GSH levels of Allium giganteum was reported to be 8.35 units / mg protein and Grapes was 628nM/ g tissue 22, 29. In plants the role of glutathione as radical scavenger, membrane stabilizer and precursor of heavy metal binding peptide are well documented 18, 23. Vitamin C content was very low in C. gigantean (0.42mg/g tissue, where as in S. cumini and O. sanctum its concentration ranges from 25-47 mg / g tissue. Ascorbic acid has found in the chloroplast, cytosol, vacuole and extracellular compartments of the plant cells and shown to function as a reductant for many free radicals8.
Table 2: Non-enzymatic antioxidant potentials of selected medicinal plants.
| Plant extract | Reduced glutathione
(nM/ g tissue) |
Ascorbic acid ( mg/ g tissue) | Total phenolics (mg GAE/g tissue) |
| A. vera | 246.2±0.4 | 41.62±0.1 | 1.15±0.02 |
| A. indica | 279.42±0. 65 | 34.32±0.3 | 1.19±0.02 |
| C. gigantea | 182.86±0.41 | 0.42±0.1 | 0.32±0.01 |
| E. hirta | 480.78±0.22 | 26.09±0.4 | 1.45±0.04 |
| O. sanctum | 563.96±0.34 | 47.32±0.2 | 1.48±0.02 |
| P. betel | 364.16±0.12 | 1.70±0.1 | 0.48±0.02 |
| S. cumini | 381.50±0.35 | 24.42±0.2 | 1.23±0.01 |
| T. procumbens | 334.82±0.24 | 0.58±0.1 | 1.42±0.02 |
All the values are an average of five determinations and expressed as mean ± S.D
The total phenolic contents varied considerably with the highest value reported in E. hirta (1.5 mg GAE/ g tissue) where as lowest amount was observed in C. gigantean (0.32 mg GAE/ g tissue). Variation in total phenolic content was seen in S. cumini (1.2 mg GAE/ g tissue ), A. indica (1.1 mg GAE/ g tissue and A. vera (1.0 mg GAE/ g tissue ). However, the total phenolic content of some medicinal plants are in the range of 29.0 to 59.9 mg GAE / g tissue 21.
In vitro lipid peroxidation
The effect of different medicinal plant extracts on the in vitro lipid peroxidation was shown in the table 3. The results indicate that the generation of lipid peroxides by Fe2+ in sheep liver homogenate seems to be inhibited by all the plant extracts of the present study. The percent of inhibition was highest with O. sanctum (66.4), E. hirta (62.08) and T. procumbens (58.22). The high percent of inhibition with O. sanctum may be due to glutathione and vitamin C content, whereas with E. hirta it may be due to high phenolic content. The percent of inhibition was lowest with C. gigantean (28.06) andP. betel (32.18). The concentration of extract required to inhibition 50% of lipid peroxidation (IC50) was lowest with O. sanctum (58µg/ml) and highest with C. gigantean (90 µg/ml). These results indicate that extract of O. sanctum was more potent than that of other plant extracts in lipid peroxidation.
 |
Table 3: Effect of selected medicinal plant extracts on lipid peroxidation.
|
All the values are an average of five determinations and expressed as mean ± S.D. IC50 value are calculated using regression line analysis.
In the present study, among the enzymatic antioxidants studied in medicinal plants, SOD and catalase in A. vera and peroxidase in A. indica were predominant. Among the non-enzymatic antioxidants studied in medicinal plants, reduced glutathione and vitamin C inO. sanctum, total phenolic in E. hirta were predominant. The ability of extracts of these medicinal plants in curtailing the in vitro lipid peroxidation of sheep liver homogenate can be attributed to the presence of various enzymatic and non-enzymatic oxidants in these plant extracts. The present study clearly points out that these medicinal plants could be exploited for commercial purification of specific antioxidants, since they are available in abundance.
Acknowledgements
Dr. Rama Rao M and co-authors are grateful to the management, Gitam institute of Science, Gitam University for providing facilities to carryout this investigation.
References
- Akanksha M., Mrinal M. B., Jai C. T. Thomas P. A. D. (2006). Antioxidant activity of Garcinia indica (kokam) and its syrup. Current science, 91 (1): 10.
- Bast A., Haenen G.R., Doelman G.J. (1991). Oxidants and anti Oxidants. State of the art. J. Med., 30: 2S-13S.
- BoyneF., Ellman G.L. (1972). A methodology for analysis of tissue sulfhydryl components. Anal. Biochem., 46: 639-53.
- Chopra R. N., Nayar S. L., Chopra C. (1986). Glossary of Indian Medicinal Plants (Including the Supplement). Council of Scientific and Industrial Research, New Delhi.
- David Elymn. H. (1982). Titrimetric determination of ascorbic acid with 2,6-dichlorophenol indophenol in commercial liquid diets, Journal of Pharmaceutical Sciences, 72 (2 ):126 – 129.
- Dharamainder C., Raosaheb K. K. (2002). Antioxidant and non-toxic properties of Piper betle leaf extract: in vitro and in vivo studies, Phytotherapy Research, 16(5), 461-466.
- Ernesto G.P., Elda M., Edmundo L. G. (2004). Gene expression and enzyme activity of pepper (Capsicum annuum L.) ascorbate oxidase during elicitor and wounding stress. Plant Sciences, 166 (1): 237-243.
- Foyer (1993). Ascorbic acid. In: Antioxidants in higher plants. Eds. Alscher, R.G. and Hess. J.L. CRL Press, Boca Raton, pp 31-58.
- Janeway A. , Travers P. (1994). Immuno biology. The immune system in health and disease (Current Biology Ltd. / Black scientific /Garland publishers, New york).
- Javanmardi J. Stushnoff C., Locke E., Vivanco M. (2003). Antioxidant activity and total phenolic content of Iranian Ocimum accessions. Food chemistry, 83 : 547-550.
- Kausik B., Chattopadhyay , Ranajit K. B., Bandyopadhyay U. (2002). Biological activities and medicinal properties of neem. Current Science, 82 (11): 10.
- Lowry O. H., Rosebrough N. J., Farr A. L. , Randall R. J., (1951). Biol. Chem, 193 265.
- Mahpara S., Alam K., Habibullah (2006). Effect of Jaman Fruit Extract on Serum Glucose and Lipid Profile in Type 2 Diabetic Individuals, Pakistan Journal of Nutrition, 5 (6): 573-576.
- Mária T., Klára S., Ágnes S., Ilona S. V. (2003). Examination on antioxidant activity in the greater celandine (Chelidonium majus) extracts by FRAP method, Acta Biologica Szegediensis, 47:115-117.
- Mc Cord J.M., Fridovich (1969). Spectrophotometric assay of superoxide dismutase activity. J. Biol. Chem., 244: 6049-6055.
- Ohkawa H., Onishi N., Yagi K. (1979). Assay of lipid peroxidation in animal tissues by thiobarbituric acid reaction, Anal Biochem., 95: 359
- Ota Y., Takeshi A., Koji H., Tsuyosh N., Tsuyosh , Masayoshi M., Tadashi A. (1992). Tissue specific isoforms of catalase subunit in Castor bean seedling. Plant cell Physiol., 33:225
- Price A., Lucas P.W., Lea D.J. (1990). Age dependent damage and glutathione metabolism in ozone fumigated barley: A leaf section approach. Exp. Bot., 41: 1309-1317.
- Prieto P., Prenda M., Aguilar M. (1999). Spectrophotometric quantification of antioxidant capacity though the formation of a phosphomolybdenum complex: Specific application to the determination of vitamin E. Biochem., 269:337-341.
- Radhakrishnan T.M., Sarma P.S. (1963). Intracellular localization and biosynthesis of catalase in liver sittues, Sci. 32: 1749.
- Rama Rao M., Bhaskar Reddy , Ramana T. (2006). Antimicrobial Activity of Some Indian Medicinal Plants, Indian Journal of Microbiology, 46 (2): 191-195.
- Rani P., Meena , Kartikeyan J. (2004). Evaluation of antioxidant properties of berries, Indian J. Clin. Biochem., 19(2): 103-110.
- Ruegsegger A., Schmuttz D., Brund C. (1990). Regulation of glutathione biosynthesis by cadmium in pisum sativum. Plant physiol., 93: 1579-1584.
- Sabari D., Dinesh Y., Rajiv N., Nibhriti D. (2002) Interrelationship between lipid peroxidation, ascorbic acid and superoxide dismutase in coronary artery disease, Current science, 83 (4): 25.
- Salahdeen H. M., Yemitan O.K., Alada A.R.A. (2004). Effect of aqueous leaf extract of Tridax procumbance on blood pressure and heart rate in rats, African Journal of Biomedical Research, 7: 27 – 29.
- Satyavati V., Gupta A.K., Tandon N. (1987). Medicinal plants of india, 2:Pp 1.
- Seevers P.M., Daly J.M.J.M., Catedral F.F. (1971). The role of peroxidase Isoenzymes in resisitance to Wheat stem rust disease. Plant Physiol., 48: 353-356.
- Shelton M. (1991). Aloe vera, its chemical and therapeutic properties. International journal of dermatology, 30: 679-683.
- Štajner, Milić-Demarino N., Čanadanović-Brunet J., Štajner M,. Popović B.M. (2006). Screening for antioxidant properties of Allium giganteum. Fitoterapia,
77(4): 268-270. - Vines H.M., Oberbacher F. (1965). Response of oxidation and phosphorylation in citrus mitochondria to arsenate. Nature. 206: 319-320.
- Vladimir R. M. (2001). Antioxidants & Redox Signaling., 3(1): 39-62.
- Wang M.H., Lee S.Y. , Rhee H.I. (1999). Properties of anionic peroxidase purified from Chinese cabbage roots. Plant physiol. and Biochem., 37:459.
- Warrier P.K., Nambiar V.P.K, Mankutty C. (1994). Indian Medicinal Plants. Orient Longman; Chennai, India 341-345.
- Wim V. C., Chris B., Raimundo V., Ed W.T. T., Marc V. M., Dirk I. (1990). “Characterization of iron superoxide dismutase cDNAs from plants obtained by genetic complementation in Escherichia coli”; Proceedings of the National Academy of Sciences of the United States of America, 87: 9903-9907.

