
Manuscript accepted on :August 19, 2008
Published online on: --
Plagiarism Check: Yes
S.M. Habibi-Khorassani*, A. Ebrahimi, M. T. Maghsoodlou and M. A. Kazemian
Department of Chemistry, University of Sistan and Baluchestan.
Abstract
The major objectives of the work undertaken were to carry out kinetic studies of the reaction between triphenylphosphine, dialkyl acetylenedicarboxylates in the presence of NH-acid, such as benzoxazoline. To determine the kinetic parameters of the reaction, it was monitored by UV spectrophotometery. The second order fits were automatically drawn and the values of the second order rate constant (k2) were calculated using standard equations within the program. At the temperature range studied the dependence of the second order rate constant (ln k2) on reciprocal temperature was in a good agreement with Arrhenius equation. This provided the relevant plots to calculate the activation energy of all reactions. Furthermore, useful information were obtained from studies of the effect of solvent, structure of reactants (different alkyl groups within the dialkyl acetylenedicarboxylates and NH-acids) and also concentration of reactants on the rate of reactions. Proposed mechanism was confirmed according to the obtained results and steady state approximation and first step (k2) of reaction was recognized as a rate determining step on the basis of experimental data. In addition, assignment of more stabe isomers (Z or E) was investigated using the AIM theory.
Keywords
Triphenylphosphine; UV spectrophotometry; Kinetic parameters; Geometrical isome
Download this article as:| Copy the following to cite this article: Habibi-Khorassani S. M, Ebrahimi A, Maghsoodlou M. T, Kazemian M. A. Biologically Active Benzoxazolinone in Reaction with Triphenylphosphine, Dialkyl Acetylenedicarboxilates and Theoretical Study on the Kinetic and Mechanism Investigation of the Reactions. Biomed Pharmacol J 2008;1(1). |
| Copy the following to cite this URL: Habibi-Khorassani S. M, Ebrahimi A, Maghsoodlou M. T, Kazemian M. A. Biologically Active Benzoxazolinone in Reaction with Triphenylphosphine, Dialkyl Acetylenedicarboxilates and Theoretical Study on the Kinetic and Mechanism Investigation of the Reactions. Biomed Pharmacol J 2008;1(1). Available from: http://biomedpharmajournal.org/?p=186 |
Introduction
Phosphorus ylides are reactive systems, which take part in many valuable reactions of organic synthesis.1-11 These are most often obtained in excellent yields from the 1:1:1 addition reaction between triphenylphosphine, dialkyl acetylenedicarboxylates, in the presence of CH, SH or NH-acids12-19. A facile synthesis of the reaction between triphenylphosphine 1, dialkyl acetylene dicarboxylates 2 and benzoxazoline 3 (as a NH-acid) has been earlier reported 20 (see Scheme 1) but the kinetic study of this reaction has not been investigated previously. Benzoxazolinone was recently employed in the synthesis of new arylpiperazine derivatives with pharmacological results when systematic modifications were made in the amide part of this molecule. With respect to the importance of mentioned pharmacophore group proprety of benzoxazolinone21-22 and in order to gain further insight into the above reaction mechanism, herein a kinetic study of the reactions was undertaken by UV spectrophotometer technique. Numerous kinetic investigations over a large area of different reactions have been previously reported using the UV instrument.23-29 On the basis of the well established chemistry of trivalent phosphorus nucleophiles30-34, it is reasonable to assume that phosphorus ylide 4 results from the initial addition of triphenylphosphine to the acetylenic ester 2 (2a, 2b or 2c) (rate constant k2) and subsequent protonation of the 1:1 adduct by the NH-acids 3 (rate constant k3) to form phosphoranes 4 (4a, 4b, 4c) (rate constant k4) (Scheme 1 and 2). Also atoms in molecules (AIM) analysis 35 at HF/6-31G level of theory have been performed for determination of both conformer’s stability [E-4(a, c) and Z-4 (a, c)] of phosphorus ylides (See Scheme 1).
Experimental procedures
Chemicals and apparatus used: Dialkyl acetylenedicarboxylates, triphenylphosphine and benzoxazoline were purchased from Fulka (Buchs, Switzerland) and used without further purifications. All extra pure solvents including the 1,2-dichloroethane, ethyl acetate and 1,4-dioxane e also obtained from Merk (Darmstadt, Germany). A Cary UV/Vis spectrophotometer model Bio-300 with a 10 mm light-path black quartz spectrophotometer cell was employed throughout the current work.
Methods
First, it was necessary to find the appropriate wavelength in order to follow the kinetic study of the reaction. For this purpose, in the first experiment, 1×10⁻³M solutions of compounds 1, 2c and 3 have been prepared in 1,4-dioxane e as solvent. Approximately 3 mL aliquot from each reactant was pipetted into a 10 mm light path quartz spectrophotometer cell and then was placed in the UV spectrometer. The relevant spectra were recorded over the wavelengths range 190-400 nm. Figures 1, 2 and 3 show the ultraviolet spectra of compounds 1, 2c and 3, respectively.
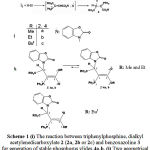 |
Scheme 1: (i) The reaction between triphenylphosphine, dialkyl acetylenedicarboxylate 2 (2a, 2b or 2c) and benzoxazoline 3 for generation of stable phosphorus ylides 4a-b. (j) Two geometrical isomers (Major and Minor) of stable phosphorus ylides 4a-b involving benzoxazoline. (k) Only one geometrical isomer (Major) of stable phosphorus ylides (Z-4c). |
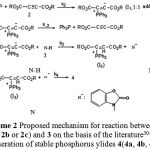 |
Scheme 2: Proposed mechanism for reaction between 1, 2(2a, 2b or 2c) and 3 on the basis of the literature30-34 for generation of stable phosphorus ylides 4(4a, 4b, 4c). |
In the second experiment, first 1mL aliquot from the 3×10⁻³M solutions of compound 1, 3 were pipetted into a quartz spectrophotometer cell (because there is no reaction between them), later 1mL aliquot of 3×10⁻³M solution of reactant 2c was added to the mixture (It is important to remember that in the present work the concentration of each reactant in the quartz spectrophotometer cell is a third (i.e 1/3×3×10-3M) of the initial concentration (3×10⁻³M)). The reaction monitored by recording scans
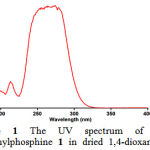 |
Figure 1: The UV spectrum of 10-3M triphenylphosphine 1 in dried 1,4-dioxane .
|
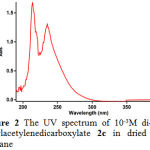 |
Figure 2: The UV spectrum of 10-3M di-tert-butylacetylenedicarboxylate 2c in dried 1,4-dioxane .
|
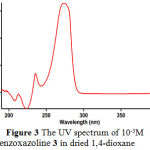 |
Figure 3: The UV spectrum of 10-3M benzoxazoline 3 in dried 1,4-dioxane
|
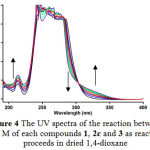 |
Figure 4: The UV spectra of the reaction between 10-3 M of each compounds 1, 2c and 3 as reaction proceeds in dried 1,4-dioxane.
|
of the entire spectra every 6 min over the whole reaction time at ambient temperature. The ultra-violet spectra shown in Figure 4 are typical. As can be seen from this Figure, the appropriate wavelength can be chosen 330 nm (corresponding mainly to compound 4c (product) as shown in Figure 4). At this wavelength, compounds 1, 2c and 3 have relatively no absorbance value. This provided good opportunity in order to fully investigate the kinetic of the reaction between triphenylphosphine 1, di-tert-butylacetylene-dicarboxylate 2c and benzoxazoline 3 at 330 nm in the presence of 1,4-dioxane e as solvent. Since the spectrophotometer cell of the UV equipment had a 10 mm light-path cuvette, the UV/Vis spectra of compound 4c was measured over the concentrations range (10-3M ≤ M4c ≤ 2×10⁻⁴M) to check a linear relationship between absorbance values and concentrations. Figure 5 shows a linear relationship between concentration and absorbance for the UV/Vis spectra of compound 4c in 1,4-dioxane . Therefore, the UV/Vis experiments may be carried out over this concentrations range. With respect to the obtained concentrations range and identification of suitable wavelength in preliminary investigations it seems that practical conditions have been found to allow an investigation of the kinetic of reaction between triphenylphosphie 1, di-tert-butylacetylenedicarboxylte 2c and benzoxazoline 3 by the UV/Vis spectrophotometry technique. This will be discussed according to the following procedure.
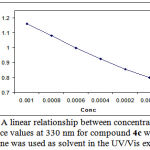 |
Figure 5: A linear relationship between concentrations and absorbance values at 330 nm for compound 4c when dried 1,4-dioxane was used as solvent in the UV/Vis experiment.
|
For each kinetic experiment, first 1mL aliquot from freshly made solution of 3×10⁻³M compounds 1 and 3 in dried 1,4-dioxane e was pipetted into a quartz cell and then 1mL aliquot of 3×10⁻³M solution of reactant 2c was added to the mixture, keeping the temperature at 15 ºC and the reaction kinetics were followed via UV absorbance against time measurement. The cuvette was then place in the UV spectrophotometer, keeping the temperature at 15.0ºC. The wavelength chosen was 330 nm as described previously and the reaction kinetics was followed via UV absorbance against time measurement. Figure 7 shows the absorbance change versus time for the 1:1:1 addition reaction between compounds 1, 2c and 3. Also Figure 6 illustrates the expanded section wavelengths region (295-385 nm) of UV spectra of reaction mixture as reaction proceeds. The Infinity absorbance (A∞) that is the absorbance at reaction completion, can be obtained from Figure 7 at t =110 min.
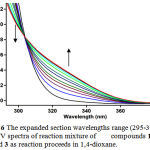 |
Figure 6: The expanded section wavelengths range (295-385 nm) of UV spectra of reaction mixture of compounds 1, 2c and 3 as reaction proceeds in 1,4-dioxane.
|
With respect to this value, zero and first or second curve fitting could be automatically drawn for the reaction by the software36 which uses the chosen value of infinity absorbance (A∞) to generate the absorbance curve (full line). Assuming second order kinetic and using the original experimental absorbance versus time data provides a second order fit curve (full line) which exactly fits the experimental curve (dotted line) as shown in Figure 8. Thus the reaction between triphenylphosphine 1, di-tert-butylacetylenedicarboxylate 2c and 3 follows second-order kinetic. The second order rate constant (k2) is then automatically calculated using standard equation36 within the program at 15.0ºC. It is reported in Table 1.
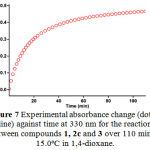 |
Figure 7: Experimental absorbance change (dotted line) against time at 330 nm for the reaction between compounds 1, 2c and 3 over 110 min at 15.0ºC in 1,4-dioxane.
|
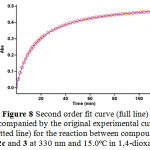 |
Figure 8: Second order fit curve (full line) accompanied by the original experimental curve (dotted line) for the reaction between compounds 1, 2c and 3 at 330 nm and 15.0ºC in 1,4-dioxane.
|
Table 1: The values of second order rate constants for the reaction between compounds 1, 2c and 3 at 330 nm and different temperature in 1,4-dioxane .
| k /M.min-1 | t / ºC |
| 71.5 | 15.0 |
| 89.0 | 20.0 |
| 106.2 | 25.0 |
| 132.4 | 30.0 |
Result and discussion
Effect of temperature
As can be seen from the Table 1, the rate of reaction is accelerated when the reaction is followed at higher temperature. In the temperature range studied, the dependence of the second-order rate constant of the mentioned reaction on reciprocal temperature is consistent with the Arrhenius equation. This behavior is shown in Figure 9. The activation energy of reaction (29.4 kJ/mol) was obtained from the slop of this Figure.
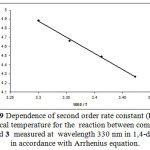 |
Figure 9: Dependence of second order rate constant (Ln k) on reciprocal temperature for the reaction between compounds 1, 2c and 3 measured at wavelength 330 nm in 1,4-dioxane e in accordance with Arrhenius equation.
|
Effect of solvents
To determine the effect of change in solvent environment on the rate of reaction, ethyl acetate was chosen as suitable solvent which not only could be dissolved all compounds (1, 2c and 3) but also does not react with them. The effects of solvents on the rate constant are given in Table 2. As can be seen from this table, the rate of reaction in each solvent was increased with increasing temperature. In addition, the rate of reaction between compounds 1, 2c and 3 was accelerate in a high dielectric constant environment (1,2-dichloroethane) in comparison with a low dielectric constant environment (ethyl acetate and 1,4-dioxane ) at all temperature investigated.
Table 2: The values of second order rate constant for the reaction between compounds 1, 2c and 3 in the presence of solvents such as 1,2-dichloroethane, ethyl acetate and 1,4-dioxane e at all temperatures investigated.
| k2/M.min-1
——————————————————————————–15.0ºC 20.0ºC 25.0ºC 30.0ºC |
ε | solvent |
| 108.2 137.1 173.6 221.3 | 10 | 1,2-dichloroethane |
| 85.5 105.2 130.1 161.4 | 6.02 | Ethyl acetate |
| 71.5 89.0 106.2 132.4 | 2.2 | 1,4-dioxane |
Effect of concentration
To determine reaction order with respect to triphenylphosphine 1 and dialkyl acetylene-dicarboxylate 2 (2c), in the continuation of experiments, all kinetic studies were carried out in the presence of excess 3. Under this condition, the rate equation may therefore be expressed as:
![]()
In this case (3×10⁻² M of 3 instead of 3×10⁻³ M) using the original experimental absorbance versus time data provides a second order fit curve (full line) against time at 330 nm which exactly fits the experimental curve (Figure 10). The value of rate constant was the same as that of obtained from the previous experiment (3×10⁻³ M). Repetition of the experiments with 5×10⁻²M and 7×10⁻²M of 3 gave, separately, the same fit curve and rate constant. In fact, the experimental data indicated that the observed pseudo second order rate constant (kobs) was equal to the second order rate constant (k2), this is possible when γ is zero in equation (I). It is appears, therefore, that the reaction is zero and second order with respect to 3 (NH-acid) and the sum of 1 and 2 (2a) (α + β = 2), respectively.
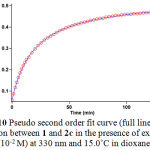 |
Figure 10: Pseudo second order fit curve (full line) for the reaction between 1 and 2c in the presence of excess 3 (10-2 M) at 330 nm and 15.0˚C in dioxane.
|
To determine reaction order with respect to dialkyl acetylenedicarboxylate 2 (2c), the continuation of experiment was performed in the presence of excess of 1 (rate = k΄obs [3]γ [2]β, k΄obs = k2 [1]α (II)). The original experimental absorbance versus time data and provide a pseudo first order fit curve at 330 nm, which exactly fits the experimental curve (dotted line) as shown in Figure 11.
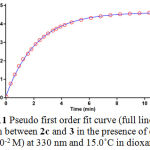 |
Figure 11: Pseudo first order fit curve (full line) for the reaction between 2c and 3 in the presence of excess 1 (10-2 M) at 330 nm and 15.0˚C in dioxane.
|
As a result since γ = 0 (as determined previously), it is reasonable to accept that the reaction is first order with respect to compound 2 (2c) (β = 1). Because the overall order of reaction is 2 (α + β + γ = 2) it is obvious that α = 1 and order of triphenylphosphine 1 must be equal to one. This observation was obtained also for reactions between (1, 2b and 3) and (1, 2a and 3). Based on the above results, a simplified proposed reaction mechanism is shown in Figure 12.
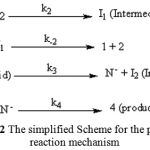 |
Figure 12: The simplified Scheme for the proposed reaction mechanism |
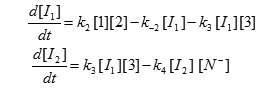
The experimental results indicate that the third step (rate constant k3) is possibly fast. In contrast, it may be assumed that the third step is the rate determining step for the proposed mechanism. In this case the rate law can be expressed as follows:
![]()
The steady state assumption can be employed for [I1] which is generated following equation,
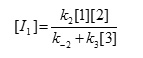
The value of [I1] can be replaced in equation (III) to obtain this equation:
Since it was assumed that k3 is relevant to the rate determining step, it is reasonable to make the following assumption: k-2 >> k3 [3]
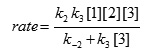
so the rate of low becomes:
![]()
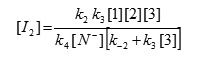
The final equation is indicates that overall order of reaction is three which is not compatible with experimental overall order of reaction (=two). In addition, according to this equation, the order of reaction with respect to benzoxazolinone 3 is one, whereas it was actually shown to be equal to zero. For this reason, it appeared that the third step is fast. If we assume that the fourth step (rate constant k4) is the rate-determining step for the proposed mechanism, in this case, there are two ionic species to consider in the rate determining step, namely phosphonium ion (I2) and benzoxazolinone ion (N–). The phosphonium and benzoxazolinone ions, as we see in Figure 3, have full positive and negative charges and form very powerful ion- dipole bonds to the ethyl acetate, the high dielectric constant solvent. However, the transition state for the reaction between two ions carries a dispersed charge, which here is divided between the attacking benzoxazolinone and the phosphonium ions. Bonding of solvent (ethyl acetate) to this dispersed charge would be much weaker than to the concentrated charge of benzoxazolinone and phosphonium ions. The solvent thus stabilize the species ions more than it would the transition state, and therefore Ea would be higher, slowing down the reaction. However, in practice, ethyl acetate speeds up the reaction and for this reason, the fourth step, which is independent of the change in the solvent medium, could not be the rate determining step. Furthermore, the rate law of formation of the product (fourth step) for a proposed reaction mechanism with application of steady state assumption can be expressed by:
rate = k4[I2][N–]
By application of steady state for [I–] and [N–], and replacement of their values in the above equation, the following equation is obtained:

This equation is independent of rate constant for the fourth step (k4) and shows why the fourth step would not be affected by a change in the solvent medium. In addition, it has been suggested earlier that the kinetics of ionic species‘ phenomena (e.g., the fourth step) are very fast.37-38 If the first step (rate constant k2) were the rate determining step, in this case, two reactants (triphenylphosphine 1 and dialkyl acetylenedicarboxylate 2), as we see in Figure 2, have no charge and could not form strong ion-dipole bonds to the high dielectric constant solvent, ethyl acetate. However, the transition state carries a dispersed charge which here is divided between the attacking 1 and 2 and, hence, bonding of solvent to this dispersed charge is much stronger than the reactants, which lack charge. The solvent thus stabilizes the transition state more than it does the reactants and, therefore, Ea is reduced which speeds up the reaction. Our experimental results show that the solvent with higher dielectric constant exerts a power full effect on the rate of reaction (in fact, the first step has rate constant k2 in the proposed mechanism) but the opposite occurs with the solvent of lower dielectric constant (Mix 50/50% of n-hexane and ethyl acetate, see tables 2, 3 and 4). The results of the current work (effects of solvent and concentration of compounds) have provided useful evidence for steps 1 (k2), 3 (k3) and 4 (k4) of the reactions between triphenylphosphine 1, dialkyl acetylenedicarboxylate 2 (2a, 2b or 2c) and benzoxazolinone 3. Two steps involving 3 and 4 are not determining, although the discussed effects, taken altogether, are compatible with first step (k2) of the proposed mechanism and would allow it to be the rate-determining step. However, a good kinetic description of the experimental result using a mechanistic scheme based upon the steady state approximation is frequently taken as evidence of its validity. By application of this, the rate formation of product 4 from the reaction mechanism (Figure 12) is given by:
 We can apply the steady-state approximation to [I1] and [I2];
To obtain a suitable expression for [I2] to put into equation (V) we can assume that, after an initial brief period, the concentration of [I1] and [I2] achieve a steady state with their rates of formation and rates of disappearance just balanced. Therefore
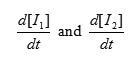
and are zero and we can obtain expressions for [I2] and [I1] as follows:
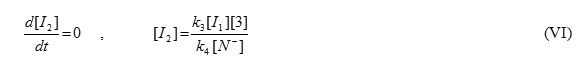
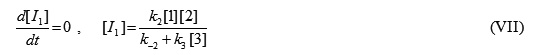
We can now replace [I1] in the equation (VI) to obtain this equation:
The value of [I2] can be put into equation (V) to obtain the rate equation (VIII) for proposed

Since experimental data were indicated that steps 3 (k3) and 4 (k4) are fast but step 1 (k2) is slow, it is therefore reasonable to make the following assumption: k3 [3] >> k-2
so the rate equation becomes:
![]()
This equation which was obtained from a mechanistic scheme (shown in Figure 12) by applying the steady-state approximation is compatible with the results obtained by UV spectrophotometery.
Further kinetic investigations
To confirm the above observations, further experiments were performed with diethyl acetylene- dicarboxylate 2b and dimethyl acetylenedicarboxylate 2a respectively. The original experimental absorbance curves (dotted line) accompanied by the second order fit curves (full line) at 330 nm for only two reactions between 1, 2b and 3 and also 1, 2a and 3 are illustrated in Figures 13-14, respectively. The value of the second-order rate constants (k2) for this reactions between 1, 2b and 3 and also 1, 2a and 3 are reported in Tables 3 and 4, respectively.
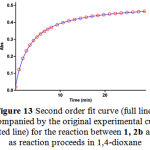 |
Figure 13: Second order fit curve (full line) accompanied by the original experimental curve (dotted line) for the reaction between 1, 2b and 3 as reaction proceeds in 1,4-dioxane .
|
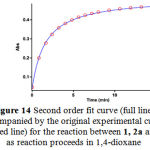 |
Figure 14: Second order fit curve (full line) accompanied by the original experimental curve (dotted line) for the reaction between 1, 2a and 3 as reaction proceeds in 1,4-dioxane .
|
Table 3: The values of second order rate constant for the reaction between 1, 2b and 3 in the presence of solvents such as 1,2-dichloroethane, ethyl acetate and 1,4-dioxane e respectively at all temperatures investigated.
| k2/M.min-1
——————————————————————————— 15.0 ºC 20.0ºC 25.0ºC 30ºC |
ε | solvent |
| 531.1 593.3 671.4 767.1 | 10 | 1,2-dichloroethane |
| 378.2 423.8 475.7 539.3 | 6.02 | Ethyl acetate |
| 262.9 294.0 326.9 370.3 | 2.2 | 1,4-dioxane |
Table 4: The values of second order rate constant for the reaction between 1, 2a and 3 in the resence of solvents such as 1,2-dichloroethane, ethyl acetate and 1,4-dioxane e respectively at all temperatures investigated.
| k2/M.min-1
——————————————————————————— 15.0 ºC 20.0ºC 25.0ºC 30.0ºC |
ε | solvent |
| b b b b | 10 | 1,2-dichloroethane |
| 542.7 604.5 678.3 765.2 | 6.02 | Ethyl acetate |
| 390.0 412.5 465.6 519.1 | 2.2 | 1,4-dioxane |
[b] Under these conditions, the rate of reactions were so quick. To obtain better and reproducible results it was suggested to follow kinetic investigation of reactions by Stopped-Flow spectrophotometry
As can bee seen from the Tables 3 and 4 the behavior of diethyl acetylenedicarboxylate 2b and dimethyl acetylenedicarboxylate 2a are as same as the di-tert-butylacetylenedicarboxylate 2c (Table 2) with respect to the reaction with triphenylphosphine 1 and benzoxazoline 3. The rate of both recent reactions were also accelerated in high dielectric constant environment and high temperature, nevertheless the rate of them are approximately 4 to 9 time greater than the reaction with di-tert-butylacetylenedicarboxylate 2c. It seems that steric and bulky groups within the structure of dialky acetylenedicarboxylate would tend to reduce the rate of overall reactions. These results are illustrated in Table 5 for three reactions at appropriate wavelength and 15.0ºC, 20.0ºC, 25.0ºC and 30.0ºC in the presence of solvent such as 1,4-dioxane .
Table 5: The effect of alkyl groups within the structure of dialkyl acetylenedicarboxylates on the rate of reactions between compounds (1, 2a and 3), (1, 2b and 3) and also (1, 2c and 3) in 1,4-dioxane .
| k2/M.min-1
————————————————————————- 15.0ºC 20.0ºC 25.0ºC 0.0ºC |
λ/nm |
Product |
Reaction |
| 542.7 604.5 678.3 765.2 | 330 | 4a | 1, 2a and 3 |
| 378.2 443.8 508.8 581.3 | 330 | 4b | 1, 2b and 3 |
| 71.5 89.0 106.2 132.4 | 330 | 4c | 1, 2c and 3 |
This observation are also obtained for 1,2-dichloroethane and ethyl acetate (see Tables 2, 3 and 4).
Theoretical study
Recently, different reports have been published on the synthesis of stable phosphorus ylides from the reaction between triphenylphosphine and reactive acetylenic esters in the presence of N-H, C-H or S-H heterocyclic compounds. These ylides usually exist as a mixture of two geometrical isomers, although some ylides like compound 4c (recent work) exhibit one geometrical isomer. It is important to remember that in medicinal chemistry sometimes only one of the two geometrical isomers shows biological and pharmacological activity. For this reason quantum mechanical calculations have been performed in order to gain a better understanding of most important geometrical parameters and also relative energies of both geometrical isomers in the case of ylides 4a as the two geometrical isomers (E-4a and Z-4a) and 4c as the only one geometrical isomer (Z-4c)
Calculations
Structure and stabilities
In order to determine more stable form of both geometrical isomers [Z-4(a, c) or E-4(a, c)] of ylides (4a or 4c), first their structures were optimized at HF/6-31G level of theory 39 by Gaussian 98 program package.40 Also relative energy of the two rotamers has been calculated at HF/6-31G and B3LYP/6-311++G (d,p) levels (See Figures 15 and 16). The relative stabilization energies for both [Z-4(a, d) or E-4(a, d)] isomers are reported in Table 6, as can be seen, E-4a and Z-4c conformers are more stable than Z-4a and E-4c forms (0.9479 and 1.5435 kcal/mol respectively) at B3LYP level.
Table 6: The relative energy (kcal/mol) for both Z and E isomers of ylides 4a and 4c, obtained as HF/6-31G and B3LYP/6-311++G(d,p) levels.
| conformer | HF | B3LYP |
| Z-4a | 1.4930 | 0.9479 |
| E-4a | 0.0000 | 0.0000 |
| Z-4c | 0.0000 | 0.0000 |
| E-4c | 3.4628 | 1.5435 |
Further investigation was undertaken in order to determine more effective factors on stability of both isomers, hence natural population analysis (NPA)41 was made on obtained wave functions based upon AIM calculations42 at HF/6-31G level of theory by the AIM2000 program package.43 In recent years the AIM theory is often applied in the analysis of H-bonds. In this theory, the topological properties of the electron density distribution are derived from the gradient vector field of the electron density Ñr(r) and on the Laplacian of the electron density Ñ2r(r). The Laplacian of the electron density, Ñ2r(r), identifies regions of space wherein the electronic charge is locally depleted [Ñ2r(r) > 0] or built up [Ñ2r(r) < 0]42. Two interacting atoms in a molecule form a critical point in the electron density, where Ñr(r) = 0; called the bond critical point (BCP). The values of the charge density and its Laplacian at these critical points give useful information regarding the strength of the H-bonds44. The ranges of r(r) and Ñ2r(r) are 0.002-0.035e/a03 and 0.024-0.139 e/a05, respectively, if H-bonds exist45. With respect to the obtained results using this approach, both numbers of critical points that were attributed to intramolecular hydrogen bonds and their topological properties in (E-4a and Z-4a) and also (E-4c and Z-4c) geometrical isomers are reported in Tables 3 and 4, respectively. Number of hydrogen bonds in both categories (Z-4a and E-4a) and (Z-4c and E-4c) are (6 and 6) and also (15 and 12) respectively. As can be seen, number of hydrogen bonds in both geometrical isomers of ylide 4a (E-4a and Z-4a) are identical so it is easy to make a precise decision for existence of both isomers. In addition, the ranges of their electron densities are in (0.0031 – 0.0141 and 0.0043 – 0.0158 au) and also (0.0005 – 0.0168 and 0.0006 -0.0137 au) respectively. Nevertheless total numbers of intramolecular hydrogen bonds and also average of ρ in Z-4c isomer are more than E-4c (see Table 7 and 8). With respect to the both effective geometrical parameters in later case, Z-4c isomer is more stable one in comparison with the E-4c rotamer.
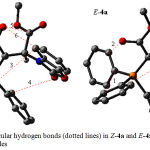 |
Figure 15: Intramolecular hydrogen bonds (dotted lines) in Z-4a and E-4a geometrical isomers of stable ylides.
|
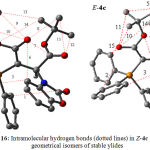 |
Figure 16: Intramolecular hydrogen bonds (dotted lines) in Z-4c and E-4c geometrical isomers of stable ylides.
|
Table 7: The values of r ´10-3 and Ñ2r ´10-3 for both Z-4a and E-4a isomers of ylide 4a calculated at the hydrogen bond critical points. All quantities are in atomic units
| Z-4a | r | Ñ2r | E-4a | r | Ñ2r |
| 1 | 8.686 | -8.017 | 1 | 8.521 | -7.704 |
| 2 | 8.260 | -8.832 | 2 | 13.375 | -12.792 |
| 3 | 3.137 | -2.729 | 3 | 4.317 | -3.769 |
| 4 | 16.193 | -14.361 | 4 | 14.255 | -13.326 |
| 5 | 4.259 | -4.051 | 5 | 4.273 | -3.981 |
| 6 | 14.067 | -13.963 | 6 | 15.803 | -17.081 |
Table 8: The values of r ´10-3 and Ñ2r ´10-3 for both Z-4c and E-4c isomers of ylide 4c calculated at the hydrogen bond critical points. All quantities are in atomic units
| E-4c | r | Ñ2r | Z-4c | r | Ñ2r |
| 1 | – | – | 1 | 4.242 | -4.026 |
| 2 | 8.577 | -7.671 | 2 | 8.690 | -8.176 |
| 3 | 4.326 | -3.812 | 3 | 3.271 | -2.844 |
| 4 | – | – | 4 | 1.893 | -1.592 |
| 5 | 4.047 | -4.034 | 5 | 3.086 | -2.579 |
| 6 | 13.707 | -12.986 | 6 | 16.846 | -14.912 |
| 7 | 12.049 | -13.136 | 7 | 13.277 | -13.344 |
| 8 | – | – | 8 | 5.065 | -5.454 |
| 9 | 11.361 | -11.155 | 9 | 12.363 | -11.928 |
| 10 | 13.027 | -12.423 | 10 | 12.112 | -11.660 |
| 11 | 12.445 | -12.040 | 11 | 11.616 | -11.443 |
| 12 | 9.805 | -9.676 | 12 | 10.321 | -10.131 |
| 13 | 3.133 | -2.947 | 13 | 0.535 | -0.526 |
| 14 | 0.662 | -0.669 | 14 | 1.559 | -1.539 |
| 15 | 12.025 | -11.763 | 15 | 8.326 | -8.919 |
Further investigations were made on the basis of AIM calculations. According to the obtained data, the charges on different atoms of E isomer in both ylides of 4a and 4c (Figures 15&16) are a little bit more than Z form (See Scheme 1 for number of atoms), which are reported in Table 9. With respect to the importance of more total charges on atoms in E isomer of the yield 4a it seems that E-4a isomer is more stable than Z-4a isomer (0.9479kcal/mol), although this difference is taken more in Z-4c isomer (1.5435 kcal/mol) in comparison with E-4c in gas phase.
Table 9: The charges on different atoms for both Z and E isomers in both ylides 4a and 4c calculated by AIM method
| number of atom | Z-4a | E-4a | Z-4c | E-4c |
| C1 | -6.505 ´10-1 | -6.352´10-1 | -6.428´10-1 | -5.804´10-1 |
| C2 | 5.674´10-1 | 5.536´10-1 | 5.643´10-1 | 5.650´10-1 |
| C3 | 1.359 | 1.359 | 1.386 | 1.390 |
| O4 | -1.119 | -1.111 | -1.133 | -1.120 |
| O5 | -1.056 | -1.049 | -1.081 | -1.072 |
| P3 | 2.403 | 2.380 | 2.404 | 2.382 |
On the basis of theoretical calculations (Table 6), the difference between relative stability of E-4a and Z-4a isomers is a little bit (0.9479kcal/mol) in gas phase while it is considerably remarkable in E-4c and Z-4c (1.5435kcal/mol). Perhaps this noticeable difference is taken more in solution media for 4c, for this reason it is possible to observe only one geometrical isomer of 4c (Z or E). Nevertheless, the result is different for 4a (observed as the two geometrical isomers) which may be attributed to the negligible difference in relative stability of Z-4a and E-4a rotamers. In recent case20 (synthesis of both ylides 4a, c), the experimental 1H, 13C, 31P NMR data showed the two geometrical isomers for ylide 4a and also only one geometrical isomer for ylide 4c which are consistent with the obtained result from the theoretical investigations.
Conclusion
Kinetic investigation of the reactions between triphenylphosphin 1, dialkyl acetylenedicaroxylates 2 (2a, 2b or 2c), with benzoxazoline 3 was undertaken by the UV spectrophotometery. The results can be summarized as follow: (1) The appropriate wavelengths and concentrations were successfully determined to follow kinetic investigations. (2) The overall order of all three reactions followed second-order kinetic and order of reaction with respect to triphenylphosphine, dialkyl acetylenedicarboxylate and benzoxazoline were obtained 1, 1 and 0, respectively. (3) The values of second-order rate constant of all reactions were automatically calculated with respect to the standard equation within the software associated with Cary-300 UV equipment. (4) The rate of all reactions were increased in media of higher dielectric constant solvent, this can be related to differences in stabilization of the reactants and the activated complex in transition state by solvent. (5) The more steric factor in bulky alkyl groups accompanied by its more inductive effect within the structure of dialkyl acetylenedicarboxylate would tend to reduce the rate of overall reactions. (6) With respect to the experimental data first step of proposed mechanism was recognized as a rate determining step (k2) and reaction mechanism was confirmed based upon the obtained experimental results and also steady state approximation.(7) Reproductive experiments with different concentrations of NH-acid 3 were indicated that they participate in the fast step of reactions. (8) Under the same conditions, activation energy of the reaction with di-tert-butylacetylene-dicarboxylate (29.4 kJ/mol) was higher than the two reactions which were followed by the diethyl acetylenedicarboxylate (16.4 kJ/mol) and dimethyl acetylenedicarboxylate (14.1 kJ/mol). (9) In addition, the assignment of the Z and E rotomers as a Major or Minor forms in both ylides 4a and 4c was undertaken by AIM method. Quantum mechanical a calculation was clarified how ylide 4a exist in solution as a mixture of two geometrical isomers. These results have also provided useful evidence for the ylide involving 4c. Noticeable differences between the most important geometrical parameters (for instance, relative energy) provide a suitable chance for 4c which appear as a single geometrical isomer (Z)-4c in solution.
Acknowledgments
Authors sincerely thank the University of Sistan & Baluchestan for providing financial support of this work.
References
- Johnson A.W. Ylid Chemistry, Academic Press, New York (1966)
- Cadogan J.I.G. Organophosphorus Reagents in Organic Synthesis, Academic Press, New York (1979).
- Engel R. Synthesis of Carbon-phosphorus Bonds, CRC Press, Boca Raton, FL, (1988)
- Hudson H.R. The Chemistry of Organophosphorus Compounds, Vol. 1, Primery, Secondary and Tretiary Phosphines and Heterocyclic Organophosphorus (III) Compounds, F. R. Hartley (Ed.), pp. 382-472. Wiley, New York (1990)
- Corbridge D.E.C. Phosphorus: An Outline of Chemistry, Biochemistry and Uses, 5th (Ed.), Elsevier, Amsterdam (1995)
- Kolodiazhnyi O.I., Russ. Chem. Rev, 66, 225 (1997)
- Cherkasov R.A. and Pudovik M. A., Russ. Chem. Rev, 63, 1019 (1994)
- Pietrusiewiz K.M. and Zablocka M., Chem. Rev, 94, 1375 (1994)
- Maryanoff B.E. and A. B. Rietz., Chem. Rev, 89, (1989) 863
- Nicolaou K.C., Harter M.W., Gunzner J.L. and Nadin A., Liebigs Ann, 1283 (1997)
- Shen Y. Acc., Chem. Res, 31, 584 (1998)
- Yavari I. and Ramazani A., Phosphorus, Sulphur, and Silicon, 130, 73 (1997)
- Yavari I., Esmaili A. A., Asghari S. and Bijanzadeh H. R., Chem. Res, 368 (1999)
- Yavari I. and Islami M. R., Chem Res, 166 (1998)
- Yavari I. and Bayat M., Phosphorus, Sulphur, and Silicon, 177, 2537 (2002)
- Yavari I., Alizadeh A. and Anary-Abbasinejad M., Tetrahedron Letters, 177 (2002)
- Yavari I., Adib M. and Hojabri L., Tetrahedron, 58, 7213 (2002)
- Yavari I., Alizadeh A. and Anary-Abbasinejad M., Tetrahedron, 43, 9449 (2002)
- Yavari I., Adib M., Jahani-Moghaddam F. and Sayahi M. H., Phosphorus, Sulphur, and Silicon, 177, 545 (2002)
- Maghsoodlou M. T., Hazeri N., Afshari G. and Niroumand U., Phosphorus, Sulphur, and Silicon, 181, 2681 (2006)
- Kowalski P., Kowalska T., Mokrosz M. J., Bojarski A. G. and Charakahieva-Minol S., Molecules, 6, 784 (2001)
- Mokrosz M. J., Kowalski P., Kowalska T., Majka Z., Duszynska B., Bojarski A. J., Fruzinski A., Karolak-Wojciechowska G., Wesolowska A., Klodzinska A., Tatarczynska E. and Chojnacka-Wojcik E., Arch. Pharm.(Wenheim)., 332, 373 (1999)
- Nielsen O. J., Sehsted J., Langer S., Ljungström E. and Wängberg I., Chem. Phys. Lett, 238, 359 (1995)
- Langer S., Ljungström E., Ellemann T., Sehsted J. and Nielsen O. J., Chem. Phys. Lett, 240, 53 (1995)
- Ivanov V. V. and Decker C., Polymer International, 50, 113 (2001)
- Fung P. C., Sin K. M. and Tsui S. M., Coloration Technology, 116, 170 (2000)
- Misiti F., Castagnola M., Zuppi C. and Giardina B., Biochem. J, 356, 799 (2001)
- Kocaoba M. and Akcin G., Kluwer Academic Publishers, 9, 143 (2003)
- Fung, P.C., Sin, K.M., and Tsui, S.M., Coloration Technology, 116, 170 (2000)
- Yavari I. and Hossein Mosslemin M., Tetrahedron, 54, 9169 (1998)
- Yavari I. and Ramazani A., Synthetic Commonications, 27, 1385 (1997)
- Yavari I. and Esmaili A. A., Chem Res (S), 714 (1998)
- Ramazani A., Shajari N., Gouranlou F., Phosphorus, Sulphur, and Silicon, 174, 223 (2001)
- Yavari I., Alizadeh A. and Anvary-Abbasnejad M., Phosphorus, Sulphur, and Silicon, 177, 81 (2002)
- Bestmann H. J. and Snyder J. P., J. Am. Chem. Soc. 89, 3963 (1967)
- Schwartz L. M. and Gelb R. I., Anal. Chem, 50, 1592 (1978)
- Bestmann H. J., Joachim G., Lengyel T., Oth J. F., Merenyi R. and Weitkamp H., Tetrahedron Lett., 3355 (1966)
- Bestmann H. J. and Snyder J. P., J. Am. Chem. Soc., 89, 3963 (1967)
- Ditchfield R., Hehre W. J., and J. A. Pople, J. Chem. Phys. 54, 724 (1971)
- Frisch et al M.J., Gaussian 98, Revision A. 7, Gaussian, Inc., Pittsburgh, PA (1998)
- Reed, A.E., Weinstock, R.B. and Weinhold, F.J. J. Chem.Phys, 83, 735 (1985)
- Bader, R. F. W., Atoms in molecules., A Quantum Theory, Oxford University: New York, (1990)
- Biegler König, F.W., Schönbohm, J. and Bayles,D., J.Comput.Chem, 22, 545(2001)
- Esprinosa, E., Souhassou, M., Lachekar, H. and Lecomte, C., Acta Crystallogr, B55, 563(1999)
- Grabowski, S.J. and Mol, J., Struct, 562, 137(2001)

