
Manuscript accepted on :07-Jan-2019
Published online on: 14-01-2019
Plagiarism Check: Yes
Reviewed by: Pedro Gomez Piqueras
Second Review by: Oluwafemi Odebiyi
Final Approval by: Dr. Ayush Dogra
E. Deena Nancy1, A. Arif Yezdani1, M. S. Kannan1, S. Kishore Kumar1 and Kesavaram Padmavathy2
1Department of Orthodontics and Dentofacial Orthopedics, Bharath Institute of Higher Education and Research, Sree Balaji Dental College and Hospital, Pallikaranai, Chennai-600100, India.
2Department of Microbiology, Research Laboratory for Oral-Systemic health, Bharath Institute of Higher Education and Research, Sree Balaji Dental College and Hospital, Pallikaranai, Chennai-600100, India.
Corresponding Author E-mail: arifyezdani@yahoo.com
DOI : https://dx.doi.org/10.13005/bpj/1632
Abstract
Orthodontic treatment planning decisions are dependent on the assessment of growth status. Skeletal maturity could be assessed with various radiologic and non-radiologic biologic markers.The purpose of our study was to investigate the reliability of serum Insulin like Growth Factor – 1(IGF-1) as a skeletal maturity indicator in comparison to the stages in cervical vertebral maturation (CVM). Twenty five subjects with skeletal class II malocclusion in the age range of 11-19 years were recruited for the study. The cervical vertebrae staging was assessed by lateral cephalograms. Blood was collected aseptically and serum was separated. The serum levels of IGF- 1 were quantitatively assessed using a commercial ELISA kit, IGF-1 600 ELISA (DRG Instruments GmbH, Germany). There was a significant decline in the mean IGF-1 levels with increase in age in both the sexes. Statistically significant difference was observed in the concentration of IGF-1 among the different age groups. There was a significant decline in the mean IGF-1 levels with increase in CVM staging from stage 2 to stage 4. IGF-1 could be a more reliable biologic skeletal maturity indicator in comparison to cervical vertebral maturity indicator and thus could predict more accurately the growth status of the mandible to facilitate correction of skeletal class II jaw discrepancies.
Keywords
Cervical Vertebrae; Insulin Like Growth Factor-1; Skeletal Class II Malocclusion
Download this article as:| Copy the following to cite this article: Nancy E. D, Yezdani A. A, Kannan M. S, Kumar S. K, Padmavathy K. Serum Insulin Like Growth Factor-1– A Skeletal Maturity Indicator for the Assessment of Orthopedic Treatment Timing of Skeletal Class II Malocclusion. Biomed Pharmacol J 2019;12(1). |
| Copy the following to cite this URL: Nancy E. D, Yezdani A. A, Kannan M. S, Kumar S. K, Padmavathy K. Serum Insulin Like Growth Factor-1– A Skeletal Maturity Indicator for the Assessment of Orthopedic Treatment Timing of Skeletal Class II Malocclusion. Biomed Pharmacol J 2019;12(1). Available from: http://biomedpharmajournal.org/?p=25533 |
Introduction
Adolescent growth spurt is the ideal period for growth modification therapy with the growth status assessment being important also for treatment planning decisions in other orthodontic procedures like fixed appliance treatment, orthognathic surgery and retention therapy. Girls exhibit an early adolescent spurt than boys and since this timing is gender related clinical decisions regarding growth needs to be taken separately into account for both the sexes.1
Hand wrist and lateral cephalograms are widely used as skeletal maturity assessing tools. Cervical vertebral maturity (CVM) staging though widely used has decreased reproducibility and subjective errors with intra and interobserver disagreements. Furthermore, the onset of the peak in mandibular growth cannot be accurately defined by the CVM staging, an opinion eschewed by Nestman et al who reported poor reproducibility of the CVM method.2 It has also been reported that if the neck is not correctly positioned during taking of the radiograph the cervical vertebrae changes shape. In view of these inherent disadvantages biomarkers have been suggested as better alternatives to assess skeletal maturity and that Insulin-like growth factor 1 (IGF-1) is one such marker that plays a significant role in predicting skeletal growth.3-5
Bone growth is both locally and systemically regulated by IGF-1, a hormonal mediator of growth hormone (GH). Stimulated by GH, IGF-1 is synthesized and secreted in liver. It affects linear growth by rapidly activating bone turnover in long bones and mandibular condyle and that changes in IGF-1 concentrations during growth has a significant effect on condylar cartilage.6-7
IGF-1 is measurable in saliva, urine and serum and that serum IGF-1 levels generally reflect growth hormone status. Measuring serum IGF-1 is therefore considered a useful diagnostic tool in determination of the pubertal status of the patient, especially since its levels do not fluctuate throughout the day as GH levels do & could therefore be a reliable indicator of residual growth of mandible.
This study was proposed to determine whether estimation of serum IGF-1 levels in comparison to CVM staging would be more accurate and reliable in predicting the growth status to facilitate correction of skeletal class II malocclusions in the growth period.
Materials and Methods
The sample size of 25 subjects of both genders who attended the orthodontic outpatient department of the institution and who fulfilled the below mentioned criteria were recruited for the study. Inclusion criteria was male and female patients presenting with skeletal class II malocclusion in the age range of 11-19 years. Exclusion criteria was systemic illness, growth abnormality, bleeding disorders and history of any trauma to the face. The study design and protocol was reviewed and approved by the Institutional Human Ethical Committee. The subjects were explained about the purpose of the study and informed consent was obtained from them. Informed consent was obtained from the parents when the subjects were less than 19 years. Subjects were clinically examined before the study. The subjects and the parents answered questions about history of blood disorders and pubertal status. A growth chart was used to ensure that the subjects belonged to the 95 percentile of the height and weight charts.
Lateral cephalograms were taken and the staging of cervical vertebrae was based on the technique described by Baccetti et al.8
Two mL of blood was obtained by venipuncture and collected in sterile vacutainers. Blood was allowed to clot and the serum was separated and transferred into labelled 1.5 mL eppendorf tubes and stored at -80oC in the freezer until use. The serum levels of IGF- 1 were quantitatively assessed using ELISA based on the principle of competitive binding using a commercial ELISA Kit –IGF-1 600 ELISA (DRG Instruments GmbH, Germany).
Statistical Analysis
IBM®SPSS software version 21 was used for the statistical analysis. Based on the optical density (OD) values of the standards 0-6, a standard curve was drawn. R2 (coefficient of determination) was calculated to determine the best suited model. ANOVA was carried out to determine the adequacy of the model. Student t- test was used to determine the concentration of mean IGF-1 among the males and females. Multiple comparisons was done by Post Hoc Tukey HSD tests to assess the difference in the mean concentration of IGF-1 levels among the subjects of different age groups and its correlation to the CVM stages.
Results
The 25 study subjects with skeletal class II malocclusion in the age range of 11-19 years were stratified into three groups viz., Group A (11-13 years), B (14-16 years), and C (17-19 years).
IGF-1 Concentration
A significant decline was observed in the mean IGF-1 levels from 253.5 ng/mL to 162.2 ng/mL and 116.8 ng/mL in the groups A, B, C respectively. Statistical analysis of the IGF-1 levels among the different age groups by Oneway ANOVA showed a significant difference (P = 0.002) (Table 1). The mean concentration of IGF-1 in the subjects of group A was significantly more compared to the other two groups (B & C). Multiple comparisons by Post Hoc Tukey HSD test revealed that the IGF-1 levels between the groups A Vs B and AVs C were statistically significant. However, the IGF-1 levels between groups B and C were not statistically significant (Table 2).
Table 1: Mean IGF-1 levels among the different age groups.
| Group | Age (yrs) | n | IGF-1 (ng/mL) Mean ± SD | P value |
| A | 11-13 | 10 | 253.5± 85.6 | 0.002 |
| B | 14-16 | 12 | 162.2±38.8 | |
| C | 17-19 | 3 | 116.8±42.0 |
Table 2: Multiple comparison of IGF-1 levels among the different age groups by Post-Hoc Tukey HSD test.
| Groups | Tukey HSD Q statistic |
Tukey HSD p-value |
Tukey HSD inferfence |
| A vs B | 4.8182 | 0.0068454 | ** p<0.01 |
| A vs C | 4.6953 | 0.0083721 | ** p<0.01 |
| B vs C | 1.5922 | 0.5095976 | insignificant |
CVM Staging
The interobserver variability in CVM staging among the three radiologists, assessed by non-parametric correlations – Spearman’s rho showed that there was a minimum of 85.7% correlation among the 3 radiologists.
There was a gradation in the mean age of the study subjects with the increment in the CVM stages (2-5), which was statistically significant (P = 0.002). Of the 25 subjects included in the study, 32% belonged to CVM stage 2, while 24% were of stages 3 and 4, and 20% belonged to stage 5 (Table 3).
Table 3: IGF-1 levels Vs CVM stages.
| CVM Stage
(n=25) |
2
(n =8) |
3
(n =6) |
4
(n =6) |
5
(n=5) |
F-Value | Sig. |
| IGF 1 Conc (ng/mL)
(Mean ± SD) |
228.01 ± 94.08 | 209.70 ± 95.24 | 156.36 ± 56.65 | 162.32 ± 30.93 | 1.334 | 0.290 |
Comparison of IGF-1 with CVM Staging
A significant decline in the mean IGF-1 levels with increase in CVM staging from stage 2 (228.01ng/mL) to stage 4 (156.36 ng/mL) was observed (Fig 1). There was a slight increase in mean IGF-1 level in CVM stage 5 (162.32 ng/mL). The concentration of IGF-1 among the different CVM stages was not statistically significant (P=0.29) (Table 3).
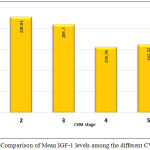 |
Figure 1: Comparison of Mean IGF-1 levels among the different CVM stages.
|
Discussion
In humans, IGF-1 gene encodes the protein IGF-1. Its molecular structure is similar to insulin and is synonymously referred to as a ‘sulfation factor’ with a ‘non-suppresible insulin-like activity’ with a molecular weight of 7,649 Da. Its effect on growth is testimony to the fact that in growth failure, mecasermin (a synthetic analogue) is widely used. It has been observed that though increased IGF-1 concentrations in vitro causes increase in longitudinal bone growth it does not actually affect the histologic organization of the condyle and the femoral head and in contrast to the femoral head, the condyle is more sensitive to IGF-1 levels.9 It has been reported that endochondral bone formation is stimulated in response to local injection of IGF-1 into the mature rat condyles’ articular capsule.6
IGF-1 can be measured in urine and saliva. However, salivary levels are low as also its contamination with blood or gingival fluid may result in inaccurate measurements. Serum IGF-1 levels however reflect GH status well and hence have been used to diagnose GH deficiency and acromegaly. Hence determination of GH status is more reliable with the estimation of serum IGF-1 levels in contrast to GH levels as they do not fluctuate throughout the day. Since IGF-1 production can be directly stimulated by androgens its level can be independent of GH during puberty.
In our study, a significant decline was observed in the mean IGF-1 levels with increase in age. This in line with the findings of Juul et al who reported that IGF-1 levels increased slowly in early childhood with a steep increase during puberty with girls having maximal IGF-1 levels at mean age of 14.5 years and boys at 15.5 years.10
Our results showed a significant decline in the mean IGF-1 levels with increase in CVM staging from stage 2 to stage 4, with an insignificant increase in IGF-1 levels in CS5. However, this is contrary to a previous study which reported lower IGF-1 levels at the prepubertal stages of cervical vertebrae development with a steep increase from CS3 to attainment of peak levels in CS5 with consistent high mean IGF-I levels at CS4 and CS5.10 Previous studies have reported mean peak serum IGF-1 levels at CS4. 11-12 This was in contrast to the findings in our study which showed a peak in mean IGF-1 levels at CS 2 in both the sexes. O Reilly M et al reported significant increase in mandibular length in cervical vertebrae stages 1&2, 2&3, 3&4 and that the corpus length increased between stages 1-2 and 2-3 with an increase in ramal height between stages 1 and 2. Stages 2 and 3 were more apparent in the year preceding peak growth velocity.13
It has been reported that the highest mean IGF-1 value of 394.8 ± 50.89 ng/mL at a mean age of 14.08 years was observed in CS4 in males with maximum increase in IGF-1 levels in CS4 with minimal increase in CS1 and that the highest mean IGF-1value of 397 ± 20.76 ng/ml at a mean age of 12.04 years was observed in CS3 in females with the increase being maximum in CS3 with minimal increase in CS1. 1 Animal experiments too have confirmed the role of IGF-1 on condylar cartilage and post natal growth of mandible.14-15 The advantage of using IGF-1 as a skeletal maturity indicator over the other radiographic techniques was that from prepubertal to late pubertal stages the IGF-1 levels had a positive correlation with CVM and from late pubertal to post pubertal stages a negative correlation, with the levels decreasing post puberty. From our results, it was evident that IGF-1 was at its maximum between 11-13 years & at cervical vertebral stage 2. This peak in the pubertal growth spurt can be made use of to bring about functional modification in skeletal class II malocclusion subjects using functional appliance therapy.16-18
The drawbacks of our study could be lack of adequate number of samples and an imbalance in male to female sex ratio. Equal number of male and female subjects and equal number of the same in the 3 delineated age groups would have expressed even greater accuracy in the estimation of IGF-1 as an ideal skeletal maturity indicator.
Since the peak in the mean IGF-1 concentration showed a decline in levels from the age group 11-13 years to 14-16 years to 17-19 years with the same pattern expressed in both males and females as also since it showed a peak in CS2 followed by CS3 with a gradual decline in CS4, it could be extrapolated that functional appliance treatment during the age group of 11-13 years could be more beneficial for skeletal class II malocclusion. The effect of IGF-1 on condylar cartilage is well documented and taking advantage of its rise in concentration in the growth period could enhance the treatment of skeletal class II jaw discrepancies. Predicting growth accurately at the individual level is seemingly impossible, however, it becomes incumbent on the orthodontist to predict the peak in pubertal growth spurt with fair accuracy to treat skeletal jaw discrepancies in the growth period. The identification of the intensity and timing of a patients’ growth spurt with the estimation of serum IGF-I levels could be made more predictive with more availability of longitudinal data which could in the near future label this biologic marker a reliable predictor of normal and residual facial growth.
Conclusion
Peak in IGF-1 levels was observed in age group 11-13 years in both the male and female subjects following which there was a progressive decrease in IGF-1 levels in the age group 14-16 years & 17-19 years.
Peak in IGF-1 levels in cervical vertebrae stage 2 with a decline in levels in the subsequent cervical vertebrae stages in both the sexes.
Functional appliance treatment of skeletal class II malocclusions in CS2 – CS3 stage for both the sexes could be suggested.
IGF-1 could be a more reliable biologic skeletal maturity indicator in comparison to Cervical Vertebral Maturity Indicator.
Acknowledgements
The author(s) received no specific funding for this work.
Conflict of Interest
There is no conflict of interest.
References
- Gupta S.,Deoskar A.,Gupta P., Jain S. Serum insulin-like growth factor-1 levels in females and males in different cervical vertebral maturation stages. Dental Press J Orthod. 2015;20(2):68-75.
CrossRef - Nestman T. S., Marshall S. D., Qian F., Holton N., Franciscus R. G., Southard T. E. Cervical vertebrae maturation method morphologic criteria: Poor reproducibility. Am J Orthod Dentofacial Orthop. 2011;140:182-88.
CrossRef - Masoud M., Masoud I., Kent R. L. Jr.,Gowharji N., Cohen L. E. Assessing skeletal maturity by using blood spot insulin-like growth factor I (IGF-I) testing. Am J Orthod Dentofacial Orthop. 2008;134:209-16.
CrossRef - Srinivasan B., Premkumar S. Assessment of serum dehydroepiandrosterone sulphate in subjects during the pre-pubertal, pubertal, and adult stages of skeletal maturation. Eur J Orthod. 2011;41: 1-5.
- Masoud M. I., Masoud I., Kent R. L. Jr., Gowharji N., Hassan A. H., Cohen L. E. Relationship between blood-spot insulin-like growth factor 1 levels and hand-wrist assessment of skeletal maturity. Am J Orthod Dentofacial Orthop. 2009;136:59-64.
CrossRef - Suzuki S., Itoh K., Ohyama K. Local administration of IGF-I stimulates the growth of mandibular condyle in mature rats. Journal of Orthod. 2004;31:138–43.
CrossRef - Litsas G. Growth Hormone and Craniofacial Tissues. An update. Open Dent J. 2015;9:1–8.
- Baccetti T., Franchi L., McNamara Jr J. A. The Cervical Vertebral Maturation(CVM) Method for the Assessment of Optimal Treatment Timing in Dentofacial Orthopedics. Semin Orthod. 2005;11:119–29.
CrossRef - Delatte M., Von den Hoff J. W.,Maltha J. C., Kuijpers-Jagtman A. M. Growth stimulation of mandibular condyles and femoral heads of newborn rats by IGF-1. Arch Oral Biol. 2004;49:165-75.
CrossRef - Juul A., Bang P., Hertel N. T., Main K., Dalgaard P., Jorgensen K., et al. Serum insulin-like growth factor-I in 1030 healthy children, adolescents, and adults: Relation to age, sex, stage of puberty, testicular size, and body mass index. J Clin Endocrinol Metab1. 994;78:744-52.
- Jain S., Sandhya J., Deoskar A., Sai Prasad V. S. Serum IGF – 1 levels as a clinical tool for optimizing orthodontic treatment timing. Progress in Orthodontics. 2013;14-46.
- Ishaq R. A. R., Soliman S. A. Z., Foda M. Y., Fayed M. M. S. Insulin-like growth factor 1: A biologic maturation indicator. Am J Orthod Dentofacial Orthop. 2012;142:654-61.
CrossRef - O’Reilly M. T., Yanniello G. J. Mandibular growth changes and maturation of cervical vertebra – A longitudinal cephalometric study. The Angle Orthod. 1988;179-84.
- Mohan S., Richman C., Guo R., Amaar Y., Donahue L. R., Wergedal J., Baylink D. J. Insulin-Like Growth Factor Regulates Peak Bone Mineral Density in Mice by Both Growth Hormone Dependent and Independent Mechanisms. Endocrinology. 2003;144:929–36.
CrossRef - Visnapuu V., Peltomaki T., Ronning O., Vahlberg T., Helenius H. Growth Hormone and Insulin-like Growth Factor-I Receptors in the Temporomandibular Joint of the Rat. J Dent Res. 2001;80 :1903-07.
CrossRef - Toth L. R., McNamara J. A Jr. Treatment effects produced by the Twin-block appliance and the FR-2 appliance of Fränkel compared with an untreated Class II sample. Am J Orthod Dentofacial Orthop. 1999;116:597-609.
CrossRef - Baccetti T., Franchi T., Toth L. R., McNamara Jr J. A . Treatment timing for Twin-block therapy. Am J Orthod Dentofacial Orthop. 2000;118:159-70.
CrossRef - do Rego N. V. M. N., Martinez F. E.,Coelho I. M. R.,Leal P. M. L.,Thiesen G. Perception of changes in soft-tissue profile after Herbst appliance treatment of Class II Division 1 malocclusion. Am J Orthod Dentofacial Orthop. 2017;151:559-64.
CrossRef

