
Manuscript accepted on :19-Jan 2018
Published online on: 06-02-2019
Plagiarism Check: Yes
Reviewed by: Akmal El-Mazny
Second Review by: Sumit Kushwaha
Final Approval by: Dr. Ayush Dogra
Sameena Pathan1 , Vatsal Aggarwal2, K. Gopalakrishna Prabhu3and P. C. Siddalingaswamy*4
1,2,4Department of CSE, Manipal Institute of Technology, Manipal Academy of Higher Education, Manipal, India.
3Department of ECE, Manipal University Jaipur, India.
Corresponding Author E-mail: pcs.swamy@manipal.edu
DOI : https://dx.doi.org/10.13005/bpj/1619
Abstract
Color is considered to be a major characteristic feature that is used for distinguishing benign and malignant melanocytic lesions. Most of malignant melanomas are characterized by the presence of six suspicious colors inspired from the ABCD dermoscopic rule. The presence of these suspicious colors histopathologically indicates the presence of melanin in the deeper layers of the epidermis and dermis. The objective of the proposed work is to evaluate the role of color features, a set of fifteen color features have been extracted from the region of interest to determine the role of color in malignancy detection. Further, a set of ensemble classifiers with dynamic selection techniques are used for classification of the extracted features, yielding an average accuracy of 87.5% for classifying benign and malignant lesions.
Keywords
Benign lesions; Color; Dermoscopy; Ensemble Classifiers; Malignant lesions; Segmentation
Download this article as:| Copy the following to cite this article: Pathan S, Aggarwal V, Prabhu K. G, Siddalingaswamy P. C. Melanoma Detection in Dermoscopic Images using Color Features. Biomed Pharmacol J 2019;12(1). |
| Copy the following to cite this URL: Pathan S, Aggarwal V, Prabhu K. G, Siddalingaswamy P. C. Melanoma Detection in Dermoscopic Images using Color Features. Biomed Pharmacol J 2019;12(1). Available from: https://bit.ly/2MPgI32 |
Introduction
The malignancy of melanocytic cells is termed as melanoma, a deadly form of skin cancer. The melanocytic cells are responsible for the production of melanin, which gives the skin its natural color. The primitive diagnosis of melanoma mainly relies on the precise assessment by the dermatologist using a dermoscope.1 Several imaging modalities were developed to aid dermatologist in examining the pigmented skin lesions. An illustration of the pigmented skin lesions is presented in Fig.1. Dermoscope is used by the dermatologist to analyse the skin lesions, it constitutes one of the major imaging modality. Melanoma diagnosis is dependent on the dermatologist’s experience and is time-consuming. As the disease metastasizes to the lymph nodes, biopsy is required for the diagnosis. This indicates the need for computer aided diagnostic since it provides the objective and accurate diagnosis. Recently, CAD tools have been developed to provide timely and objective diagnosis. The CAD tools take into account the color, shape and texture features to analyze the pigmented skin lesions.
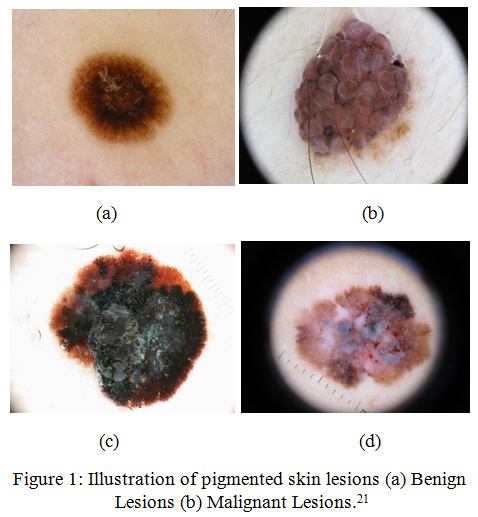 |
Figure 1: Illustration of pigmented skin lesions (a) Benign Lesions (b) Malignant Lesions.21
|
Related Work
A complete CAD tool for melanoma diagnosis consists of: segmentation, feature extraction and lesion classification. The recent years have witnessed significant contributions in the field of melanoma diagnosis. The CAD systems can be broadly divided into three major categories. (i) systems that take into account the dermoscopic knowledge of the lesions. Such systems are clinically oriented and are inspired by the ABCD dermoscopic rule, (ii) systems that exploit the power of artificial intelligence by studying the abstract properties of the labelled dermoscopic images, (iii) hybrid systems that are a combination of (i) and (ii).
A combination of color features were employed by Barata et al.2 for classification of the skin lesions. A set of shape, color and texture features were used by Abuzaghleh et al.3 for a three class skin lesion classification. In the recent years several complex deep learning architectures have been proposed.4-5 However, deep learning algorithms suffer from vanishing gradient problem as the number of layers increase. Upon careful review of the literature it was been observed that the number of features have been used for the classification of the skin lesions into benign and malignant,6-8 thus increasing the computational complexity of the CAD systems. In the proposed system, a set of color features have been investigated, since color is the most important chromophore of the skin. The color of the lesion plays a prominent role in determining the type of the lesion. In addition to this a set of ensemble classifiers with dynamic selection techniques have been introduced for the classification of skin lesions.
Contributions
The classification of skin lesions is performed using minimal number of features. The contributions of the proposed work are given below.
The role of color features in malignancy detection is evaluated.
Ensemble of classifiers with dynamic classifier selection are designed for classification in contrast to the conventional classification techniques.
The paper organization is as follows. Section II provides an overview of the color features extracted and the design of ensemble of classifiers. Section III presents the results obtained using the proposed features followed by the conclusion section IV.
Material and Methods
The proposed system aims to evaluate the role of color features in diagnosis of pigmented skin lesions. The Fig. 2 provides an overview of the proposed system.
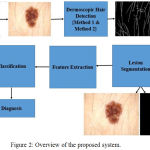 |
Figure 2: Overview of the proposed system.
|
The dermoscopic image is initially pre-processed using a set of tuned Gabor filters. Further, the region of interest is delineated from the dermoscopic image using chroma based deformable models. Hair detection and lesion segmentation is performed using dermoscopic knowledge of the pigmented skin lesions. A set of 15 features specific to color are extracted from the region of interest. The extracted features are used for classification. Dynamic ensemble selection methods are incorporated in Ensemble of classifiers for classification of skin lesions.
Dataset
The PH2 dataset consists of 200 annotated freely available images.9 The dataset comprises of 160 benign lesions including the common nevi and atypical nevi and 40 malignant skin lesions.
Dermoscopic Hair Delineation and Localization of Region of Interest
The presence of hair greatly affects the accuracy of the segmentation algorithm. Thus, hair detection and exclusion forms the primary step in development of a computer aided diagnostic tool for melanoma diagnosis. Scalar or vector dermoscopic images may be used for pre-processing. Since, the lesions are predominantly visible in blue-channel of the RGB image, the blue channel is widely in use for processing, in some cases, the grayscale image has also been utilized for the same. With the ultimate goal of increasing the difference between the lesion and surrounding skin, several attempts have been performed to choose an appropriate color space. The most commonly used color spaces include the perceptually uniform CIEL*a*b,10-11 CIEL*u*v12-13 and HSV12-14 color spaces. In these color spaces the perceived color difference between two colors mimics the human visual system. The methods can be applied to single and multichannel, in case of multichannel, the single channel methods are concatenated.
Directional Gaussian filters are used identify the hair artifacts. A group of 16 directional filters were used for detection of hair using the luminance component of the perceptually uniform CIE L*A*B color space. The luminance component mimics the perceptual response of the Human Visual System (HVS). The parameters used in the Gabor filters are fine-tuned using the dermoscopic knowledge of the hair shafts. The lesions are localized using the chroma based deformable models. A detailed explanation of the hair detection and lesion segmentation method used is given in.15 The Fig.3 illustrates the impulse responses obtained for the chosen Gabor parameters. The Fig. 4 provides an illustration of the process of hair detection.
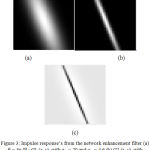 |
Figure 3: Impulse response’s from the network enhancement filter (a) θ= 3 π/8 : G1 (x, y), with σx1= 20 and σy1= 4.6 (b) G2 (x, y), with σx2= 20 and σy2= 1.15 (0.25( σy1)) Difference R3π/8(x, y) (right).
|
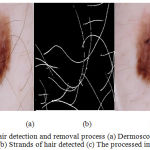 |
Figure 4: Hair detection and removal process (a) Dermoscopic RGB image (b) Strands of hair detected (c) The processed image.
|
The performance of the geometric deformable models mainly relies on the initial conditions used and the evolution of the speed function. 16 The segmentation approach is proposed by exploiting the aforementioned domain knowledge of skin lesions by considering the chroma component. . An illustration of the LAB color channels is given in Fig. 5.
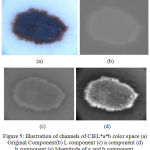 |
Figure 5: Illustration of channels of CIEL*a*b color space (a) Original Component(b) L component (c) a component (d) b component (e) Magnitude of a and b component.
|
The speed function incorporates the lesion chroma information and the global information. The basic idea is to evolve the curve until considerable differences between the background and the lesion border is obtained. The Fig. 6 illustrates the results of lesion segmentation.
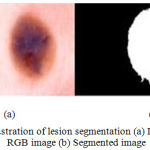 |
Figure 6: Illustration of lesion segmentation (a) Dermoscopic RGB image (b) Segmented image.
|
Feature Extraction
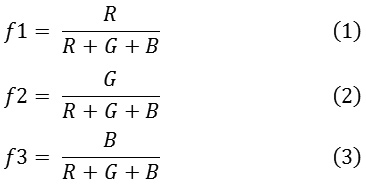
Color plays an important role in dermoscopy. The color of the lesion depends on the localization of melanin in the skin. Benign lesions tend to exhibit one or two colors, whereas malignant lesions exhibit three or more colors. In order to quantify the color of the lesion, a set of absolute and relative color features are extracted from the region of interest and the background skin.17 The RGB chromatic co-ordinates are used to quantify the absolute color of the pixels. Raw RGB values are variant to illumination direction and intensity, whereas the absolute colors are invariant.18 The invariance nature of the absolute colors aids in dealing with uncontrolled imaging conditions due to the different capturing devices. The three set of color features extracted are given in.1-3
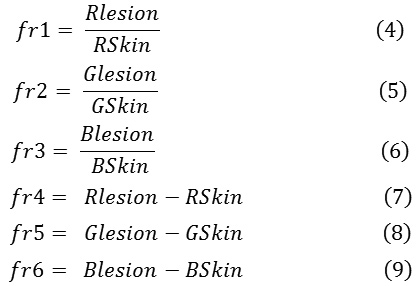
The chromaticity values of the lesion pixels with respect the background skin are termed as relative chromaticity features. These chromaticity features highlight the perceptual differences between the lesion and the background skin. The relative chromaticity features are given in.4-9
Lesion Classification
Classification forms the last stride of a lesion diagnosis system. To quantify the role of relative and absolute color features in malignancy detection, two ensemble of classifiers with dynamic selection methods are adopted.19-20
Ensemble of decision stump trees built using bagging.
Ensemble of decision trees built using Ada Boost.
In case of dynamic classifier selection, for each test pattern a classifier is selected. The major objective is to select a classifier that classifies a particular test pattern with greater amount of accuracy. The Fig. 7 shows a schematic description of the dynamic selection techniques used for classifier selection. The number of decision stump trees are decided based on the number of input features. Thus, an ensemble of 15 decision stump trees are built using bagging. The maximum depth of the tree is two. Stump Decision trees are reasonably fast to train. They are also fast to classify. Once an ensemble of decision stump trees are built using bagging, the aforementioned dynamic selection methods are used to select an ensemble of classifiers for a given test pattern. Further, a majority voting scheme is applied to predict the label for the given test pattern from the ensemble of classifiers selected. Similar to the first model, the decision stump trees are replaced by AdaBoost of weak learners and further the dynamic selection models are used to predict a test label.
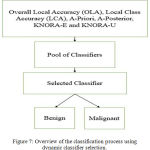 |
Figure 7: Overview of the classification process using dynamic classifier selection.
|
Results and Discussions
The role of color features in malignancy detection is evaluated. The evaluation parameters are sensitivity, specificity and accuracy as given in (16-18).
Sensitivity = TP/TP+FN (16)
Specificity = TN/TN+FP (17)
Accuracy = TP +TN/TP +FP +TN +FN (18)
where, TP = True Positive.
TN = True Negative.
FP = False Positive.
FN = False Negative.
Sensitivity indicates the accuracy of classification of malignant lesions, specificity indicates the accuracy of classification of benign lesions and accuracy indicates the overall rate of correct classification of benign and malignant lesions. The results of classification using ensemble decision stump trees is given in Table 1. The benign samples are represented by ‘0’ and the malignant samples are replaced by ‘1’. Normal indicates a single classifier. It was been observed that the best classification accuracy was obtained for KNORA-E dynamic ensemble selection technique. The Fig. 8(a) and Fig. 8(b) illustrates corresponding ROC curve and confusion matrix for KNORA-E dynamic ensemble selection technique respectively. The results of classification using ensemble of AdaBoost decision stump trees is given in Table 2. It was been observed that the best classification accuracy was obtained for a simple AdaBoost ensemble. The Fig. 9(a) and Fig. 9(b) illustrates corresponding ROC curve and confusion matrix for the same respectively.
Table 1: Results of Classification using Ensemble of Decision Stump Trees.
| Class | Method | Precision | Recall | F1-Score | Accuracy |
| 0 | Normal | 0.79 | 1.00 | 0.88 | 0.8 |
| 1 | 1.00 | 0.20 | 0.33 | ||
| 0 | Ensemble | 0.79 | 1.00 | 0.88 | 0.8 |
| 1 | 1.00 | 0.20 | 0.33 | ||
| 0 | OLA | 0.83 | 0.97 | 0.89 | 0.825 |
| 1 | 0.80 | 0.40 | 0.53 | ||
| 0 | LCA | 0.81 | 0.97 | 0.88 | 0.8 |
| 1 | 0.75 | 0.30 | 0.43 | ||
| 0 | A-Priori | 0.81 | 0.97 | 0.80 | 0.8 |
| 1 | 0.75 | 0.30 | 0.43 | ||
| 0 | A-Posterior | 0.85 | 0.97 | 0.91 | 0.85 |
| 1 | 0.83 | 0.50 | 0.62 | ||
| 0 | KNORA-E | 0.86 | 1.00 | 0.92 | 0.875 |
| 1 | 1.00 | 0.50 | 0.67 | ||
| 0 | KNORA-U | 0.79 | 1.00 | 0.88 | 0.8 |
| 1 | 1.00 | 0.20 | 0.33 |
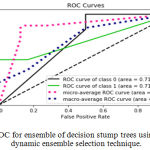 |
Figure 8.a: ROC for ensemble of decision stump trees using KNORA-E dynamic ensemble selection technique.
|
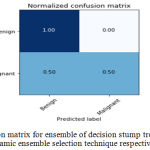 |
Figure 8.b: Confusion matrix for ensemble of decision stump trees using KNORA-E dynamic ensemble selection technique respectively. |
Table 2: Results of Classification using Decision Trees built using Ada Boost.
| Class | Method | Precision | Recall | F1-Score | Accuracy |
| 0 | Normal | 0.88 | 0.97 | 0.92 | 0.875 |
| 1 | 0.86 | 0.60 | 0.71 | ||
| 0 | Ensemble | 0.81 | 0.97 | 0.88 | 0.8 |
| 1 | 0.75 | 0.30 | 0.43 | ||
| 0 | OLA | 0.88 | 0.93 | 0.90 | 0.85 |
| 1 | 0.75 | 0.50 | 0.67 | ||
| 0 | LCA | 0.85 | 0.93 | 0.89 | 0.825 |
| 1 | 0.71 | 0.50 | 0.59 | ||
| 0 | A-Priori | 0.85 | 0.93 | 0.89 | 0.825 |
| 1 | 0.71 | 0.50 | 0.59 | ||
| 0 | A-Posterior | 0.85 | 0.97 | 0.89 | 0.85 |
| 1 | 0.83 | 0.50 | 0.59 | ||
| 0 | KNORA-E | 0.85 | 0.97 | 0.91 | 0.85 |
| 1 | 0.83 | 0.50 | 0.62 | ||
| 0 | KNORA-U | 0.83 | 1.00 | 0.91 | 0.85 |
| 1 | 1.00 | 0.40 | 0.57 |
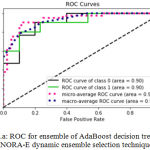 |
Figure 9.a: ROC for ensemble of Ada Boost decision trees using KNORA-E dynamic ensemble selection technique.
|
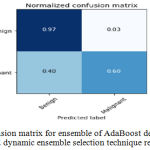 |
Figure 9.b: Confusion matrix for ensemble of Ada Boost decision trees using KNORA-E dynamic ensemble selection technique respectively.
|
Table 3: Results of Classification using different classification models.
| Classifier | Class | TPR | FPR | Precision | F-Measure | ROC Area |
| SVM | Benign | 0.95 | 0.62 | 0.86 | 0.9 | 0.66 |
| Malignant | 0.37 | 0.04 | 0.68 | 0.48 | 0.66 | |
| Average | 0.84 | 0.5 | 0.82 | 0.82 | 0.66 | |
| Naïve Bayes | Benign | 0.83 | 0.35 | 0.9 | 0.87 | 0.83 |
| Malignant | 0.65 | 0.16 | 0.5 | 0.56 | 0.83 | |
| Average | 0.8 | 0.31 | 0.82 | 0.8 | 0.83 | |
| ANN | Benign | 0.91 | 0.3 | 0.92 | 0.91 | 0.89 |
| Malignant | 0.7 | 0.09 | 0.65 | 0.67 | 0.89 | |
| Average | 0.86 | 0.25 | 0.87 | 0.86 | 0.89 | |
| Ada Boost | Benign | 0.92 | 0.4 | 0.9 | 0.91 | 0.88 |
| Malignant | 0.6 | 0.07 | 0.67 | 0.6 | 0.88 | |
| Average | 0.86 | 0.33 | 0.85 | 0.85 | 0.88 | |
| Logitboost | Benign | 0.91 | 0.45 | 0.89 | 0.9 | 0.89 |
| Malignant | 0.55 | 0.08 | 0.61 | 0.57 | 0.89 | |
| Average | 0.84 | 0.37 | 0.83 | 0.83 | 0.89 | |
| Decision Stump Trees | Benign | 0.92 | 0.77 | 0.82 | 0.87 | 0.55 |
| Malignant | 0.22 | 0.07 | 0.42 | 0.29 | 0.55 | |
| Average | 0.78 | 0.63 | 0.74 | 0.75 | 0.55 | |
| Random Forest | Benign | 0.93 | 0.5 | 0.88 | 0.9 | 0.91 |
| Malignant | 0.5 | 0.06 | 0.64 | 0.56 | 0.61 | |
| Average | 0.84 | 0.41 | 0.83 | 0.83 | 0.91 |
In addition to ensemble of classifiers, the extracted features are tested using ten-fold cross validation technique on 7 different binary classifiers. The classifiers used for testing are as follows:
Support Vector Machines (SVM).
Naïve-Bayes.
Multilayer Perceptron.
AdaBoost of Decision Trees.
Logit Boost.
Decision Stump Trees.
Random Forest.
The Table 3 depicts the classification results for the aforementioned classification models. TPR indicates the True Positive Rate or the portion of correct classification for both the classes. FPR indicates the False Positive Rate or the portion of incorrect classification for both the classes. Precision indicates the Positive Predicted Value of the relevant instances among the retrieved instances. F-measure is the weighted harmonic mean of the Precision and Recall of the classification test.
Conclusion
The paper discusses the development of a color feature based CAD system for the diagnosis of melanocytic skin lesion. A set of fifteen color features have been used to determine the role of color in malignancy detection. The proposed features are extracted from the region of interest obtained by segmenting the lesions from the background skin. A dynamic set of ensemble classifiers have been used for the classification. It has been observed that the best results were obtained using decision stump trees with KNORA-E ensemble selection techniques. An average accuracy of 87.5% was observed for the classification of benign and malignant lesions for the PH2 dataset. The proposed set of features can be incorporated in building a CAD tool that can be adopted in a clinical setting.
Acknowledgements
The authors thank Dr. Sathish Pai Ballambat, Professor and Head, Department of Dermatology, Venereology and Leprosy, Kasturba Medical College, Manipal for the expert guidance. The authors express their gratitude to Prof. Tanweer, MIT, MAHE Manipal, for his extensive support and contribution in carrying out this research.
Conflict of Interest
The authors declare that, there are no potential conflict of interest associated with the article.
Funding Source
There are no funding sources available for this research article.
References
- Pathan K. G. Prabhu and Siddalingaswamy P. C. “Techniques and algorithms for computer aided diagnosis of pigmented skin lesions—A review,”Biomedical Signal Processing and Control. 2018;39:237–262.
- Barata M. E. Celebi and Marques J. S. “Development of a clinically oriented system for melanoma diagnosis,”Pattern Recognition. 2017;69:270–285.
- Abuzaghleh B. D. Barkana and Faezipour M. “Noninvasive Real-Time Automated Skin Lesion Analysis System for Melanoma Early Detection and Prevention,”IEEE Journal of Translational Engineering in Health and Medicine. 2015;3:1–12.
- Bozorgtabar B., Sedai S., Roy P. K and Garnavi R. Skin lesion segmentation using deep convolution networks guided by local unsupervised learning. IBM Journal of Research and Development.2017;61(4):6-1.
- Patnaik S. K., Sidhu M. S., Gehlot Y., Sharma B & Muthu P. Automated Skin Disease Identification using Deep Learning Algorithm. Biomedical and Pharmacology Journal. 2018;11(3):1429-1436. doi:10.13005/bpj/1507.
- Oliveira R. B., Pereira A. S & Tavares J. M. R. Skin lesion computational diagnosis of dermoscopic images: Ensemble models based on input feature manipulation. Computer methods and programs in biomedicine. 2017;149:43-53.
- Satheesha T. Y., Satyanarayana D., Prasad M. G & Dhruve K. D. Melanoma is Skin Deep: A 3D reconstruction technique for computerized dermoscopic skin lesion classification. IEEE Journal of Translational Engineering in Health and Medicine. 2017;5:1-17.
- Pathan S., Siddalingaswamy P. C., Lakshmi L & Prabhu K. G. Classification of benign and malignant melanocytic lesions: A CAD tool. In Advances in Computing, Communications and Informatics (ICACCI), 2017 International Conference on IEEE. 2017;1308-1312.
- Mendonça T., Ferreira P. M., Marques J. S., Marcal A. R & Rozeira J. PH 2-A dermoscopic image database for research and benchmarking. In Engineering in Medicine and Biology Society (EMBC), b 2013 35th Annual International Conference of the IEEE. 2013;5437-5440.
- Abbas Q., Garcia I. F.,Celebi M. E., Ahmad W & Mushtaq Q. A perceptually oriented method for contrast enhancement and segmentation of dermoscopy images. Skin Research and Technology. 2013;19(1).
- Celebi M. E., Iyatomi H & Schaefer G. Contrast enhancement in dermoscopy images by maximizing a histogram bimodality measure. In Image Processing (ICIP), 2009 16th IEEE International Conference on IEEE. 2009;2601-2604.
- Barata C., Ruela M., Francisco M., Mendonça T & Marques J. S. Two systems for the detection of melanomas in dermoscopy images using texture and color features. IEEE Systems Journal. 2014;8(3):965-979.
- Schaefer G., Krawczyk B., Celebi M. E & Iyatomi H. An ensemble classification approach for melanoma diagnosis. Memetic Computing. 2014;6(4):233-240.
- Rastgoo M., Garcia R., Morel O & Marzani F. Automatic differentiation of melanoma from dysplastic nevi. Computerized Medical Imaging and Graphics. 2015;43:44-52.
- Pathan S., Prabhu K. G & Siddalingaswamy P. C. Hair detection and lesion segmentation in dermoscopic images using domain knowledge. Medical & Biological Engineering & Computing. 2018;1-15.
- Chan T., Vese L. Active contours without edges. IEEE Trans Image Process. 2001;10:266–277. doi: 10.1109/83.902291.
- Pathan S., Prabhu K. G & Siddalingaswamy P. C. A methodological approach to classify typical and atypical pigment network patterns for melanoma diagnosis. Biomedical Signal Processing and Control. 2018;44:25-37.
- Celebi E., Iyatomi H., Stoecker W. V.,Moss R. H.,Rabinovitz H. S., Argenziano G and Soyer H. P., “Automatic detection of blue-white veil and related structures in dermoscopy images,” Computerized Medical Imaging and Graphics. 2008;32(8):670–677.
- Ko A. H., Sabourin R & Britto Jr A. S. From dynamic classifier selection to dynamic ensemble selection. Pattern Recognition. 2008;41(5):1718-1731.
- Didaci L., Giacinto G., Roli F & Marcialis G. L. A study on the performances of dynamic classifier selection based on local accuracy estimation. Pattern Recognition. 2005;38(11):2188- 2191.
- ISIC 2016: Skin Lesion Analysis Towards Melanoma Detection.Available:https://challenge.kitware.com/#challenge/n/ISBI_2016%3A_Skin_Lesion_Analysis_Towards_Melanoma_Detection [Accessed: 24-Sep-2017].

