
Manuscript accepted on :23-Mar-2019
Published online on: 27-03-2019
Plagiarism Check: Yes
Reviewed by: Sumit Kushwaha
Second Review by: Abdullah Noohu
Z. Faizal Khan
College of Computing and Information Technology, Shaqra University, Kingdom of Saudi Arabia.
Corresponding Author E-mail: faizalkhan@su.edu.sa
DOI : https://dx.doi.org/10.13005/bpj/1636
Abstract
In this article, a Combination of Fuzzy logic and color features based segmentation approach for parenchyma of lung from the Coronal and Sagittal Chest CT images is proposed. This approach employs a modified method of segmenting lung parenchyma which is considered as the Region of Interest (ROI) from the Coronal and Sagittal Chest CT images. The first step is the pre-processing of CT lung image in for the process of removing the noise and artefacts present in it. The border detection process is carried out as a Second step where all the regions including the tissue and lung parenchyma is separated by a border detection algorithm. Third step is the color formation process in which the image along with its border is formed in magenta color. Then, the color features extracted from the image border and are given as input to the Improved Fuzzy C Means clustering (IFCM) method to produce the lung Parenchyma. Experimental results reveal that the proposed methodology provides better segmentation results of 97.8 % accuracy in segmenting the parenchyma from Coronal and Sagittal Chest CT images.
Keywords
Coronal; Improved Fuzzy-C-Means Clustering; Sagittal Chest Images; Segmentation; Texture Features;
Download this article as:| Copy the following to cite this article: Khan Z. F. Fully Automated Coronal and Sagittal Chest Segmentation using Colour Features and Fuzzy C-Means Clustering in CT Images. Biomed Pharmacol J 2019;12(1). |
| Copy the following to cite this URL: Khan Z. F. Fully Automated Coronal and Sagittal Chest Segmentation using Colour Features and Fuzzy C-Means Clustering in CT Images. Biomed Pharmacol J 2019;12(1). Available from: https://bit.ly/2Ys1BSK |
Introduction
Computer Aided diagnosis of abnormalities in medical images is the most important step for the process of detection of anomalies present in the human body in earlier stage.15 Developing a robust algorithm for segmenting medical images becomes an important research among various researchers for the past decades. Image Segmentation is the process of separating an image into a set of different regions in which each and every region is homogeneous in nature. Medical images Segmentation is used for extracting the information which is necessary regarding the presence of different tissues, organs and other abnormalities present in it. The accuracy of a deformity detection system mostly depends on the efficiency of the segmentation methodology used in it. Hence, a segmentation technique which should be more accurate in segmenting the abnormalities present in the medical images is very important to be proposed. The existing segmentation techniques for CT lung Parenchyma generally have some limitations due to the over and under segmentation errors. However, it is necessary to have an efficient segmentation algorithm which can segment the lung Parenchyma long with the modalities present in it more accurately. In this paper, an efficient method called Improved Fuzzy C-mean clustering along with the Color features (CIFCM) for segmenting the parenchyma of CT lung images is proposed.
This proposed method ensures that no excess pixels along the border of blood vessels are segmented since it was removed from the post processing procedure. The paper is arranged as follows: Section 3 explains the survey of related works. Section 4 explains the proposed TIFCM algorithm in detail by providing the details of each step. Section 5 explains the construction of feature vectors for the process of segmentation. Section 6 depicts the results obtained from the work. Section 7 presents the conclusions on this work and suggests possible future works.
Literature Survey
The main aim of this method is to extract the quantitative information such as volumetric data and textural patterns present in the CT lung image. Accuracy of segmenting lung parenchyma should be thoroughly analysed since the pathologies present on it should not be missed. These missing pathologies may be a reason for loss of identification of abnormalities present in the lung. if the entire lung parenchymal area is not segmented correctly, it will be difficult for a doctor to find the detection of abnormalities more accurately present in it. Main aim of this proposed methodology is to separate the parenchymal region present in the CT lung Images. In the CT lung images, various works for segmenting the lung parenchyma have been proposed earlier by various researchers in the literature which includes Neural Networks,15 deformable boundary models,10,11 edge-based methods8,12 etc.
Pu et al in14 proposed a segmentation method where the lung border in a geometric is smoothed by this algorithm in a way such that it can include the juxtapleural nodules also. Their algorithm can reduce the occurrence of over segmentation of the abdomen and the mediastinum area which is presented very adjacent to the lung parenchyma. Their algorithm has been analyzed their algorithm an approximate of 20 slices. Volume based over and under segmentation is the metrics they had used to evaluate their proposed algorithms segmentation accuracy. An over and under segmentation accuracy of 0.43 % and 1.63 %, respectively is obtained for the input tested images.
A modified method of segmenting the lung parenchyma from CT images was proposed in.2 This method segments the lung parenchymal region by selecting an optimal threshold. For a given image, it can be done by comparing the curvature of both the lung boundaries along with the ribs present around it. Initially, the ribs region present in the lung parenchymal outer regions is segmented by a threshold-based algorithm combined by morphological based operations. The value of threshold value verified till all the curvatures of the ribs and the lung boundaries are closely matched with each other. The curvature of the ribs are represented by a polynomial interpolation function along with the boundary of lung parenchymal region is matched such that a minimal deviation is present from its complete representation. The overall accuracy of their proposed method is compared with various conventional lung segmentation algorithms for an approximate 25 subjects. The performance of their method was significantly more when compared to the other conventional techniques. A threshold-based segmentation method proposed in.4 In this work, the authors have used their proposed algorithm in to a set of 276 CT chest scans which has an overall slice of 2292. All the slices consist of different abnormalities and all of them are taken under different positions of scanning. Various threshold-based lung parenchyma segmentation schemes are applied and monitored visually for all the testing slices. A 4.4 % of average error rate of was obtained for a total of 126 scans.
Antonelli et al.5 have proposed a novel method combining threshold-based segmentation, morphological opening and closing operations, border detection, thinning, and reconstruction. They have tested their proposed algorithm for eight CT scans, in which each consists an average of 300 slices. Morphological based operators such as opening, and closing are also applied for eliminating all the excess small objects present inside the lung parenchyma. The lung borders are detected using a tracking-based algorithm. Morphological thinning is further used to reduce the border size. At last, a morphological based filling operator is used to the lobes chains present in the pulmonary area in order to ensure the presence of exact values of gray levels. Major disadvantage of their proposed method is the background present in the Lung CT image cannot be removed completely when there exists noise at the corners. Their proposed method is more accurate since both high-radiation-dose and low radiation-dose computed tomography images can be used as an application to it. A novel method for lung segmentation was proposed by Arfan Jaffar et al in.7 In their paper, segmentation of lung the lung images are done based on three main steps such as Background removal, Preprocessing, and Morphological based operation. A histogram-based operator is used to remove the unwanted pixels around the lung parenchymal area. Then, preprocessing operation is done for the process of smoothing and removing the unwanted noise present in the segmented lung region. Finally, morphological based operators are used to separate the edges for filling the small holes present in it.
Proposed Methodology
Pre-Processing
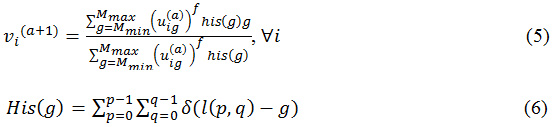
In this paper, a mean filter of size 5×5 pixels is used in order to reduce the noise and artefacts present in the input CT Lung images. Since the CT lung image has various shapeless image boundaries, either the pixels which are present outside of the lung parenchymal region or the parenchymal boundaries were considered, to overcome the missing of nerves present in the lung parenchymal boundary. The original and its pre-processed image of the retina CT lung is depicted in Figure 1.
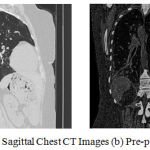 |
Figure 1: (a) Original Coronal and Sagittal Chest CT Images (b) Pre-processed image.
|
Border detection
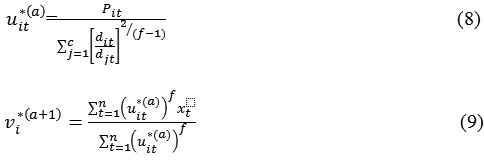
First step is the separation of lung borders from the background. For the process, an automated method proposed in [13, 14] was employed. The Lung image and the results the parenchymal borders which are detected is shown below in figure 2. Figure 2 (a) presents the Input CT lung image. Figure (b) Border detected lung image and Figure (3) Detected borders marked on the lung image.
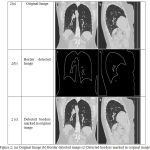 |
Figure 2: (a) Original Image (b) Border detected image (c) Detected borders marked in original image.
|
Feature Extraction
The process of Color formation is shown in figure 2 and Color Feature Vectors Construction is performed in this Stage. RGB color format is the widely used format for processing digital images. Main drawback of this format is that it is not perceptually uniform in nature for all the images. The Hue, Saturation, Value (HSV) which is a representation of RGB color space is compatible with the perception human color. In this method, in order to obtain the color features, histograms of square window centering around each pixel on an equidistant grid in each and every plane of the image has been done using both LAB and HSV color spaces. A 5 × 5 window size is used for extracting the mean histograms are obtained for two image spaces.
Constructing Feature Vectors: Color Texture Using Neighbourhood Statistics
In the recent literatures, often Gabor filters are used to extract the texture features for segmenting images. But the Gabor filters have a major setback that a lot of redundancy is induced and therefore, enormous amount of feature channels are generated. In this methodology, a new color based texture feature extraction using the higher order image statistics1 is proposed. This method defines the texture regularity of the total image with in its neighbourhood structures more effectively. Statistics of the entire image can be recovered by an unsupervised learning as process used in.6 In this methodology, the total image is considered as a random field X with a set of lattice points S where {Ss } ∈ S the total set of pixels present in the entire image is. For extracting this feature, an unsupervised adaptive filter6 is also used. This improves the probability of the intensities of pixel by decreasing their joint entropy (X|Y = y), of the conditional probability for each and every neighbourhood pair of pixels, (X = x, Y = y). This can be done by changing the entire value of each pixel x present in the center. For this process, in each iteration and for entire image region,, the below equation is computed.
∂h(X|Y = ym) / ∂ xm (1)
An image im+1 is constructed further using the process of a finite forward differences method on the gradient descent, with intensities as follows.
xm+1 = xm xm – λ∂h/∂ xm (2)
where λ is the time step. We stop pixel updating process after few iterations when ||im+1 – im || 2< δ, a small threshold. For extracting the color texture features, the process of filtering is performed for three Lab image channels. After that pixels in a 5 × 5 window centering of each pixel is extracted, it is further smoothed using a Gaussian. Finally, the local histograms are calculated in it.
Constructing Feature Vectors
Feature vector construction can be done by Mean Weighted Histogram process. since color and texture in a color textured image plays complementary roles in image segmentation, this combination will enhance the final segmentation result more accurately. If there is each C channels are present in N feature histograms, the weighted mean histogram which is computed as channel wise, H¯j can be computed as
![]()
where wi is the weight which is allocated to each histogram. The mean of histogram is calculated through channel wise weighted mean histograms,
![]()
when all the color texture features are extracted using te proposed method, it has to inherent similarity i.e., wi = 1/n. The features which are obtained from the feature vector construction process using the Color Texture using neighbourhood statistics process is given further as input to the Fuzzy-C-Mean Clustering. The color texture feature was used in this method since these features precisely represents the color texture of an image more accurately.
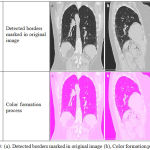 |
Figure 3: (a). Detected borders marked in original image (b), Color formation process.
|
Colour feature based Fuzzy-C-Mean Clustering
A Fuzzy-C-Means technique9 along with the colour features using an improved clustering method in used in this paper. Since the colour features are combined with the fuzzy clustering, it increases the accuracy of segmentation. Among the obtained clusters, first one is the homogeneity cluster in which the cluster data are present and the second one is heterogeneity cluster which consists of the dissimilar clusters. But these dissimilar clusters should be made similar as much as possible. For making these clusters as similar, the colour features are combined with it. A membership function is used to recognize Each and every cluster which are used to classify the values of statistical mean and deviation. Then it compares the entire image with the complete image. If any of the pixels present in the entire image is not similar to any one of the clusters then, a new cluster is formed for the respective non-similar pixel. This process is continued till the end of the last pixel present in the image. All the pixels present in the entire images are combined to form sub groups. Finally, many clusters with subgroups are repeatedly formed. Among these different subgroups, four features from each group of clusters were extracted. The obtained features equivalent to each and every cluster is a weighted arrangement of the pixels contained in the respective clusters using the priori probability (Tpit). The colour Texture based priori probability is set to specify the colour textural spatial weight of the adjacent pixels present in the entire image as follows.
Step 1: Mark the centroids cluster Ci value based on the image histogram of limitation for Fuzzification f, the value of h and k>0
Step 2: calculate the membership function by using.
Step 3: Calculate the centroids of cluster by using.
Step 4: Go to step 2 and replicate until all the pixels are clustered.
Step 5: An a priori probability can be computed by
![]()
Step 6: Compute the membership function by
With the probabilities.
Step 7: If all the clusters are formed, go to step 8, otherwise go to step 5.
Step 8: Image segmentation after defuzzification using
Ct = argi {max(uit)} I = 1,2 … .,c (10)
Where – Textured Priori probability, is the degree & membership of xt in the th cluster, C-No of the cluster, f-weighting exponent on each fuzzy membership, Ci is the prototype of the centroid of the cluster i, d2(xt, ci) is a distance between object xt and cluster ci, g- is a gray level.
Results and Discussion
Segmentation Accuracy has been evaluated for assessing the performance of our proposed methodology. In this section, results of the proposed methodology are computed for Coronal and Sagittal Chest CT Images have been used for the purpose of analysis. The segmented results along with its original images, Pre-processed images, ground truth images, segmented results and its accuracy is given in figure 4.
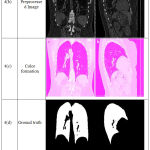 |
Figure 4: Coronal and Sagittal Chest CT Segmentation Results.
|
Figure 3 shows the segmented images obtained from Coronal and Sagittal Chest CT images. Accuracy can be computed by.
![]()
where TP is the true positive, TN is the True Negative, FN is the false negative and FP is the False positive respectively of the segmented images. The segmentation results are compared to the manually drawn images called ground truth which is drawn using Photoshop. The metrics used to compare to the segmented image with its ground truth is as follows.
Table 1: Segmentation Accuracy based on Number of objects.
| Image | 1 | 2 | 3 | 4 | 5 | 6 | 7 | 8 |
| Accuracy | 97.3 | 96.4 | 97.7 | 98.5 | 97.9 | 98.6 | 97.4 | 98.6 |
| Average | 97.8 | |||||||
Table 1 shows the segmentation accuracy based on Accuracy analysis for Coronal and Sagittal Chest CT images. The performance remains higher with respect to the other existing approaches which shows that the effectiveness of our proposed methodology. From the above table, it can be noted that our proposed segmentation method provides an overall accuracy of 97.8% in segmenting the Coronal and Sagittal Chest CT images more effectively.
Conclusion
A novel approach for segmenting lung parenchyma from the Coronal and Sagittal Chest CT images by combining the Colour features and improved Fuzzy-C-Means clustering is proposed. The main advantage of the proposed approach is this method undergoes a five step process such as the noise reduction, border detection, border matching, feature extraction and at last the segmentation in order to enhance the overall accuracy of segmenting lung parenchyma from the Coronal and Sagittal Chest CT images by reducing the error of segmentation present in methodologies proposed earlier. The combination of IFCM along with the colour features is the major advantage of this method. The proposed methodology has been applied to 150 Coronal and Sagittal Chest CT lung images to find the efficiency and accuracy of the proposed algorithm. Future works can be a proposal of new algorithm for analyzing the presence of nodule and to segment it.
Acknowledgements
The author(s) received no specific funding for this work.
Conflict of Interest
There is no conflict of interest.
References
- Wei Y., Shen G., Juan-juan L. A Fully Automatic Method for Lung Parenchyma Segmentation and Repairing, Springer. J Digit Imaging. 2013;26:483–495.
CrossRef - Prasad M. N., Brown M. S., Ahmad S., Abtin F., Allen J., Da Costa I., Kim H. J., McNitt-Gray M. F., Goldin J. G. “Automatic segmentation of lung parenchyma in the presence of diseases based on curvature of ribs”, Academic Radiology. 2008;15(9):1173-1180.
CrossRef - El-Baz A., Beache G. M., Gimel’farb G., Suzuki K., Okada K., Elnakib A., Soliman A., Abdollahi B. Computer-Aided Diagnosis Systems for Lung Cancer:Challenges and Methodologies. Hindawi Publishing Corporation International Journal of Biomedical Imaging. 2013;46. Article ID 942353.
- Meng X., Qiang Y., Zhu S., Fuhrman C., Siegfried J. M., Pu J. “Illustration of the obstacles in computerized lung segmentation using examples”.Medical Physics. 2012;39(8): 4984-4991.
CrossRef - Antonelli M., Lazzerini B., Marcelloni F. “Segmentation and reconstruction of the lung volume in CT images”, 20th annual ACM symposium on applied computing. 2005;1:255–259.
CrossRef - Khan F & Kannan Z. “Intelligent Approach for Segmenting CT Lung Images Using Fuzzy Logic with Bitplane”, Journal of Electrical Engineering and Technology. 2014;9(4):742- 752.
CrossRef - Jaffar A., Hussain A., Mirza M. A . “Fuzzy Entropy Based Optimization of Clusters for the Segmentation of Lungs in CT Scanned Images”, Knowledge Information Systems. 2010;24:91-111.
CrossRef - Maulik U. Medical image segmentation using genetic algorithms. IEEE Transactions on Information Technology in Biomedicine. 2009;13(2):166-173.
CrossRef - Wei Q., Hu Y., Gelfand G., MacGregor J. H. Segmentation of lung lobes in high-resolution isotropic CT images. IEEE Trans Biomed Eng. 2009;56(5):1383–1393. 18.
- Abdollahi B., Soliman A., Civelek A. C., Li X. F., Gimel’farb G and ElBaz A. A novel 3D joint MGRF framework for precise lung segmentation, in Proceedings of the MICCAI Workshop on Machine Learning in Medical Imaging, Nice, France. 2012;24:86–93.
CrossRef - Abdollahi B., Soliman A., Civelek A. C., Li X. F., Gimel’farb G and ElBaz A. A novel gaussian scale space-based joint MGRF framework for precise lung segmentation, in Proceedings of the IEEE International Conference Image Processing (ICIP’12). 2012;2029–2032.
CrossRef - Korfiatis P., Skiadopoulos S., Sakellaropoulos P., Kalogeropoulou C., Costardou L. “Combining 2D wavelet edge highlighting and 3D thresholding for lung segmentation in thin-slice CT”. The British Journal of Radiology. 2007;80(960):996-1004.
CrossRef - Khan F & Kannan Z. A “Intelligent Segmentation of Medical images using Fuzzy Bitplane Thresholding”, Measurement science Review. 2014;14(2):94-101.
CrossRef - Pu J., Roos J., Yi C. A., Napel S., Rubin G. D., Paik D. S. “Adaptive border marching algorithm: Automatic lung segmentation on chest CT images” Computerized Medical Imaging and Graphics. 2008;32(6):452-462.
CrossRef - Khan F. Segmentation of Lung Images using Region based Neural Networks. Biomedical and Pharmacology Journal. 2018;11:4

