
Manuscript accepted on :13-Sep-2018
Published online on: 13-09-2018
Plagiarism Check: Yes
Reviewed by: Surendar Aravindhan
Second Review by: Ian MARTINS
Final Approval by: Mohamed Abdel-Daim
Bhawna Goyal1  Ayush Dogra1, Sunil Agrawal1 and B.S.Sohi2
1UIET, Panjab University Chandigarh, India.
2Chandigarh University Gharuan, India.
Corresponding Author E-mail: bhawnagoyal28@gmail.com
DOI : https://dx.doi.org/10.13005/bpj/1484
Abstract
The current literature documents a plethora of image denoising techniques in the fields of medical imaging, remote sensing, biometrics, surveillance and vegetation mapping. Therefore it is important to have brief insight into various types of noises in different type of images, for instance medical images, remote sensing images and natural images. This article encompasses the basic definition, history, usage and type of noise affecting some of the major types of imaging modalities. Besides this a brief discussion on the type of noise prevailing in remote sensing and natural images is also given. While designing an effective image denoising algorithm, one needs to be acquainted with the prior information about the noise prevalent in various types of images. Further, a brief idea about the basic principle, outlook, contrast levels and application of medical imaging modalities has also been presented in the context of this article.
Keywords
Gaussian Noise; Medical Imaging; Modalities; Remote Sensing; Speckle Noise
Download this article as:| Copy the following to cite this article: Goyal B, Dogra A, Agrawal S, Sohi B. S. Noise Issues Prevailing in Various Types of Medical Images. Biomed Pharmacol J 2018;11(3). |
| Copy the following to cite this URL: Goyal B, Dogra A, Agrawal S, Sohi B. S. Noise Issues Prevailing in Various Types of Medical Images. Biomed Pharmacol J 2018;11(3). Available from: http://biomedpharmajournal.org/?p=22526 |
Introduction
Image processing is a dominant tool for many areas including robotics, biometrics, security and surveillance, remote sensing and medical imaging. The holistic applicability and performance of a particular image processing task, in fact largely depends on the quality of the test image. However, digital images are inevitably corrupted by noise due to acquisition, transmission and mathematical computation. Noise manifests itself in the digital image in a random uncorrelated manner, making it inescapable to degrade the visual quality of the images besides harshly limiting the precision and accuracy of image interpretation and examination.1
In case of medical imaging low light conditions and limited exposure types, leads to degradation of specimens by increasing the noise influence. In case of medical scans, precise and accurate information extraction is of paramount importance for disease’s diagnosis, staging and treatment. Noise often creates artefacts in the images leading to false diagnosis. Due to availability of multi-sensor imaging technologies, multi-modality images are readily fused to together to gather the supplementary information into a single image. A noisy scan however restrains the visual quality of the fused image as well its accurate comprehension, which in turns hampers patient care and treatment.2,3
Image noise affects the quality of an image and low image quality is an obstacle for effective feature extraction, analysis, recognition and quantitative measurements.
Remote sensing images with high visual quality are highly important for automatic recognition and examination of their components by programmed systems for instance land-coverage surveys and monitoring, growth estimation and crop yield, water-spread specifications, calamity management for flood and land slide and fish activity.4,5
However, owing to the influence of detrimental environmental conditions such as clouds and inadequate illumination, these images tend to be of lower resolution and even dark which make their contents very hard to be distinguished. Further, these images are affected by radiometric noise types like Gaussian noise, Poisson noise and atmospheric absorption and scattering, which reduce the visual quality of images and make them unsuitable for further analysis and applications. Therefore, it is essential to denoise low-quality optical remote-sensing images.6
While designing an image denoising algorithm, the prior information about the type of noise is integral to the efficacy and basic mathematical formulation of the algorithm. The various type noises affecting various types of images are Gaussian Noise, Poisson Noise, Impulse Noise and Quantization noise. While manifestation of any type of noise in various images is an entirely random stochastic process, the Additive White Gaussian Noise is the most prevalent noise in images as it occurs during acquisition and transmission through analogy circuitry which is pretty much the basic operation required for computerised operation. Besides this Gaussian Noise affects the entire image in a uniform manner, it could be stated that Gaussian noise affects almost each pixel of an image, which drastically reduces the level of image interpretation.5-7 The impulse noise on the other hand affects limited number of pixel in dark and white manner, which still leaves some room for common interpretation of the image data. The prevalence of other types of noises such as quantization noise, impulse noise, speckle noise and Poisson is almost a rare occurrence owing to faulty manufacturing, bit error rate and inadequate photon count during image acquisition. However the effect of Gaussian noise is most drastic as far as comprehension of features details is concerned and this becomes increasingly important in case of medical and remote sensing images.
As it is certain form literature, in the field of image denoising the most common setting is to use grey scale images corrupted with AWGN. Since long, the images contaminated with AWGN are used as benchmark test images in order to assess the performance of noise suppression algorithms. Gaussian noise has a probability density function of the normal distribution. A random value calculated by the normal distribution is added to each of the clean pixel. The noise samples drawn are independent of each other and for every pixel the variance and the mean are the same.
The read-out or amplifier noise of digital cameras is often approximately AWGN. Gaussian noise is the most commonly prevailing noise and can occur due to the thermally agitated electrons in an electrical conductor. It can also be stated as the noise which has Gaussian amplitude distribution and this can be mathematically defined as8:
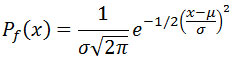
where μ is the mean (location of the peak in the bell shaped curve for Gaussian distribution) and is the standard deviation. The distribution with zero mean and variance equal to one is the standard normal distribution. In statistical and functional analysis, the first approximation for any real valued random variables that is uniformly distributed around a single mean is taken as normally distributed. The prime reasons for the normal distribution to be the most major PDF are: According to central limit theorem, the mean for an expanded set of random variables non-dependently withdrawn from identical distribution is approximately distributed normally, irrespective of the form or the type of original distribution. Besides this, the results and analytical functions involving normal distribution can be derived in an explicit form.6
Therefore, Gaussian Noise is primarily the focus in the relevant literature and in this paper.
Noise Issues in Different Types of Images
There are a variety of digital images available which provide valuable information in diverse fields of application like medical imaging, remote sensing, military and surveillance, robotics and artificial intelligence. The contamination of these images irrevocably destroys the image interpretability. While proceeding towards formulating efficient and edge preserving algorithm it is obligatory to be acquainted with the basic principle, usage, outlook and effect of noise in various types of data sets.
In this section the significance and importance of medical and remote sensing images along with the noises affecting them are discussed in brief.
Medical Imaging
Medical imaging scans are extensively used to localize the various abnormalities in the different organs of the body which are reflected by these scans. Due to the inherent progress in the low-cost imaging and computational devices, these medical scans are increasingly used by the medical community for diagnosis, staging and treatment of various diseases. The area of medical imaging besides being a potential research topic in atomic physics is emerging as an indispensable diagnostic tool in regular as well as advanced hospitals across the world.
Various medical practitioners seek to retrieve, diagnose and examine diseases from the images created by the medical imaging techniques. The major type of medical scans are X-Ray, CT (Computed Tomography), MRI (Magnetic Resonance Imaging), Ultrasound, PET (Positron Emission Tomography) and SPECT (Single Photon Emission Computed Tomography). These medical images are composed of clinical data, physiological patterns, soft and hard tissues, malignant and benign tumours which has become an essential element of patient’s care. These imaging modalities finds applications in clinical assessment of various organs of the body like brain, bone, teeth, soft tissues, blood vessels, breast and stomach etc. These imaging are different from the natural photographic images as they reflect the internal anatomy of the body organs.
For precise and accurate diagnosis, medical images need to be sharp, clear and free of noise and artefacts. Due to the widespread use of these imaging technologies, the preservation of the quality of the images becomes vital. As these medical imaging technologies thrive to achieve high resolution images, they end up packing increasing number of pixel per unit area. This makes the images more susceptible to noise. While presence of noise can mask and blur important subtle features, the presence of artefacts can lead to false diagnosis. Hence the denoising these images becomes important in order to ensure precise and timely diagnosis and treatment.
A basic insight into radiographic procedures involving basic elementary and nuclear physics in generation of these medical scans is essential before devising a denoising algorithm. Radiography is the principal phenomenon which is employed for capturing the images of internal anatomy of human body. The major types of radiation can be categorized as electromagnetic radiation or particulate radiation. Electrons, protons, positron and neutrons are particulate radiation and Infrared, Ultraviolet, X-rays and Gamma radiations are major types of electromagnetic radiation.10,11
In the following sub-sections, the basic principle and applications of various imaging modalities are given.
X-RAY
A definite value of amplitude, wavelength, frequency and velocity are the characteristics which are prime distinguishing features of an electromagnetic wave. X-ray’s are most popular form of medical imaging technology used to identify hard tissues and bone structures. X-Ray’s were discovered by Wilhelm Conrad Rontgen in 1895 by means of an evacuation glass bulb with positive and negative electrodes as penetration radiation. In an X-Ray system the patient is exposed to X-ray radiation (which have wavelength in the range of nanometres 10-9 and frequency in the range of 1016-1019 Hz) and the reflection is made to be produced on 2-dimensional projection radiographs. The X-ray images are a 2-D projection of the internal body organs in different shades of white and black owing to the varied amount of absorption of radiations by bones and tissues. The calcium in bones, absorbs the X-rays so bones appear in the while colour on radiographic plain. The tissues on the other hand, absorb less and hence appear to black.
X-Ray imaging is primarily applicable in spotting of broken bones. When a bone is broken (fractured), the fracture line will appear as a dark area within the lighter bone on an X-ray film. Besides this, chest X-ray can detect pneumonia, and mammograms can help in detection of breast cancer. Due to gradual pattern of absorption of radiations, X-ray’s are often used to detect osteoporosis, to trace the decreasing density of the bones. It allows finds an interesting application in the detection of the objects swallowed by children. X-Ray systems possess easy implementation and cost effectiveness, therefore they are readily employed in dental radiography to find cavities in the teeth. Besides being an important medical diagnostic tool, X-Ray is extensively used in treatment and management of cancer.
However, X-ray radiography should be handled with care. A chest X-ray subjects the body to a similar amount of radiation as one is naturally exposed to from the environment in ten days.2,10,11,12
Fig. 3.1 shows X-Ray for spine and feet depicting the condition of osteoporosis,
![Figure 3.1: Spine and Feet X-RAY (L and R) [14, 15]](https://biomedpharmajournal.org/wp-content/uploads/2018/09/Vol11No3_Noi_Bha_fig3.1-150x150.jpg) |
Figure 3.1: Spine and Feet X-RAY (L and R) [14, 15]
|
Noise, artefacts and contrast are three primary factors controlling the quality of an X-Ray image. The prevalence of noise is a random process and photons impinge on an X-ray film in a random manner. Some pixels or areas of the film receive more number of photons than the other areas and hence would appear darker than other areas even when exposed to same average photon intensity. This distribution of photons is an entirely random process and the presence of noise gives X-ray’s a mottled, textured, grainy, or snowy appearance. This presence of noise due to random distribution of photons in X-ray imaging is generally called quantum noise. The presence of noise besides giving an undesirable appearance can hide and reduce the visual perception of the certain integral features of importance in the image. The reduced comprehension of images becomes more important in low contrast objects.
Although quantum noise is the generally prevailing noise in X-ray imaging systems, they sometimes contain noise generated by random electrical currents often produced by thermal activity within the system and is Gaussian in nature. The fluoroscopic radiography such as DSA (Digital Subtraction Angiography) is more prone to noise due increased number of photon receptor sensitivity.2,11,12
No imaging technology is free of noise; however some types of medical modalities are more prone to noise than the other. Plain X-ray radiographs are least prone to noise. The amount of noise prevalent generally depends on the receptor sensitivity. The X-Ray radiography with fluoroscopic systems is more prone to noise due to increased sensitivity of these materials.
Computed Tomography
CT (computed tomography), was implemented as clinical application in 1971 as an improvisation to the X-Ray imaging technology which was limited to axial imaging of the body. The computed tomography was able to capture the subtle changes in the tissues with less than 5 percent of contrast variation. Although, the spatial resolution of objects which are about a millimetre are better represented with X-ray, where as the subject contrast is clearly visible with CT.
These systems were able to generate a versatile 3-D whole body imaging modality which finds applications in cardiology, interventional radiology, oncology and vascular radiology. CT has become an integral part of the treatment and follow-up programs for patients and in treatment through radiotherapy.
A typical CT image acquisition process involves measuring of X-Ray transmission profile through a patient from a large number of views. The profile captured by each view is obtained by using a detector with approximately 900 detector units. The large number of views of the various cross sections results from the rotation of the detector tube around the patient. These technology facilitates the inside view of the subject under study without any kind of surgical process. A CT image is finally reconstructed by a computerised program of combining these transmission profiles of 2-D axial CT to form a 3-D representation of the subject.
The detection of breast cancer through mammography is the principle application of CT imaging technology. CT scanner allows capturing of the images of the breast in a 3-D manner which helps the radiologists to detect the malignant mass with a little ease. Unlike X-Ray imaging, CT substantiates the need for differentiation between hard and soft tissues, for instance lung, tissue and fat. CT scans besides revealing the presence of large space occupying tumours and lesion, also gives the spread, location and depth of tumour. Besides this, CT images can detect and diagnose blood clots, narrowing of blood vessels, building up of cerebrospinal fluids in heart and other parts of the body.
CT images have been extensively forms the basis for planning and to follow the course of cancer stages and to reveal how the tumour is responding to the treatment. CT images provide high spatial resolution as well is able to trace the slight contrast variation in tissue. This permits the usage of CT in orthopaedic treatments and images of protrusion of vertebra, hip or functional unit fractures in spine and other bony structures. CT scans are fast and reliable has become an extensively employed choice for radiologists for detecting life threatening pathologies.2,10-13,16
Fig. 3.2 shows the CT scan of heart depicting the condition for presence of excess of fluid heart and the sac surrounding it and Fig. 3.3 shows the CT scan of heart depicting the condition of pneumonia.
![Figure 3.2: Computed Tomography for pericardial effusion [17].](https://biomedpharmajournal.org/wp-content/uploads/2018/09/Vol11No3_Noi_Bha_fig3.2-150x150.jpg) |
Figure 3.2: Computed Tomography for pericardial effusion [17].
|
![Figure 3.3: Computed Tomography of heart for pneumonia [18].](https://biomedpharmajournal.org/wp-content/uploads/2018/09/Vol11No3_Noi_Bha_fig3.3-150x150.jpg) |
Figure 3.3: Computed Tomography of heart for pneumonia [18].
|
The noise in CT images reduces the visibility of low contrast objects (which is the prime reason for the widespread application of CT). CT images are prone to Gaussian noise due to the electrical signals appear. The high speed computation of CT images from multiple planar views results in thermal energy fluctuations which lead to the manifestation of Gaussian noise in these images. Besides this CT images are also noisy due to mathematical computations and quantum statistics. The presence of random noise in CT images limits the ability of the medical practitioners to discriminate between tissues of varying density.
The medical imaging, in fact is the processing of 2-dimensional electric signals appear and electronic circuits inevitably add noise to the images which is Gaussian in nature. This type of noise is most predictably injects itself into the system at analog signal appear processing stage. It is stated that much of the random noise in present-day CT scanners is due to the statistical inaccuracies arising from the detection of a finite number of transmitted x-ray quanta. Besides this CT images are also prone to artefact and structural noise.19,20
Emission Computed Tomography [ECT]
SPECT (Single Positron Emission Computed Tomography) and PET (Positron Emission Tomography) are two types of medical imaging techniques which fall under the category of Emission Computed Tomography. This imaging technology makes use of radioactive materials to study the various properties and patterns of body’s physiology.
In SPECT, the word single refers to the product of the radioactive decay i.e. a single photon, while in PET the decay produces a single positron.
ECT works on the tracer principle, which state that the physiological processes of the body can be determined by tracing the gamma rays emitted by radioactive materials. The radioactive materials can be used to track the flow and distribution of various substances in the body.2,3,9
PET is a nuclear medicine based imaging technology which enables the visualization of different functional and metabolism related processes in the body. In PET, the radioactive nuclide particles like 15O, 11C, 18F and 13N are injected into the subject under study and their tracer concentration is recorded in the form of 3-D images with the help of the computer analysis. The diseased areas often have higher level of chemical activity and the radioactive substances get collected in these areas. The PET scans often spot these areas before other imaging scans could predict about them.10,11
Fig. 3.4 shows the image of a breast positron emission tomography documenting the response of the radiotherapy treatment in tumour contraction.
![Figure 3.4: Positron Emission Tomography of breast [21].](https://biomedpharmajournal.org/wp-content/uploads/2018/09/Vol11No3_Noi_Bha_fig3.4-150x150.jpg) |
Figure 3.4: Positron Emission Tomography of breast [21].
|
SPECT is another conventional nuclear substance medical imaging technique. It varies in a slight manner from PET, as the tracer concentrations in former case are recorded as time independent events. It provides information at a higher level of flexibility which manipulated or reformatted as per need. SPECT records the changes or adjustments in the regions of interest which precedes the actual residing of abnormality in the body. PET and SPECT images are much more sensitive to changes in contrast levels of various hard and soft tissues even at picomolar level as compared to CT and MRI. PET and SPECT finds its widespread application in clinical oncology in terms of: detection of cancer, revelation of cancer spread, to check whether the tumour is responding to the treatment and determines the improper chemical functioning of many other organs of the body. The major types of cancers or lesions in body detected by PET and SPECT include: lymphoma, esophageal, melanoma, cervical, prostates, pancreatic, brain tumours and Alzheimer’s disease.2,3,10,11
Also, they are an important research tool used for the mapping of normal human brain and heart function.
Fig. 3.5 shows brain imaging with a SPECT for normal brain functioning to Alzheimer’s condition.
![Figure 3.5: Brain SPECT for Alzheimer’s disease [22]](https://biomedpharmajournal.org/wp-content/uploads/2018/09/Vol11No3_Noi_Bha_fig3.5-150x150.jpg) |
Figure 3.5: Brain SPECT for Alzheimer’s disease [22]
|
Images generated by PET and SPECT radiographic techniques are generally noisy, which impairs the visualization potential and affecting the precision of the quantitative procedure performed with these images. The prevalence of noise in these images limits the comprehension of the changes induced in the pathological lesions. The major sources of noise in these types of images are inherent random variations in the indefinite photon count, electronic recorder and detector systems. According to,23 PET and SPECT produces 10% of noise with fewer number of photons than CT which produces 0.1% of noise with higher amount of flux.
According to Riddell et al.,24 it has been shown that SPECT and PET provides a uniform and intensity independent noise distribution which is Gaussian in nature over the whole image.
Magnetic Resonance Imaging
Some types of abnormalities which are not visible by CT, X-Ray and even fluoroscopic radiography can be visualized with help of MRI (Magnetic Resonance Imaging Scans). From long, since its invention in mid 80’s, it has far-reaching applications in the field of medical sciences. Where X-Ray and CT scans maps the density of the tissues in the body, MR images maps the spread of proton energy in the body. High activity or signal areas as bright on MR images emphasising the areas which contain a larger amount of fat or water.
MRI is basically a non-invasive technology which produces detailed anatomical images without the damaging radiation as is the case in X-Ray radiography. In magnetic resonance imaging technology, the subject under study is subjected to strong magnetic field align the protons in the body according to that field. Basically, the protons in the body spin out of equilibrium and begin to strain under the pull of magnetic force when radio frequency current is pulsated through the human body. The living tissues are primarily composed of water which contains protons and MRI records the gradual changes in the inclinations of the rotational axis of the protons. Also, the magnetic sensors trace the nuclear energy transitions due to re-alignment of the protons and as well as the chemical changes in the molecules at withdrawal of the magnetic field. MRI enables the discrete visualization of the soft-tissues or non-osseous parts of the body without the damaging ionizing x-rays.25
MRI’s generate a much clearer picture than CT and hence are widely used for imaging the detailed anatomy of brain, nerves, spinal cord, tendons and ligaments. In the brain, MRI can differentiate between white matter and grey matter and can also be used to diagnose aneurysms and tumours. A specialised kind of MRI known as functional MRI provides a potential application for understanding the organisation of brain and for the assessment of regions of brain for increased oxygen consumption. It helps in assessing in various neurological risks their status and degrees.
Under the subjugation of magnetic field, protons in the tissues return to their equilibrium state according to phenomenon known as spin lattice and spin-spin relaxation. A T1 weighted MRI is generated if MR signal is measured prior to the realization of the equilibrium state and a T2 weighted image is generated if the magnetisation is allowed to decay before measuring the MR signal. T1 weighted MRI is a most trusted diagnostic tool for the detection of nerve compression or radioculopathy, stenosis and multiple sclerosis. Besides this it helps in assessment of bone health such arthritis, osteoporosis and dementia.
Fig. 3.6 shows the MRI scan of axial and sagittal view of the brain.26
![Figure 3.6: MRI scans for axial and sagittal view of brain (L-R) [26]](https://biomedpharmajournal.org/wp-content/uploads/2018/09/Vol11No3_Noi_Bha_fig3.6-150x150.jpg) |
Figure 3.6: MRI scans for axial and sagittal view of brain (L-R) [26].
|
Noises in MRI images primarily are Rician noise, Gaussian Noise and Rayleigh noise. However, when the SNR magnitude in MR images is greater than 2, then Rician distribution, transforms to Gaussian noise distribution and when SNR is approaching zero it converges to Rayleigh distribution. A lot of research work has been carried on removal of Rician Noise, however a little literature exists on removal of Gaussian and Rayleigh noise from MRI images. The primary sources of noise in MRI images are:
Electronic interferences in the receiver circuits.
Radiofrequency emissions due to thermal motion of the ions in the patient body.
The measurement chain of MRI scanners i.e. coils, electronic circuits etc.
Noise in MRI causes random fluctuations, which reduces the image contrast due to signal-dependent data bias. This disturbs the precise qualitative and quantitative evaluation as well as feature detection MR images. The signal to noise in MRI is high in most of the clinical applications, resulting in the manifestation of Gaussian noise.27
Ultrasound (US)
A typical medical Ultrasound system consists of a transmitter probe pulsing signal ranging from 20KHZ to several gigahertz and receiver display. The US imaging facilitates the visualization of real time images of the live tissues in the body. The sound waves disperse through the body and reaches between soft tissue or fluid tissue or bone. These waves are reflected by the coplanar surfaces in the body and are recorded can be displayed on the computer.
Ultrasound imaging has diagnostic application to visualize the internal body structures joints, tendons, ovaries, uterus, tendons and muscles and most importantly in obstetrics. Besides this it is used to display transverse of tissues over time, location of blood, presence of cysts and tissue stiffness and motion of tissue by exploiting the acoustic impedances of tissues.
In contrast to other technologies, US is safe, real-time, portable and has no harmful radiations, however it provides limited field of view and usually requires a trained professional.
US images are inherently of lower visual quality due to varying temporal and acoustic variations. The visual quality of these images is further lower by presence of various kinds of noises amplifier noise, impulsive noise or speckle noise. Gaussian Noise is the typical representative of the amplifier noise occurring due to numerous thermal and electronic fluctuations in the circuits. Another type of noise commonly found in US images is speckle noise. It is a kind of a granular noise, resulting from constructive and destructive interference of the temporal coherent sound waves in the system.28
![Figure 3.7: ULTRASOUND scan of liver [28].](https://biomedpharmajournal.org/wp-content/uploads/2018/09/Vol11No3_Noi_Bha_fig3.7-150x150.jpg) |
Figure 3.7: ULTRASOUND scan of liver [28].
|
In the preceding sections, a brief insight into the primary image modalities which finds numerous applications in medical imaging and the various noise issues prevailing in them has been discussed. A brief summary of the information presented in preceding paragraphs is summarized in the table below:
Table 3.1: A comparison of various radiographic techniques.29
| X-RAY | CT | PET | SPECT | MRI | ULTRASOUND | |
| Basic principle | X-RAY radiations/projections | X-RAY projections of cross section of body | nuclear substance imaging/radioactive tracing | nuclear substance imaging/radioactive tracing | Energy transition of protons | Reflection of high frequency temporal waves |
| Cost | Intermediate | intermediate | High | very high | high | Low |
| Radiation source | X-rays | X-rays (Ionizing) | Positron | Photons | magnetic field | sound waves |
| Type of noise distribution | Gaussian, Poisson | Gaussian, quantum noise | Gaussian | Gaussian, | Gaussian, Rician, Rayleigh | Speckle, Gaussian |
| Application | Anatomical | anatomical functional | anatomical functional metabolism | Functional | anatomical functional molecular | Anatomical Functional |
Remote Sensing
Remote sensing is an extremely prudential technique for gathering, exploring and assessing the Earth in terms of its various objects, processes and phenomena. The employment and advancement of high-resolution cameras has lead to rapid development of the remote sensing technology. According to Liu et al. during acquisition and transmission process, remotely sensed images are invariably corrupted by additive noises. Due to inaccessibility of the remote site, the quality of remote sensing images is usually far from satisfactory. The occurrence of noise in remote sensing images not only further degrades the visual quality of the images, rather limits the subsequent applications such as target detection and classification and environmental monitoring by making the image details hard to be distinguished. Remote sensing sensor records the electromagnetic energy reflected back or emitted by the surface of the earth.1,6,7,11 In case of remote sensing the primary sources of noise which have been dealt so far are: atmospheric effect (absorption and scattering of radiation), sensor/pre-amplifier electronic processes (thermal and electronic noise) and quantization noise (indefinite photon count). These three processes generate Rayleigh, Gaussian and Poisson standard deviation of noise in images. Unlike medical imaging, the type of noise manifestation in remote sensing is not much conventional owing to the erratic nature of atmospheric perturbations: absorption and scattering, low illumination, haze, fog and electronic fluctuations. However, it could be stated from literature, that most often the noise in remote sensing images is generally assumed to have Gaussian distribution with normal distribution, zero mean and a prior known variance.1,4,11
Remote sensing technology generates variety of images like satellite images: SAR (Synthetic Aperture Radar) images, AVIRIS, IKONIS data set, PAN (Panchromatic images), Multi-spectral and Hyper-spectral images and many more. High resolution PAN images are required to be fused with high spectral resolution MS images. The quality of the source images directly affects the quality of the fused images. Infrared and Visible images are fused together to enable the visualization of the concealed weapons by sensing the thermal radiations emitted by the metallic objects. SAR images are generally prone to speckle noise, Gaussian Noise is generally found in PAN images. The role of Gaussian becomes of great importance in case of vegetation mapping as the image details are inherently masked which are required to be extracted for image interpretation and analysis. The various spreads and colours and indexing is used in vegetation mapping image sources, to predict entire set of various estimates for several attributes of vegetation mapping. Similarly in case of PAN images, the quality of these images is significant as they required to be fused with MS and HS data. Also, as an independent data source, PAN images, provide the high resolution information, which helps in assessing the structural formation and planning of various sectors of urban planning and development.
Following are the few types of remote sensing images.30
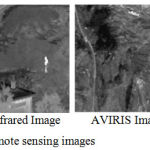 |
Figure 3.8: Examples of Remote sensing images.
|
These versatile set of data sets provides extensive range of application in agriculture: vegetation mapping, aerospace and planetary monitory, meteorology, urban planning, crop yield and estimation and military surveillance.
Increasing availability of remotely sensed images due to the rapid advancement of remote sensing technology expands the horizon of our choices of imagery sources. Due to the expanded horizon for availability of variety of imageries varying in spectral, spatial, radioactive and temporal characteristics has lead to a very sophisticated form of vegetation mapping, forest mapping and land cover estimation. In satellite imaging, a large assortment of satellites is mounted on spacecrafts to continuously record the information about earth. These remote sensors are operational from the microwave to the ultraviolet region of the electromagnetic spectrum, provides a wide range of data depicting the information about various areas of earth.
Besides this, remote sensing images find applications in assessment of the conditions of the rural roads, designing virtual maps for remote sensing mobile applications, discovering ancient archaeological sites, improving traffic control, monitoring roads and terrain for accidents, government decision making, civil defense operations, police and Geographic Information Systems, disaster management and recovery.1,6,7
Since the high-resolution and high-quality remote sensing images are crucial to feature extraction, information analysis and intellectual interpretation, the noises should be reduced to improve the quality of remote sensing images before further analysis.
Besides medical imaging, noise is inherent nuisance in almost type of data sets for instance natural images, remote sensing images, infrared and visible images and many more.
Conclusion
Radiology has emerged as an integral part of medical sciences, therefore precise and accurate readability of these graphs these mandatory for speedy and timely diagnosis. However, image noise contaminates the images, mask and corrupt the information and make it unsuitable for future analysis and interpretation. Noise also invariably distorts the image readability and comprehension in remote sensing images as well. Therefore image denoising becomes of vital importance in order to ensure precise information extraction and analysis. In this article the scenario of occurrence of noise in medical imaging and remote sensing imaging has been discussed. It can be seen that Gaussian noise is most prevalent and generic noise prevailing various types of images. It is mostly studied type of noise in real time imaging applications. While designing a specific denoising algorithm it is obligatory to understand the basic outlook, mechanisms and types of noise and their sources. This article is primarily dedicated to develop an understanding towards the importance and significance of various types of imageries, the type of information relevant and henceforth its denoising to interpret that information in an efficient manner.
References
- Zhenghua H., Zhang Y., Li Q., Zhang T., Sang N and Hong H. Progressive Dual-Domain Filter for Enhancing and Denoising Optical Remote-Sensing Images. IEEE Geoscience and Remote Sensing Letters. 2018;15(5):759-763.
CrossRef - Dance D. R., Christofides S. , Maidment A. D. A., McLean I. D and Ng. K. H. Diagnostic radiology physics. International Atomic Energy Agency. 2014.
- Flower., Maggie A., ed. Webb’s physics of medical imaging. CRC Press. 2012.
- Na W., Shang Y., Chen Y., Yang M., Zhang Q., Liu Y and Gui Z. A Hybrid Model for Image Denoising Combining Modified Isotropic Diffusion Model and Modified Perona-Malik Model. IEEE Access. 2018.
- Chong Y and Chen X. Remote sensing image denoising application by generalized morphological component analysis. International Journal of Applied Earth Observation and Geo in formation. 2014;33:83-97.
CrossRef - Landgrebe., David A andMalaret Erick . Noise in remote-sensing systems: The effect on classification error. IEEE Transactions on Geoscience and Remote Sensing. 1986;2:294-300.
CrossRef - Peng L ., Huang F., Li G and Liu Z. Remote-sensing image denoising using partial differential equations and auxiliary images as priors. IEEE Geoscience and Remote Sensing Letters. 2012;9(3):358-362.
CrossRef - Rafael G., Richard C., Woods E and Steven L. E . Digital image processing using MATLAB. Upper Saddle River New Jersey Pearson-Prentice-Hall. 2004;624.
- William H. R and Russell E. R. Medical imaging physics. John Wiley & Sons. 2003.
- Ma S., Ma G., Sánchez G., Vidal V., Verdu G., Verdú G., Mayo P and Rodenas F . Medical image restoration with different types of noise. In Engineering in Medicine and Biology Society (EMBC). 2012 Annual International Conference of the IEEE. 2012;4382-4385. IEEE.
- Søren O. I. Noise variance estimation in images. In 8th SCIA. 1993.
- Julia B. F and Keat N. Artifacts in CT recognition and avoidance. Radiographics. 2004;24(6):1679-1691.
CrossRef - Angela C and Müller P. Introduction to computed tomography. DTU Mechanical Engineering Kongens Lyngby Denmark. 2011.
- https://www.foot-pain-explained.com/why-do-my-heels-look-almost-transparent-and-have-so-many-tiny-cracks-on-xray-the-tops-of-my-toe-bones-too.html.
- http://cortisone-info.com/Side-Effects/Bone.
- Jiang H. Computed tomography principles design artifacts and recent advances. Bellingham WA: SPIE. 2009.
- https://openi.nlm.nih.gov/detailedresult.php?img=PMC2929421_crg0004-0229-f04&req=4.
- http://erj.ersjournals.com/content/18/1/196.
- http://www.sprawls.org/ppmi2/NOISE/#EFFECT%20ON%20VISIBILITY.
- http://www.sprawls.org/ppmi2/NOISE.
- https://emedicine.medscape.com/article/2109054-overview.
- https://www.sciencedaily.com/releases/2009/07/090714085812.htm.
- Pasha R., Sandström M., Schnieder H., Långström B., Maripuu E., Bengtsson E and Bergström M. Noise correlation in PET, CT, SPECT and PET/CT data evaluated using autocorrelation function a phantom study on data, reconstructed using FBP and OSEM. BMC medical imaging. 2005;5(1):5.
CrossRef - Riddell C., Carson R. E., Carrasquillo J. A., Libutti S. K., Danforth D. N, Whatley M., Bacharach S. L. Noise Reduction in Oncology FDG PET Images by Iterative Reconstruction: A Quantitative Assessment. J Nucl Med. 2001;42(9):1316-1323.
- McRobbie D. W., Moore E. A., Graves,M. J and Prince M. R. MRI From Picture to Proton. Journal of Magnetic. 2008.
- https://en.wikipedia.org/wiki/Magnetic_resonance_imaging [accessed on 10.12.17]
- Bharat B, Zerrin F. Y., Victor M. H and James Hyde S. Functional connectivity in the motor cortex of resting human brain using echo‐planar MRI. Magnetic resonance in medicine. 1995;34(4):537-541.
CrossRef - OGNJEN M., TUBA E and BACANIN N. Medical Ultrasound Image Speckle Noise Reduction by Adaptive Median Filter.
- Ayush D., Goyal B.,Agrawal S and Sohi B. S . Anatomical and Functional Imaging Modalities A Brief Review , [International Conference, IRSD, 6-7th Nov. NITTTR, CHANDIGARH]. 2017.
- https://www.mathworks.com/matlabcentral/fileexchange/67703-image-processing-dataset-for-color-grey-image-fusion–image-blending–image-denoising–enhancement.
- Ayush D., Goyal B., Agrawal S and Kamal C. A. Efficient fusion of osseous and vascular details in wavelet domain. Pattern Recognition Letters. 2017;94:189-193.
CrossRef - Ayush D, Goyal B and Agrawal S. From multi-scale decomposition to non-multi-scale decomposition methods: a comprehensive survey of image fusion techniques and its applications. IEEE Access. 2017;5:16040-16067.
CrossRef - Bhawna G., Dogra A., Agrawal S and Sohi B. S. Dual way residue noise thresholding along with feature preservation. Pattern Recognition Letters. 2017;94:194-201.
CrossRef - Bhawna G., Dogra A., Agrawal S and Sohi B. S. Two-dimensional gray scale image denoising via morphological operations in NSST domain & bitonic filtering.” Future Generation Computer Systems 82 (2018): 158-175.
- Anchal, Bhawna Goyal, Ayush Dogra, and Sunil Agrawal. “An Efficient Image Denoising Scheme for Higher Noise Levels using Spatial Domain Filters. Biomedical and Pharmacology Journal. 2018;11(2):625-634.
CrossRef - Ayush D., Goyal B and Agrawal S. Osseous and digital subtraction angiography image fusion via various enhancement schemes and Laplacian pyramid transformations. Future Generation Computer Systems. 2018;82:149-157.
CrossRef

