
Manuscript accepted on :28-Aug-2018
Published online on: 05-09-2018
Plagiarism Check: Yes
Reviewed by: Zhen Ren
Second Review by: Muhammad Shahzad Aslam
Final Approval by: Juei-Tang Cheng
M. Ambika and S. Selva Kumar
Department of Electrical and Electronics Engineering Amrita School of Engineering, Coimbatore Amrita Vishwa Vidyapeetham, India.
Corresponding Author E-mail: ambikaraghav@gmail.com
DOI : https://dx.doi.org/10.13005/bpj/1513
Abstract
Electrical Capacitance Tomography (ECT) is an imaging technique which generates a cross-sectional image representing the internal permittivity distribution based on external capacitance measurements. It possesses the advantages of being non-radioactive, non-intrusive, non-invasive, high imaging speed and low cost over the conventional imaging techniques. Inter-electrode capacitance measurements are done by exciting electrodes placed around the non-conductive dielectric medium cylinder inside which, the material to be imaged is placed. This paper emphasizes on modelling and calibrating an electrical capacitance tomography sensor using ANSYS APDL with medium as air, water and extending the procedure for normal bone and cracked bone. ECT sensor is modelled by mounting 12 electrodes symmetrically outside the cylinder. The cylinder is made up of Polyvinyl Chloride (PVC) which is non-conductive dielectric medium while the electrodes are made up of Copper (Cu) which is conductive. The electrodes are excited in pairs and the potential distribution which is based on permittivity of the medium is analysed using ANSYS and the capacitance between the electrodes were calculated. The entire electrode modelling, calibration and capacitance measurement for the simulated bone model with and without crack is presented in this paper.
Keywords
ANSYS;Capacitance Tomography; ECT Sensor; Electrical Medical Imaging
Download this article as:| Copy the following to cite this article: Ambika M, Kumar S. S. Modeling and Calibration of Electrical Capacitance Tomography Sensor for Medical Imaging. Biomed Pharmacol J 2018;11(3). |
| Copy the following to cite this URL: Ambika M, Kumar S. S. Modeling and Calibration of Electrical Capacitance Tomography Sensor for Medical Imaging. Biomed Pharmacol J 2018;11(3). Available from: http://biomedpharmajournal.org/?p=22196 |
Introduction
ECT is used extensively in oil and gas industries for measuring flow pattern, temperature and level of fluids flowing in pipes and for the monitoring of bubbles in the oil flow. An acceptable tomographic technique for medical application is the one which should possess the following properties viz. non-invasive, non-intrusive and radiation free which ECT possesses over the conventional imaging techniques. Conventional medical imaging techniques such as Computed Tomography (CT), X-ray imaging makes use of radiations putting human under risk of cancer. ECT therefore, can be a replacement for the existing techniques.
The human skeleton forms the framework of our body and has various sizes and shapes, and serves multiple functions. Thigh bone is a long bone which is focused in this paper. The term tomography refers to the process of exploring the internal characteristics of a specified region through measurements related to the internal characteristics of the specified area. Tomographic techniques can be used to measure the internal characteristics of a bone to check its condition like whether it is fractured or not and if fractured to find the depth and the position of the crack. Electrical Capacitance Tomography (ECT) is a process of recovery of the image depending on the capacitance change technique. An ECT measures the capacitance from multiple electrodes with the component under test acting as the dielectric medium. Image reconstruction algorithms can be used after signal conditioning to get the actual image from the values of capacitance measured.
Specifications of ECT sensor and ECT system compositions have been discussed.7,10 ECT system is calibrated using material of known permittivity.8 Charge discharge measurement method of ECT system has been evaluated.4 Applications of alternating current based ECT in sensing dielectric medium like level of urea, ash and water is in practice.3 Also temperature detection of solid and liquid5 are tried with ECT in industries. ECT sensor modelling is done using ANSYS,6 COMSOL multi physics in 2D and 3D.13 Designing, modelling and analysis of a three phase induction motor drive,2 a three phase squirrel cage induction motor10 have been done using ANSYS. ECT sensors for gas–oil– water stratified flow measurement,9 imaging the dielectric/conductive gas/liquid distributions in petroleum industries12 have been developed. Eight electrode based ECT sensor for bone imaging has been implemented.14 A numerical modelling of crack in femur shaft bone using ANSYS has been done.1
Identifying the research gap based on the literature reported, this paper focuses on modelling and calibration of an ECT sensor, which is used for normal and cracked bone and measurement of capacitance values. The number of electrodes defines the resolution and speed for an ECT sensor. Therefore, 12-electrode ECT sensor is designed in this paper while 8-electrode one is being widely used in industrial applications. The ECT sensor is calibrated by using media of low and high permittivity viz. air and water with permittivity 1 and 80 respectively. The calibrated sensor is used for 2-D bone structure without and with crack, to check for the potential distribution. On selecting material the sensor is then modelled. The model is then meshed which determines the quality of post processing. During post processing the input is given as voltage and its distribution is plotted using plotting tool in ANSYS. The potential distribution varies with respect to the permittivity. The capacitance values are calculated using ANSYS for all the 4 media.
Ect Sensor Modelling Using Ansys
The relationship between capacitance and dielectric properties can be given as follows: any two adjacent conductors can be considering as a capacitor, and different dielectric properties between the conductors will give different capacitance values.
As given in Equation (1), the capacitance measurement is determined by:
![]()
Capacitance and voltage are related as given in Equation (2)
![]()
A 12-electrode ECT sensor has 12 copper plates as electrodes mounted on a hollow PVC tube as shown in Fig1. Bone is to be placed inside this hollow portion. For calibration purpose we take air and water with known relative permittivity. After calibration, 2-D model of bone without and with crack with surrounding medium as air within the hollow portion is simulated with the ECT sensor.
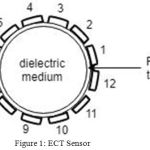 |
Figure 1: ECT Sensor.
|
Electrodes are excited in the sequence shown in Table 1.
Table 1: Electrode excitation sequence.
| Electrode Excited | Capacitance measured |
| 1 | C12,C13,C14,C15,C16,C17,C18,C19,C110,C111,C112 |
| 2 | C23,C24,C25,C26,C27,C28,C29,C210,C211,C212 |
| 3 | C34,C35,C36,C37,C38,C39,C310,C311,C312 |
| 4 | C45,C46,C47,C48,C49,C410,C411,C412 |
| 5 | C56,C57,C58,C59,C510,C511,C512 |
| 6 | C67,C68,C69,C610,C611,C612 |
| 7 | C78,C79,C710,C711,C712 |
| 8 | C89,C810,C811,C812 |
| 9 | C910,C911,C912 |
| 10 | C1011,C1012 |
| 11 | C1112 |
Electrode is excited by giving 20V and the other electrode is grounded for that pair for example notation C110 means electrode 1 is excited and electrode 10 is grounded. The outputs obtained are 66 images of potential distribution and 66 values of capacitance for 12-electrode ECT sensor according to Equation (3):
![]()
The Modeling using ANSYS
The design process for 12-electrode ECT sensor model consists of pre-processing, geometry modelling, solution and post processing. In pre-processing, preference is chosen, element is selected and material properties are defined. In geometry modelling, structure is modelled with electrode length as 14.9754mm, length of spacing between electrodes as 3.7439mm, inner and outer diameters of PVC tube as 70mm and 71.5mm respectively and meshed. In post processing, electric potential for the solved model is plotted and the capacitance values for the electrode pair are calculated.
ECT Sensor for Air and Water
ECT sensor was modelled and meshed. The voltage distribution plots for the pairs (2, 8), (2, 11), (3, 8) and (3, 11) for air and water as medium are as shown in Table 2.
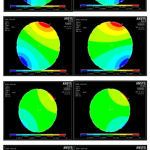 |
Table 2: Voltage distribution plots for air and water.
|
Model of Bone
For modelling femur bone model in 2-D is taken. Preferences is selected as electric, element type is selected as electrostatic and the material properties of bone viz. Elastic modulus, Poisson’s ratio, density, relative permittivity, conductivity are defined for the bone. ECT sensor with bone modelled within it is as shown in Fig 2.
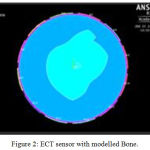 |
Figure 2: ECT sensor with modelled Bone.
|
Model of Bone without Crack
Outline of the bone was drawn by defining coordinates for nodes and connecting them via straight lines and arcs. Bone area was created by filling the space within the lines of the outline already created. Sensor was modelled around the bone. Air was created around the bone after 2-D bone was modelled by creating an area by lines between inner circle of tube and outline of bone. The model was then meshed. A new analysis was chosen; pair by pair voltages were given for excitation and solved to get 66 outputs. Outputs for 4 combinations in which prominent difference in distribution is observed are shown in Table 3.
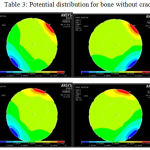 |
Table 3: Potential distribution for bone without crack.
|
Bone with Crack
Bone with crack was modelled by modelling a 2-D bone and incorporating a crack within it. Crack was incorporated by modifying the existing node structure by adding and deleting nodes and joining them by straight lines and arcs to get the desired structure. Cracked bone area was created by filling lines of the outline. Calibrated sensor was modelled around the cracked bone as shown in Fig 3.
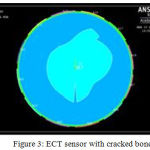 |
Figure 3: ECT sensor with cracked bone.
|
The model is then solved to get 66 outputs out of which the 4 prominent outputs are shown in Table 4.
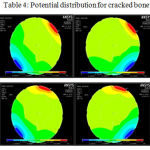 |
Table 4: Potential distribution for cracked bone.
|
Results and Discussion
The variation of capacitance measured for 7 pairs of electrode excitation involving the electrodes 2 and 3 for normal bone and cracked bone are as shown in Fig 4. The normal bone graph has a higher level of capacitance than the cracked bone. The air gap in the cracked bone has influenced the change in the capacitance when compared to the normal bone. Also the capacitance variation is highly notable for excitation of electrodes near the crack namely electrode numbers 9, 10 and11 From Fig 4 it can be visualized from the cracked bone graph, there are additional dips due to variation in capacitance in those electrode pairs where the ground electrode is close to the crack. Since the crack is present between the electrodes 8 and 11, the additional dips as compared to the normal bone graph occur in this region. This variation of capacitance can be used for the reconstruction of the image using suitable algorithms.
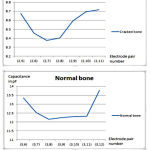 |
Figure 4: Plot of variation in capacitance.
|
Conclusions
Electrical capacitance tomography and its application for imaging field starts with the sensor design and its orientation. For industrial applications 8 electrode ECT sensor is used while for medical applications since we need more resolution 12 electrode ECT sensor is preferred which may result in acceptable compromise of reduced speed. The output values obtained from ANSYS are capacitance values proportional to the permittivity change within. In order to design such an ECT sensor for bone imaging practically calibration is required, for which ANSYS APDL is used in which media of known permittivity are used as dielectric media in this paper. Using ANSYS, the sensor is modelled and simulated. Media used are air and water with permittivity 1 and 80 respectively. It is concluded that for medium with lowest permittivity i.e. air, the voltage distribution is even whereas for medium with highest permittivity i.e. water, the distribution is not spread evenly and is restricted. After the calibration, the sensor is assigned with the model of normal and cracked bone. Based on the plots of potential distribution and capacitance variation which changes with change in permittivity, it is concluded that such a sensor can be a suitable option for bone imaging and this sensor can be used to differentiate a fractured bone from normal bone. The capacitance values calculated using ANSYS for all the 4 media could be used for image reconstruction in future work.
References
- Mohammad S.A and Ruslizam D. Analysis of Crack Propagation in Human Long Bone by Using Finite Element Modeling. AIP Conference Proceedings. 2017;100014-1–100014-5.
- Prasob N, Kumar P, Isha T.B. Inter-turn short circuit fault analysis of PWM inverter fed three-phase induction motor using Finite Element Method. Circuit Power and Computing Technologies (ICCPCT) 2017 International Conference on. 2017;1-6.
- Manikandan and Sathiyamoorthy S. Level Measurement of ASH Handling System Using AC ECT. World Applied Sciences Journal. 2016;34:1338-1342.
- Manikandan and Sathiyamoorthy S. Performance Analysis of AC-DC Electrical Capacitance Tomography. International Journal of Innovation and Scientific Research. 2016;25:540-544.
- Manikandan and Sathiyamoorthy S. Temperature Measurement of Various Permittivity Medium by AC ECT. International Journal of Scientific Engineering and Applied Science. 2016;2:2395-3470.
- Manikandan and Sathiyamoorthy S. Modeling and Implementation of AC Electrical Capacitance Tomography. Circuits and Systems. 2016;7:3818-3830.
CrossRef - Ruzairi H.j, Rahim A et al. A Review: Tomography Systems in Medical and Industrial Processes. Journal Technologies. 2015;73:1–11.
- Soji S., Manikandan K and Sathiyamoorthy S. Electrical Capacitance Tomography System. International Research Journal of Emerging Trends in Multidisciplinary. 2015;1:2395-4434.
- Sun and Yang W. A dual-modality electrical tomography sensor for measurement of gas–oil–water stratified flows. Measurement. 2015;66:150-160.
CrossRef - Ren. Exploration of medical applications of electrical capacitance tomography. Ph.D. thesis, University of Manchester. 2015.
- Rajiv A.N, Ashwanth V.A, Sa R and Dr. Thampatty S.K.C. Modelling and analysis of rotor bearing fault in a three phase squirrel cage induction motor using ANSYS® Maxwell 2D. International Journal of Applied Engineering Research. 2015;10:3612-3616.
- Li and Soleimani M. Imaging conductive materials with high frequency electrical capacitance tomography. Measurement 2013;46:3355–3361.
CrossRef - Zimam A, Mohamad E.J., Rahim R. A., Ling L.P. Sensor Modeling For An Electrical Capacitance Tomography System Using Comsol Multiphysics. Journal Technologies. 2012;55:33-47.
- Abraham B and Anitha G. Designing of Lab View Based Electrical Capacitance Tomography System for the Imaging of Bone Using NI ELVIS and NI USB DAQ 6009. Bonfring International Journal of Power Systems and Integrated Circuits. 2012;2:2277–5072.
CrossRef

