
Manuscript accepted on :13-Sep-2018
Published online on: 19-09-2018
Plagiarism Check: Yes
Reviewed by: M. Mohan Varma
Second Review by: Abhinav Kanwal
Final Approval by: Dr. Beatrice O. Ondondo
Maha M. Turki and Faiza M. Abdul-Ameer
Department of Prosthodontics, College of Dentistry, University of Baghdad.
Corresponding Author E-mail: maha_mishaal@yahoo.com
DOI : https://dx.doi.org/10.13005/bpj/1524
Abstract
Scleral acrylic resin is widely used to synthesize ocular prosthesis. However, the properties of this material change over time, thus requiring the prosthesis to be refabricated. Many studies were conducted to improve these properties by reinforcing this material with nanoparticles. This study aims to evaluate the effect of silver nanoparticle powder on the mechanical properties (transverse flexural strength, impact strength, shear bond strength, surface microhardness, and surface roughness) of scleral acrylic resin used for ocular prostheses. Two concentrations were selected from the pilot study and evaluated for their effects on scleral acrylic resin properties. According to the pilot study, 0.01 and 0.02wt% AgNPs powder improved the transverse flexural strength, microhardness, and surface roughness compared with other percentages. The specimens in the main study were divided into (3) main groups, (50) specimens without additives (control group A), (50) experimental specimens (with 0.01wt% AgNPs group B), and (50) experimental specimens (with 0.02 wt% AgNPs group C). Each group was subdivided into (5) equal subgroups depending on the tests used. The data were studied using one way ANOVA and post hoc LSD test. At 0.01 wt% AgNPs addition, the mean values of transverse flexural strength insignificantly increased (p> 0.05), and those of impact strength and shear bond strength significantly increased (p< 0.05) compared with those of the control group. At 0.02 wt% AgNPs addition (group C), the mean value of transverse flexural strength significantly increased (p< 0.05), that of impact strength insignificantly increased (p> 0.05), and that of shear bond strength increased with high significance (p< 0.01) compared with those of the control group. Group C showed insignificant increase in the mean values of transverse flexural strength, impact strength, and shear bond strength (p. 0.05) compared with group B. The scleral acrylic resin added with 0.01 and 0.02 wt% AgNPs showed insignificant increase in microhardness and insignificant decrease in surface roughness. The addition of AgNPs powder in both concentrations improved the mechanical properties of scleral acrylic resin used for ocular prostheses.
Keywords
Modified Curing Protocol; Ocular Prosthesis; Silver Nanoparticles; Scleral Acrylic Resin
Download this article as:| Copy the following to cite this article: Turki M. M, Abdul-Ameer F. M. Influence of Silver Nanoparticles on the Specific Properties of Acrylic Resin for Ocular Prosthesis. Biomed Pharmacol J 2018;11(3). |
| Copy the following to cite this URL: Turki M. M, Abdul-Ameer F. M. Influence of Silver Nanoparticles on the Specific Properties of Acrylic Resin for Ocular Prosthesis. Biomed Pharmacol J 2018;11(3). Available from: http://biomedpharmajournal.org/?p=22801 |
Introduction
Defects of the face result from congenital causes, surgical resection, and trauma and should be corrected surgically to improve the aesthetic and function of the patient. However, the prosthetic rehabilitation is important when the defect cannot be corrected surgically because of the size and location of the defect, to restore the psychological and physiological health of the patient.1
Ocular prosthesis is one of the maxillofacial prostheses that are used to restore the quality of life and the appearance of the patient for social and psychological adaptation.2
Acrylic resin has specific properties, such as low cost, good adaptation, easy fabrication, good biocompatibility, easy coloring, and good esthetic results, which make it the best material for ocular rehabilitation.3
Despite these advantages, this material undergoes property deterioration, thus requiring refabrication of the prosthesis. Several studies were conducted to improve these properties by reinforcing the polymer with NPs, which provide the former with new properties such as the resistance of NPs and the flexibility of polymer.4
Silver nanoparticles have antimicrobial activity against (Gram positive and negative bacteria, protozoa, fungi, and viruses) that has been improved for many years. Adding AgNPs into polymer provides the latter with antimicrobial activity for maxillofacial fabrication.5
This study aims to determine the appropriate percentage of AgNPs and to study the effect of AgNPs powder addition on the transverse flexural strength, impact strength, shear bond strength, surface microhardness, and surface roughness of scleral acrylic resin used for ocular prostheses.
Materials and Methods
Scleral acrylic resin (heat cure scleral polymer (J-510) was mixed with non-crossed linked scleral monomer (J-570)) (Techno vent Ltd., South Wales, UK). Silver nanoparticles (average particles size <20 nm) (MK Nano, Canada) were used for reinforcement. Three various plastic shapes were constructed by cutting plastic plate with shape and dimension according to the required tests by using laser cutting machine for mold preparation (JL-1612, Jinan Link Manufacture and Trading Co., Ltd., China). For the tests on transverse flexural strength, impact strength and microhardness, the dimensions of specimens were 80mm x 10 mm x 4 mm length, width, and thickness, correspondingly.6–8 For the surface roughness test, the dimensions of specimens were 65 mm x 10 mm x 2.5 ± 0.1 mm length, width, and thickness, correspondingly. 9
For shear bond strength test, a space with dimension of (25 mm x 25 mm x 3 mm length, width, and depth, correspondingly) was created by making two blocks of scleral acrylic with dimensions of 75 mm x 25 mm x 5 mm, length, width, and depth correspondingly) with stopper of depth of 3 mm10,11 and putting one block over the other for relining materials.12
Molds for transverse flexural strength, impact strength test, microhardness test and surface roughness were prepared using the conventional technique for complete denture (Figures 1 A and B).13 The scleral acrylic heat cure was blended, packed, and cured according to manufacturer’s instructions. After curing was completed, the specimens were finished, polished, conditioned in distilled water, and stored in the incubator at 37 °C for 48 h before the test was performed.9
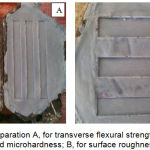 |
Figure 1: Mold preparation A, for transverse flexural strength, impact strength and microhardness; B, for surface roughness.
|
The mold for shear bond strength was prepared by creating two blocks of scleral acrylic with dimensions 25 mm × 25 mm × 3 mm length, width, and depth, correspondingly, which were placed one over the other. The whole specimen (two blocks) was invested into silicone to create a template for the final specimen. Scleral acrylic resin (before and after the addition of AgNPs) filled the formed space, and curing was then conducted (Figures 2 A, B, and C).
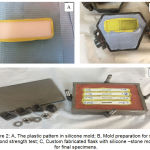 |
Figure 2: A, The plastic pattern in silicone mold; B, Mold preparation for shear bond strength test; C, Custom fabricated flask with silicone –stone mold for final specimens.
|
A pilot study was initially conducted with 0.006, 0.01, 0.02, and 0.05 wt% AgNPs added to scleral acrylic resin and compared with 0.00 wt% AgNPs (control group). AgNPs were first weighted with digital electronic balance (Germany, sensitivity 0.0000g), added into the monomer, and broken down into singular nanoparticles using probe sonication apparatus (Soniprep-150, England) for 3 min. The mixture was cooled by putting the container in a vessel with iced water because sonication could excessively heat the liquid and consequently damage the material (Figures 3 A and B).14
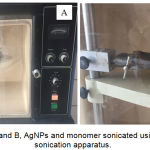 |
Figure 3: A and B, AgNPs and monomer sonicated using a probe sonication apparatus.
|
The monomers with AgNPs powder were immediately mixed with acrylic powder (the weight of AgNPs powder must subtracted from the weight of acrylic powder) to reduce the possibility of particle aggregation and phase separation. Mixing was conducted in a clean and dry glass mug using a wax knife for 30 s. The mixture was then enveloped until dough stage was reached.
The results of the pilot study revealed that adding 0.01 and 0.02 wt% AgNPs improved the transverse flexural strength, microhardness, and surface roughness of the tested scleral acrylic resin specimens.
The mold was brushed with separating medium and left to dry. The dough mix was collected then packed into the mold. The flask were closed and placed under gradual press. Finally, the two halves closed together until metal to metal contact and were left for 2 min under 100 bar before clamping.15 The flask was clamped, left for bench polymerization for 30 min, and then transferred to the water bath for complete polymerization cycle. A modified curing protocol referred to as reverse curing was followed. In this technique, the flask was placed in boiling water at 95°C for 20 min, cooled for 20 min, and placed back in water boiling at 100°C for 20 min.[16] The flask was then cooled, the specimens were removed from the mold, and finishing and polishing were finally conducted (Figures 4 A, B, and C).
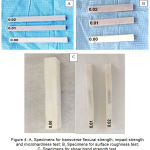 |
Figure 4: A, Specimens for transverse flexural strength, impact strength and microhardness test; B, Specimens for surface roughness test; C, Specimens for shear bond strength test.
|
A total of 150 specimens of scleral acrylic resin were fabricated and divided into (3) main groups; 50 specimens without additives (control), 50 experimental specimens (with 0.01 wt% AgNPs) and 50 experimental specimens (with 0.02 wt% AgNPs). Each group was subdivided into five equal subgroups depending on the conducted tests (transverse flexural strength, impact strength, shear bond strength test, microhardness, and surface roughness) with 10 specimens for each test.
Transverse flexural strength test: As recommended by (ISO, 2010),6 a computerized universal testing machine (WDW-20, Laryee Technology Co., Ltd., China) was used for testing. A 100 Kg load was applied with a cross head speed of 5 mm/min by a bar located in the center between the supports to ensure bending until fracture happened. The strength was measured using formula:
Transverse strength= 3P x l / 2b x d2 N/mm2,17
Where:
P: Peak load (N)
I: Span length (mm)
b: Specimen width (mm)
d: Specimen thickness (mm)
Impact strength test: As recommended by ISO 179, 20007 with impact testing instrument of Charpy type (INC. USA) used for testing. The specimen was located horizontally at its ends and was hit with a free swinging pendulum. Testing capacity of pendulum 2 joules was used. The scale reading gave the impact energy (in joules) absorbed to fracture the specimen when hit by a sudden shot.18 The strength of the impact was calculated in KJ/m2 using the following formula:
Impact strength = (E/B x D) x1000KJ /m2,17
Where:
E: Impact absorbed energy (J)
B: Width of the specimens (mm)
D: Thickness of the specimens (mm)
Shear bond strength test: Computerized universal testing machine (WDW-20, Laryee Technology Co., Ltd., China) was used to test shear bond strength by using load of 100 Kg and cross head speed of 0.5 mm/min.19 The shear bond strength can be calculated by using this formula:-
Bond strength (N/mm2) = (Maximum load) / (Cross sectional area).
Microhardness test: As recommended by Standard (2011),8 Vickers microhardness tester (HVS-1000, China) was used to test the surface hardness using a micro hardener with a 25 g load for 10 s. Five measurements were collected, and the mean of these five measurements represents the surface hardness.15
Surface roughness test: A portable digital roughness profilometer tester was used (Time 3200/TR200, China). The diamond stylus of profilometer moves in close with surface of the specimen at three different places to obtain three readings. The mean value of the three readings represents the roughness.20
Scanning electron microscope (SEM), X-ray diffraction analysis (XRD) and Fourier transform infrared (FTIR) analyses were each performed on three specimens (one specimen before the addition of AgNPs and two specimens after the addition of 0.01 and 0.02 wt% AgNPs).
Results
SEM, XRD, and FTIR Analyses
The SEM results for the fracture surfaces of specimens for impact strength test before and after the addition of 0.01 and 0.02 wt% AgNPs indicated the thorough dispersion of the AgNPs into the scleral acrylic resin matrix (no agglomeration was observed) (Figures 5 A, B, and C).
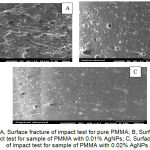 |
Figure 5: A, Surface fracture of impact test for pure PMMA; B, Surface fracture of impact test for sample of PMMA with 0.01% AgNPs; C, Surface fracture of impact test for sample of PMMA with 0.02% AgNPs.
|
The XRD results show that pure PMMA displays a typical amorphous structure. The PMMA/AgNPs composites had also the same amorphous structure, but no diffraction peak was found in the crystal structure of AgNPs (Figure 6).
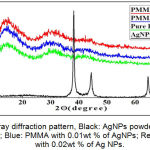 |
Figure 6: X-ray diffraction pattern, Black: AgNPs powder; Green: Pure PMMA; Blue: PMMA with 0.01wt % of AgNPs; Red: PMMA with 0.02wt % of Ag NPs.
|
The average particle size of Ag NPS can be calculated by using XRD results for the well-known Scherrer’s formula established by Paul Scherrer. The result showed that the nanoparticles size is < 20 nm.
D = (L λ) / (β cosθ), (Scherrer’s formula)21
Where:
D: Average particle size
L: Constant related to crystalline shape, normally taken as 0.94
β: Full width half max (FWHM) for peak of XRD
λ: Wavelength of the target that use in XRD instrument (1.54056oA)
oA: Interplanar spacing between the atoms
The FTIR results revealed shifting in the absorption peaks of tested AgNPs powder, pure PMMA powder, nanocomposite PMMA with 0.01 wt% AgNPs, and nanocomposite PMMA with 0.02 wt% AgNPs. Hence, physical interaction but no chemical reaction occurred between the saturated forms of PMMA and AgNPs.
Transverse flexural strength
Descriptive statistics, One-way ANOVA, and LSD analysis are presented in Table 1. Compared with that of the control group, the transverse flexural strength insignificantly increased in the resin added with 0.01 wt% AgNPs (p> 0.05) and significantly increased in the resin added with 0.02 wt% AgNPs (p< 0.05) as shown in Table 1.
Table 1: Descriptive statistics, One-way ANOVA and LSD for transverse flexural strength test among groups.
| A | B | C | ||||||
| Control
0.00wt% AgNPs |
with
0.01wt% AgNPs |
with
0.02wt% AgNPs |
ANOVA
F-test |
P.
Value |
Compared
group |
MD | P.
Value |
|
| N | 10 | 10 | 10 | A B | -9.6600 | .332 NS | ||
| Mean | 122.880 | 132.540 | 138.060 | B C | -5.5200 | 1.000 NS | ||
| SD | 15.0753 | 9.8405 | 13.7883 | 3.444 | .047 | C A | 15.1800 | .046 S |
| Min. | 108.0 | 121.2 | 121.2 | (S) | ||||
| Max. | 147.6 | 150.0 | 156.0 |
Impact Strength
Descriptive statistics, One-way ANOVA, and LSD analysis are presented in Table 2. Compared with that of the control group, the impact strength of the resin significantly increased after being added with 0.01 wt% AgNPs (p< 0.05) and insignificantly increased after being added with 0.02 wt% AgNPs (p> 0.05) as shown in Table 2.
Table 2: Descriptive statistics, One-way ANOVA and LSD for impact strength test among groups.
| A | B | C | ||||||
| Control
0.00wt% AgNPs |
with
0.01wt% AgNPs |
with
0.02wt% AgNPs |
ANOVA
F-test |
P.
Value |
Compared
group |
MD | P.
Value |
|
| N | 10 | 10 | 10 | A B | -1.4290 | .033 (S) | ||
| Mean | 8.626 | 10.055 | 9.532 | B C | .5230 | .981(NS) | ||
| SD | 1.2113 | 1.2954 | .9859 | 3.809 | .035 | C A | .9060 | .286(NS) |
| Min. | 6.5 | 7.3 | 7.8 | (S) | ||||
| Max. | 10.6 | 12.2 | 11.2 |
Shear Bond Strength
Descriptive statistics, One-way ANOVA, and LSD analysis are presented in Table 3. Compared with that of the control group, the shear bond strength of the resin significantly increased after being added with 0.01 (p< 0.05) and 0.02 wt% AgNPs (p< 0.01) as shown in Table 3.
Table 3: Descriptive statistics, One-way ANOVA, and LSD for shear bond strength test among groups.
| A | B | C | ||||||
| Control
0.00wt% AgNPs |
with
0.01wt% AgNPs |
with
0.02wt% AgNPs |
ANOVA
F-test |
P.
Value |
Compared
group |
MD | P.
Value |
|
| N | 10 | 10 | 10 | A B | -.4541700 | .017 S | ||
| Mean | 1.4973 | 2.0171 | 2.0795 | B C | -.0624000 | 1.000 NS | ||
| SD | .30259 | .36287 | .34237 | 6.947 | .004 | C A | -.5165700 | .006 HS |
| Min. | 1.20 | 1.46 | 1.59 | (HS) | ||||
| Max. | 2.00 | 2.42 | 2.75 |
Surface Microhardness
Descriptive statistics and one-way ANOVA are presented in Table 4. One-way ANOVA showed insignificant difference among the tested groups as shown in Table 4.
Table 4: Descriptive statistics and One-way ANOVA for microhardness test among groups.
| A | B | C | |||
| Control
0.00wt% AgNPs |
with
0.01wt% AgNPs |
with
0.02wt% AgNPs |
ANOVA
F-test |
P.
Value |
|
| 10 | 10 | 10 | |||
| Mean | 48.555 | 50.864 | 48.891 | ||
| SD | 5.2013 | 3.0772 | 3.5027 | .957 | .397 |
| Min. | 40.9 | 47.0 | 43.2 | (NS) | |
| Max. | 54.6 | 55.1 | 56.0 |
Surface Roughness
Descriptive statistics and one-way ANOVA are presented in Table 5. One-way ANOVA showed insignificant difference among the tested groups as shown in Table 5.
Table 5: Descriptive statistics and One-way ANOVA for surface roughness test among groups.
| A | B | C | |||
| Control
0.00wt% AgNPs |
with
0.01wt% AgNPs |
with
0.02wt% AgNPs |
ANOVA
F-test |
P.
Value |
|
| N | 10 | 10 | 10 | ||
| Mean | .847530 | .807160 | .798730 | ||
| SD | .2539755 | .2210155 | .4085059 | .073 | .930 |
| Min. | .5425 | .4805 | .3590 | (NS) | |
| Max. | 1.4455 | 1.2040 | 1.6933 |
Discussion
Ocular prosthesis is used to increase the confidence of patients and restore their psychological and social health. Losing of the eye, congenitally or acquired, negatively affects the life of patients. Scleral heat cure acrylic resins are widely used to fabricate ocular prosthesis because they have suitable characteristics, such as light in weight, compatible to tissues, aesthetic, durable, non-irritating to the tissues of eye socket, and has stable dimensions and low cost.22 Despite these advantages of scleral acrylic resin, the ocular prostheses synthesized from this material require refabrication due to the possible changes in the chemical and physical properties. Many studies were conducted to improve the mechanical and physical properties of scleral acrylic resin by reinforcing it with nanoparticles. The properties of this material were improved due to the addition of NPs.23,24
In this study, AgNPs with concentrations of 0.01 and 0.02 wt% were added to scleral acrylic resin to improve its mechanical properties. SEM results showed that AgNPs were dispersed homogenously and uniformly within the polymer matrix and full gaps between the particles of PMMA. XRD results showed that the pure PMMA displayed a typical amorphous structure. PMMA/Ag composites also have the same structure, but no diffraction peak was found on the crystal structure of AgNPs. This result could be attributed to the relatively low concentration of the AgNPs that were inserted in the PMMA matrix. FTIR results did not report any chemical reaction between these materials. However, a physical reaction occurred because PMMA and AgNPs have a saturated form. This finding indicates that AgNPs modify PMMA structure. FTIR is qualitative and quantitative analysis; hence, its results depend on the amount of materials used during detection.25
The mean values of transverse flexural strength of scleral acrylic resin increased with the addition of 0.01 and 0.02 wt% AgNPs as compared with that of the control group. This finding may be due to the formation of complicated network chains during the curing process of polymer. In addition, NPs decreased the distance of intermolecular space and free space between polymer chains, thus filling the free spaces between chains and attracting resin molecules.26 When the specimens were subjected to stress, this stress was transferred from the polymer (more flexible) to the nanoparticles with higher modulus, rigidity, and stiffness than the former.17
The mean values of impact strength of the resin increased after adding 0.01 wt% AgNPs and decreased when adding 0.02 wt% AgNPs; however, the value remained higher than that of the control group. This phenomenon occurred because adding NPs introduced a mechanical restraint of the matrix by restricting the mobility of the chains, which bonded the particles/polymer, and consequently bringing extra forces for these chains.26 The increase in impact strength is a result of the interfacial bond strength between the matrix and NPs. This result was confirmed by the FTIR findings that indicate a physical interaction between polymer and NPs. The uniform distribution of NPs within the polymer matrix was also confirmed by the SEM results. Meanwhile, the decrease in the mean value at 0.02 wt% AgNPs affected the average distance between single particles (up to 0.5 pm). This distance is important for the stress field around each particle. If the distance surpasses the critical value, then the failure transitions from brittleness to toughness. Therefore, with 0.02 wt% AgNPs, the decrease in inter particles distance lead to the decrease in impact strength.27 The reduction in impact strength when adding 0.02 wt% AgNPs also explained that the continuity of the resin matrix was interrupted when more NPs were added in the polymer matrix after reaching saturation state.28
The mean values of shear bond strength increased after adding 0.01 and 0.02 wt% AgNPs because these nanoparticles work as cross-links between the relined (nanocomposite materials) and original materials (without addition), thus leading to the entire permeation of the bond.29 Visual examination of fracture site revealed the cohesive and mixed modes of failure, indicating a strong bond between the relined and original materials and making the fracture to passed through the original and relined materials.
The mean microhardness value increased at 0.01 wt% AgNPs addition but decreased at 0.02wt% AgNP addition. This increase may be attributed to the inherent characteristics of NPs as having good interatomic bonding with polymer chains,30 dispersing uniformly within the resin matrix, being located at and near the surface as characterized to hardness and stiffness31 and having small size with high microhardness due to their 3D network formation.15 The decreased value at 0.02 wt% is because microhardness (wear resistance) is directly related to the impact strength26 and flexural strength; the material becomes susceptible to fracture when the microhardness increased because of its friability.15
The surface roughness value decreased when adding 0.01 and 0.02 wt% AgNPs because this material is small and can be thoroughly dispersed and thus closed the gaps within the resin matrix.32 In addition, surface roughness is measured from the outer surface and not the inner surface of composite; few particles are involved in the surface of specimens when using small percentages of NPs.14 Surface smoothness also has a direct relationship with the hydrophobicity of the composite system.33
Conclusion
After the limitations of this study were considered, the following conclusions were reached:
The addition of 0.01 wt% AgNPs increased the transverse flexural strength, impact strength, and surface microhardness of scleral acrylic resin.
The addition of 0.02 wt% AgNPs increased the transverse flexural strength and shear bond strength of scleral acrylic resin but reduced its impact strength and surface microhardness, which were still higher than those of the control group.
The addition of AgNPs in both concentrations decreased the surface roughness of scleral acrylic resin.
Acknowledgement
The authors would like to thank the dean and the assistant dean for Scientific Affairs of the College of Dentistry, University of Baghdad for their friendly support and contribution of the available resources and materials to complete this work.
Conflict of Interests
The authors declare no conflict of interests regarding the publication of this paper.
Funding source
The authors have no funding to report.
References
- Goiato M. C., dos Santos D. M., Haddad M. F., Pesqueira A. A., de Dekon C . S. F., Zavanelli A. C. Most frequent tumors in maxillo facial area rehabilitated through surgical reconstruction and prostheses. JCS. 2010;21(2):396-9.
- Artopoulou I. I., Montgomery P. C., Wesley P. J., Lemon J. C. Digital imaging in the fabrication of ocular prostheses. J Prosthet Dent. 2006;95(4):327-30.
CrossRef - Maller U. S., Karthik K., Maller S. V. Maxillo facial prosthetic materials—past and present trends. J Indian Acad Dent Spec. 2010;1(2):42-4.
- Khan A. A., Alam M. M. Synthesis characterization and analytical applications of a new and novel ‘organic–inorganic’ composite material as a cation exchanger and Cd (II) ion-selective membrane electrode polyaniline Sn (IV) tungstoar senate. Reactive and Functional Polymers. 2003;55(3):277-90.
CrossRef - Atay A., Piskin B., Akin H., Sipahi C., Karakas A., Saracli M. Evaluation of Candida albi cans adherence on the surface of various maxillo facial silicone materials. J MYCOL MED. 2013;23(1):27-32.
CrossRef - Iso E. 178, 2010. Plastics–Determination of flexural properties. European Committee for Standardization (CEN). 2010;7- ISO 179-1:2000.
- Standard A. E 384, Standard Test Method for Knoop and Vickers Hardness of Materials. West Con shohocken USA: ASTM International. 2011.
- American Dental Association Specification for denture base polymer guide to dental materials and devices, 7th edition Chicago Illinio is. 1999;12
- Wang R. R., Nguyen T., Boyle A. M. The effect of tray material and surface condition on the shear bond strength of impression materials. J Prosthet Dent. 1995;74(5):449-54.
CrossRef - Yousif A. The effect of disinfection, tray perforation and adhesive usage on the tensile and shear bond strength using two different elastomeric impression materials, (comparative study). A master thesis, prosthetic department, University of Baghdad. 2006.
- Al-Azzawi R. Evaluation of Some Properties of Three Types of Denture Reline Materials with Miconazole (Antifungal agent) Preparation. A master thesis Prosthetic Department, University of Baghdad. 2007.
- Esmael S. Effect of Zirconium silicate nano-powder reinforcement on some mechanical and physical properties of heat cured polymethylmethacrylate denture base materials: M. Sc. thesis the college of dentistry university of Baghdad. 2015.
- Ihab N. Evaluation the effect of modified nano-fillers addition on some properties of heat cured acrylic denture base material. JBCD. 2011; 23(3):23-9.
- Andreotti A. M., Goiato M. C., Moreno A., Nobrega A. S., Pesqueira A. A., dos Santos D. M. Influence of nano particles on color stability, micro hardness and flexural strength of acrylic resins specific for ocular prosthesis. Int J Nanomedicine. 2014;9:5779.
- Jorge J. H., Giampaolo E. T., Vergani C. E., Machado A. L., Pavarina A. C., Carlos I. Z. Bio compatibility of denture base acrylic resins evaluated in culture of L929 cells. Effect of polymerization cycle and post‐polymerization treatments. Gerodontology. 2007;24(1):52-7.
CrossRef - Anusavice K. J., Shen C., Rawls H. R. Phillips’ science of dental materials. Elsevier Health Sciences. 2013.
- Köroğlu A., Şahin O., Kürkçüoğlu I., Dö D., Özdemir T., Hazer B. Silver nano particle incorporation effect on mechanical and thermal properties of denture base acrylic resins. J Appl Oral Sci. 2016; 24(6):590-6.
CrossRef - Issa M. I., Abdul-Fattah N. Evaluating the effect of silver nano particles incorporation on antifungal activity and some properties of soft denture lining material. JBCD. 2015;27(2):17-23.
CrossRef - Goiato M. C., Pesqueira A. A., da Silva C. R., Filho G. H., dos Santos D. M. Patient satisfaction with maxillo facial prosthesis. Literature review. J Plast Reconstr Aesthet Surg. 2009;62(2):175-80.
CrossRef - Monshi A., Foroughi M. R., Monshi M. R. Modified Scherrer equation to estimate more accurately nano-crystallite size using XRD. WJNSE. 2012;2(3):154-60.
CrossRef - Al-Shammari F. A. K. Effect of metal oxides on some mechanical properties of clear acrylic specific for artificial eye. MDJ. 2018;13(1):77-84.
- Alwan S. A., Alameer S. S. The effect of the addition of silanized Nano titania fillers on some physical and mechanical properties of heat cured acrylic denture base materials. JBCD. 2015;27(1):86-91.
CrossRef - Dahham T. The effects of modified zinc oxide nan fillers addition on some properties of heat cure acrylic resin denture base material. A master thesis, College of Dentistry, University of Baghdad. 2014.
- Shaikh T. N., Agrawal S. Qualitative and Quantitative Characterization of Textile Material by Fourier Transform Infra-Red. IJIRSET. 2014;3(1):8496.
- Ke Y., Stroeve P. Polymer-layered silicate and silica nanocomposite. Elsevier. 2005.
CrossRef - Wetzel B., Haupert F., Friedrich K., Zhang M. Q., Rong M. Z. Impact and wear resistance of polymer nanocomposite at low filler content. Polymer Engineering & Science. 2002;42(9):1919-27.
CrossRef - Ahmed M. A., El-Shennawy M., Althomali Y. M., Omar A. A. Effect of titanium dioxide nano particles incorporation on mechanical and physical properties on two different types of acrylic resin denture base. WJNSE. 2016;6(03):111.
CrossRef - Hammad S. M., El-Wassefy N., Maher A., Fawakerji S. M. Effect of nanotechnology in self-etch bonding systems on the shear bond strength of stainless steel orthodontic brackets. Dental Press J Orthod. 2017;22(1):47-56.
CrossRef - Vojdani M., Bagheri R., Khaledi A. A. R. Effects of aluminum oxide addition on the flexural strength, surface hardness, and roughness of heat-polymerized acrylic resin. JDS. 2012;7(3):238-44.
CrossRef - Sato H., Ogawa H. Review on development of polypropylene manufacturing process. Sumitomo Chemical Co, Ltda Process & Production Technology Center Fecha de consulta. 2009;12.
- Cevik P., Yildirim‐Bicer A. Z. The effect of silica and prepolymer nanoparticles on the mechanical properties of denture base acrylic resin. J Prosthodont. 2016.
- Bürgers R., Eidt A., Frankenberger R., Rosentritt M., Schweikl H., Handel G., et al. The anti-adherence activity and bactericidal effect of microparticulate silver additives in composite resin materials. Archives of Oral Biology. 2009;54(6):595-601.
CrossRef

