
Manuscript accepted on :15-Sep-2018
Published online on: 19-09-2018
Plagiarism Check: Yes
Reviewed by: Anjana Goen
Second Review by: Fuad Al-Rimawi
Final Approval by: Dr. Ayush Dogra
Vikram Kehri and Awale R. N.
Department of Electrical Engineering, VJTI Mumbai, India.
Corresponding Author E-mail: vakehri@el.vjti.ac.in
DOI : https://dx.doi.org/10.13005/bpj/1525
Abstract
Implementation of Artificial intelligence techniques is used as a medical diagnostic tool to increase the diagnostic accuracy and provide more additional knowledge. Muscular dystrophy is a disorder which diagnosed with Electromyography (EMG) signals. A Wavelet-based decomposition technique is proposed here to classified Healthy EMG signals (Normal) from abnormal muscular dystrophy EMG signals. In this work, a wavelet transform is applied to preprocessed EMG signals for decomposing it into different frequency sub-bands. Statistical analysis is carried out to these decomposed sub-bands to extract different statistical features. SVM and ANN classifier is proposed here to discriminate muscular dystrophy disorder from healthy Electromyography signals. Finally proposed methodology gives classification accuracy of 95% on publically available clinical EMG database. The results show better classification accuracy using an SVM classifier compare to ANN classifier on selected statically feature sets. The finding from the above method gave the best classifier for analysis and classification of EMG signals for recognition of muscular dystrophy disorders.
Keywords
Artificial Neural Network (ANN); Electromyogram (EMG); Support Vector Machine (SVM); Wavelet Transform (WT)
Download this article as:| Copy the following to cite this article: Kehri V, Awale R. N. EMG Signal Analysis for Diagnosis of Muscular Dystrophy Using Wavelet Transform, SVM and ANN. Biomed Pharmacol J 2018;11(3). |
| Copy the following to cite this URL: Kehri V, Awale R. N. EMG Signal Analysis for Diagnosis of Muscular Dystrophy Using Wavelet Transform, SVM and ANN. Biomed Pharmacol J 2018;11(3). Available from: http://biomedpharmajournal.org/?p=22822 |
Introduction
The Electromyogram (EMG) is a biomedical signal defined by an electrical potential, produced by muscles cells. The characteristic of EMG signals is small in amplitude (0-10 mv) and low in frequency (0-499Hz). The dominant energy of the electromyogram signal is between 50 to 150 Hz. EMG signals involve a great information about the nervous system with anatomical and psychological properties of muscles.1 A muscular dystrophy is a group of disorders, specified by weakness and wasting of muscle tissue with a breakdown of nerve tissue. There are various types of muscular dystrophy (disorders) that affect the muscles, spinal cord or nerves systems.2 The most common types are Duchenne muscular dystrophy and Becker muscular dystrophy. Early recognition by medical examination and tests are essential steps for their cure. This knowledge is also important in research, which may lead to understanding the nature of the disorder and eventual treatment. It can be difficult to differentiate normal EMG (Healthy subject) with abnormal EMG (subject suffers from muscular dystrophy/ disorder) as both may have a similar type of EMG waveform. Thus there is great interest by the researcher to differentiate between normal and abnormal EMG class as it will require lots of signal processing attempt.
Qualitative EMG analysis mainly based on subjective visually and expert advice may lead to misinterpretations. Qualitative EMG analysis cannot give data for comparison and classifying EMG disorders. To overcome this problem, computer-based EMG algorithms have been proposed.3 The literature has shown a various combination of classification technique with extracted features sets for diagnosis of muscular disorders. Different classification techniques including conventional bipolar EMG method,4 linear and matrix electrode array.5,6 The highly investigated EMG Parameters are muscle fiber conduction velocity (MFCV), Motor Unit Size (MU), frequency spectrum and entropy.7,8 Pattichis et al. in9 used a wavelet transform (WT) for extracting EMG features and applied different neural networks for EMG classification. In10 the Time domain approach has implemented for analysis and classification of the EMG signals. Abdulhamit et al.11 proposed an autoregressive system and wavelet neural network to extract different features from EMG. Katsis et al. applied SVM,12 Decision Tree (DT) and RBFN13 for EMG classification. In14 a combined technique of parametric power spectral and features extraction through WT is used for EMG signal analysis using neuro-fuzzy classifier. The results of classification accuracy in between 72% to 86% in all such proposed methods. To improve classification accuracy, a quality research needed in this particular area which will give more than 90% of accuracy.
Support Vector Machine (SVM) and Artificial Neural Network (ANN) classifiers are proposed here. Both the classifier having great predictive power effectively implemented for medical diagnostic decision support system. Several authors have shown their research interest in integrating the prediction of several systems often results in a classification accuracy that is higher than that of individual systems.
Materials and Methods
EMG Data Requisition
For this research work, the EMG signals database were taken from EMGLAB and PHYSIONET.15,16 These EMG datasets are publicly available and recorded from brachial biceps muscles. The records were collected from the brachial biceps muscles using needle electrodes with a sampling frequency of 50 KHz then downsampled to 4 KHz. The available records for each subject are of 5 to 10 minutes duration. Each data sequence first preprocessed and then segmented with a window size of 2000. The total numbers of segmented datasets are 200 were 100 datasets belongs to Normal (Healthy) class and 100 datasets for abnormal (disorders) class.
Pre-processing
Pre-processing is a very important task to reduce noise which occurs during recording of EMG signals. A high pass filter of order 4 is applied to remove noise and other artifacts. The low pass IIR filter is used to rectified EMG signal. A concoction of high pass filtering and low pass filtering gives linear envelope. The resulted signals were first band-pass through Butterworth Band Pass filter with cut-off frequency is 5Hz and 375 Hz. The notch filter at 50Hz is used to remove line interference frequency. After filtering, the segmentation was done and features were extracted using wavelet transform methods.
Block Diagram of Proposed Work
The raw EMG signal first filtered and then segmented. After preprocessing the segmented EMG database was decomposed up to multilevel decomposition using WT method to extract useful details & information. After that output is given to the extraction algorithm for feature extraction. Before processing, feature selection is proposed to reduce feature dimension filtered. Selection of features is based on a specific threshold value of selected features. Figure 1 illustrates the block diagram of the proposed work. For this work, we have extracted different statistical features like mean, standard deviation, RMS, Energy, Entropy etc. The selected features were categorized into two subclasses by using SVM and ANN classifiers.
Features Extraction
Feature extraction is one of best technique for dimension reduction. It takes the initial set of data and converts it into well-derived values or features as shown in Figure 3. Feature extraction technique plays a very important role in EMG signals analysis by converting a large set of data to the smaller meaning features. Here we apply the wavelet transform method to generate a wavelet coefficient expressing different frequency sub-bands.8,17
One-dimensional WT is defined as,
![]()
Where ψ*(t) represents the conjugate function of ψ(t) (mother Wavelet). Here l is a scale parameter whereas n is called shift parameter. The major advantage of WT for EMG signals is, it provides better time-frequency resolution and at the same time compresses data by preserving original information.18 Figure 2 shows the 3 Level EMG signal decomposition using WT (dB4) with detail and approximation.
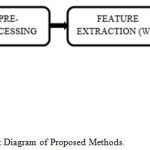 |
Figure 1: Block Diagram of Proposed Methods.
|
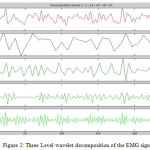 |
Figure 2: Three Level wavelet decomposition of the EMG signal.
|
WT represents a time domain signal in terms of fixed building blocks defined Wavelets. WT was designed to analyze random signal.7 Out of every frequency sub-band, we extracted different statistical features.
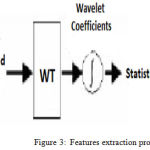 |
Figure 3: Features extraction procedure.
|
Classification
In classification, machine learning algorithms are applied to classify the EMG signal datasets. The role of the classifier is to identify the different sets of data on the basis of the training set and giving the correctly classified accuracy. The accuracy of classification depends on strength of features. Missing features and outliers in training data can reduce the accuracy of the classifier. The model is trained to predict the right class. Support Vector Machine (SVM) and Artificial Neural Network (ANN) classifier are used in this research.
Support Vector Machine
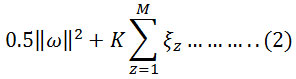
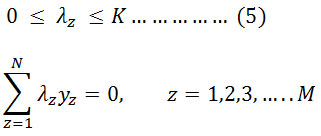
The concept of Machine learning enables the machine to learn and perform tasks by developing algorithms and methodologies. Machine learning combines with statistics in many aspects. Many techniques and methodologies were introduced for machine learning quest among which SVM proves to give a better & promising result for classification.19 SVMs were developed by Vapnik in the year of 1995 and are becoming universal because of their ultimate performance.20 Basically, SVMs worked on the structural risk minimization principle where features vectors are optimized by reducing classification misconception. Due to the complexity and nonlinear characteristic of EMG data sets, a nonlinear type SVM is implemented here. SVM prepare a classifier by determining optimal hyperplane which separates the margin between two classes in the kernel-induced feature space. Let us assume a training sample set {xz, yz}; i=1-M, where M belongs to a total number of samples.21 The hyperplane f(x) = 0 that disparate the given data can be obtained as a solution to the following optimization problem, Minimize:
Condition to,
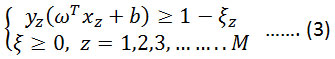
Where K is the error penalty constant. Representing the above equation in terms of λ, where λ is a Lagrange multiplier. Maximize,
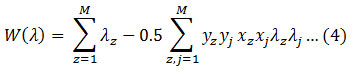
Condition to,
Holding hyperplane vectors are termed as support vectors. In literature, SVM has been used to classify multiple datasets of EMG signals. Figure 4 shows the simple kind of SVM.
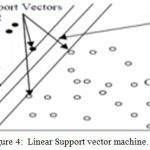 |
Figure 4: Linear Support vector machine.
|
ANN Classifier
In this work, the Backpropagation algorithm is applied to train ANN classifier. Backpropagation algorithm commonly used to supervise ANN model and trained for pattern classification.23 The backpropagation neural network defines as a network of processing elements working together to give a required output. These elements are organized into independent layers: input, hidden and an output layer. The diagram showed the simple kind of ANN structure with back propagation path.
Table 1: Distribution of the class samples in the testing and training data set.
| Class | Training Set | Test set | Total |
| Normal | 70 | 30 | 100 |
| Abnormal | 70 | 30 | 100 |
| Total | 140 | 60 | 200 |
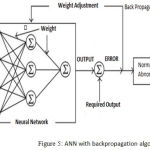 |
Figure 5: ANN with backpropagation algorithm.
|
Results and Discussion
In this research, EMG signals taken from the publicly available database are divided into two groups. The First group having EMG datasets of Normal (Healthy) class and another group contains datasets of abnormal (Muscular dystrophy) class. The EMG data is preprocessed and decomposed into different frequency sub-band using WT. The Statistical features were obtained from these frequency sub-bands. At the last, these features sets are classified using SVM and ANN classifier. The main aim of this paper was to design the classifier that is able to classify the input signal belongs to a normal or abnormal class. Table 1 shows the distribution of class samples for designing the classifier.
SVM Results
A nonlinear type SVM classifier is implemented for the classification of EMG datasets. For performing nonlinear classification SVM uses kernel. There are various kernels function available such as Linear, Quadratic, Polynomial, Gaussian Radial Basis etc. Out of 200 feature sets 140 sets are employed to train SVM classifier (using different kernel function). The rest of the 60 sets are used as test samples for the muscular dystrophy classification. The Cross-validation Type-Hold out “70-30” has been implemented in all this analysis, because it gives the best classification results compare to others cross-validation arrangement.
Polynomial Kernel Function
The Polynomial kernel is used which gives best i.e 95% accuracy compared to others nonlinear kernel. The mathematical equations of the polynomial kernel:
![]()
Where d is the degree of the polynomial. The results of the Polynomial kernel totally depend on poly-order. For nonlinear datasets, poly-order should be more than one. Table 2 shows the SVM polynomial kernel function results for different poly-order. Figure 6 shows the SVM polynomial kernel model confusion matrix representing 95% of classification accuracy. Table 4 depicts the best classification accuracy using the SVM model (For polynomial kernel model).
Gaussian Radial Basis Function (RBF)
The mathematical expression of RBF kernel function is represented by:
![]()
Here is known as rbf_sigma. The accuracy of classification using RBF kernel is mainly depends on. Table 3 shows the SVM RBF kernel function results for different rbf_sigma value. Figure 7 shows the SVM RBF kernel model confusion matrix representing 88.3% of classification accuracy.
Table 2: SVM polynomial kernel classification results for different poly-order.
| Parameter | Order_3 | Order_4 | Order_5 | Order_6 |
| Accuracy (%) | 93.33 | 90.00 | 95.00 | 76.00 |
| Sensitivity (%) | 90.00 | 80.00 | 93.33 | 63.00 |
| Specificity (%) | 0.9666 | 100 | 96.66 | 10.00 |
| Precision (%) | 96.42 | 100 | 96.66 | 86.00 |
| FRR | 0.1 | 0.2 | 0.067 | 0.37 |
| Fratio | 0.93 | 0.88 | 0.94 | 0.72 |
Table 3: SVM RBF Kernel model classification results for different rbf_sigma.
| Parameter | rbf_sigma 0.1 | rbf_sigma 0.3 | rbf_sigma 0.5 | rbf_sigma 1 | |
| Accuracy (%) | 66.66 | 88 | 88.3 | 85.00 | |
| Sensitivity (%) | 97.32 | 96.67 | 93.33 | 83.33 | |
| Specificity (%) | 33.00 | 80.00 | 83.33 | 86.67 | |
| Precision (%) | 60.00 | 82.86 | 84.85 | 86.21 | |
| FRR | 0.0268 | 0.0333 | 0.0667 | 0.1667 | |
| Fratio | 0.75 | 0.8923 | 0.8889 | 0.475 | |
Table 4: Classification accuracy using SVM Polynomial Kernel model.
| Types of classes | Total Numbers of Test Samples | Test Samples Number Identified Correctly | Correct Identification Rate using SVM |
| Normal | 30 | 29 | 95% |
| Abnormal | 30 | 28 |
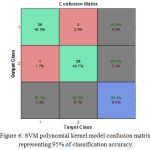 |
Figure 6: SVM polynomial kernel model confusion matrix representing 95% of classification accuracy.
|
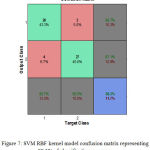 |
Figure 7: SVM RBF kernel model confusion matrix representing 88.3% of classification accuracy.
|
ANN Results
In this approach, the ANN classifier is implemented for the classification of EMG datasets. Here we effectively apply the EMG (test input) to the neural network, which differentiates the input signal from the trained signal. This differentiation mainly depends on the weight factor. If the input signal includes a normal or abnormal class then trained network understands the occurrence of that particular class. The implementation of the Backpropagation algorithm shows better classification accuracy as compared to others available algorithm. The correct classification accuracy using ANN is 93.33% confirm that WT to extract feature vectors, combined with an ANN classifier technique can improve the classification results. Figure 7 shows the ANN training, validation and test confusion matrix whereas Figure 8 shows the ANN confusion matrix representing 93.3% of classification accuracy. Table 3 shows the parameter of the ANN classifier where Table 4 classification accuracy.
Confusion Matrix
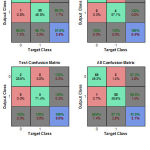 |
Figure 8: ANN Training, Validation and Test.
|
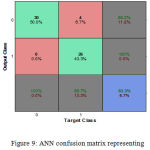 |
Figure 9: ANN confusion matrix representing 93.3% of classification accuracy.
|
Table 5: Artificial neural network parameter.
| Accuracy(%) | Sensitivity(%) | Specificity(%) | Precision(%) | FRR | Fratio |
| 93.3 | 86.66 | 100 | 100 | 0.13 | 0.92 |
Table 6: Classification accuracy using the ANN model.
| Types of Diseases | Total Numbers of Test Samples | Test Samples Number Identified Correctly | Correct Identification Rate using ANN |
| Normal | 30 | 30 | 93.3% |
| Abnormal | 30 | 26 |
Table 7: Comparisons of the classifier.
| Classifier | Accuracy (%) | Sensitivity (%) | F-ratio (%) | FRR (%) |
| ANN | 93.33 | 86.66 | 92.00 | 13.00 |
| SVM (Polynomial Kernel model) | 95.00 | 93.33 | 94.00 | 6.67 |
| SVM (RBF Kernel model) | 88.3 | 93.33 | 88.89 | 6.67 |
Conclusion
Classification of muscular dystrophy through EMG signals is a challenging task for researchers as it needed lots of clinical information and observation. Traditional methods for classification of EMG datasets used either frequency domain or time domain representation of EMG signals. This traditional method fails to give accurate classification efficiency. In this presented work, WT method was used to decompose EMG signals into different frequency sub-bands. Wavelet coefficient has been extracted to find the different statistical feature. The statistical features are extracted and classified using SVM and ANN classifier. The classification is done by SVM polynomial kernel function of a different order varying from three to six. The optimization is obtained at level five where accuracy is 95%. The percentage classification accuracy and sensitivity is maximum at polynomial order 5. The SVM RBF kernel function gives classification accuracy i.e. 88.3%. The optimization is obtained at rbf_sigma 0.5 where accuracy is maximum and lower false rejection rate i.e.0.0333. ANN results give correct classification rate of 93.33%. The combination of WT methods with SVM polynomial kernel model can improve the accuracy of EMG signal classification. This concluded that the application of nonlinear feature extraction for EMG signal classification along with SVM will be a promising alternative for intelligent classification and diagnosis system in future. The application of EMG signals classification for diagnosis of muscular dystrophy has great potential in the area of biomedical engineering. The Performance parameters of this proposed work are satisfactory and can be utilized in clinical studies also after it is developed.
References
- Reaz M. B. I., Hussain M. S and Mohd-Yasin F. Techniques of EMG signal analysis detection processing classification and applications Biol. Proced. Online. 2006;8(1):11-35.
CrossRef - Thought Technology Ltd. The Basics of Surface Electromyography Applied to Physical Rehabilitation and Biomechanics Document Number MAR 908. Montreal, Canada. 2009.
- Eric R & Cohen A. B & James A. Review of Quantitative and Automated Needle Electromyography Analyses. Biomedical Engineering, IEEE Transactions on. 1981;28:506-514.10.1109/TBME. 324737.
- Güler F. N & Sabri K. Classification of EMG signals using PCA and FFT. Journal of medical systems. 29:241-50. 10.1007/s10916-005-5184-7.
CrossRef - Gea D & Dick S.,et.al. Clinical applications of high-density surface EMG: A systematic review. Journal of electromyography and kinesiology. official journal of the International Society of Electro physiological Kinesiology. 16:586-602. 10.1016/j.jelekin. 2006.09.005.
- Hans‐Jürgen H & Disselhorst-Klug., et.al. Diagnostic yield of noninvasive high spatial resolution electromyography in neuro muscular diseases. Muscle & nerve. 1997;20:1360-70. 10.1002/(SICI)1097-4598(199711)20:113.0.CO;2-8.
- Englehart K., Hudgin B., Parker P. A wavelet based continuous classification scheme for multi-function myoelectric control. IEEE Trans. Biomed. Eng. 2001;48:302–311.
CrossRef - Nisheena V. I., Subramaniam K and Shaniba P. A. Wavelet Packet Entropy Based Control of Myo electric Prosthesis. Biomedical & Pharmacology Journal. 2018;11(1):375-380.
CrossRef - Pattichis C & Marios P . Time-scale analysis of motor unit action potentials. IEEE transactions on bio- medical engineering. 1999;46:1320-9. 10.1109/10.797992.
CrossRef - Pattichis C & Elia G . A. Autoregressive and cepstral analyses of motor unit action potentials. Medical engineering & physics. 1999;21:405-19. 10.1016/S1350-4533(99)00072-7.
CrossRef - Abdulhamit S & Mustafa Y & Ozcalik R. H. Classification of EMG signals using wavelet neural network. Journal of neuroscience methods. 2006;156:360-7. 10.1016/j.jneumeth. 2006.03.004.
- Christos K & Yorgos G ., et. al . A novel method for automated EMG decomposition and MUAP classification. Artificial Intelligence in Medicine. 37:55-64. 10.1016/j.artmed. 2005.09.002.
- Güler F. N & Sabri K. Classification of EMG signals using PCA and FFT. Journal of medical systems. 29:241-50. 10.1007/s10916-005-5184-7.
- Zhang X . Wavelet transform theory and its application in EMG signal processing. Seventh International Conference on Fuzzy Systems and Knowledge Discovery. 2010.
CrossRef - Shaniba P. A., Subramaniam K . And Nisheena V. I. Classification of Fractal Features of Uterine EMG Signal for the Prediction of Preterm Birth. Biomedical & Pharmacology Journal. 2018;11(1):369-374.
CrossRef - Sapsanis C., Georgoulas G., et.al. EMG based classification of basic hand movements based on time-frequency features, in 21 th IEEE Mediterranean Conference on Control and Automation (MED 13). 2013;25-28:716-722.
- Doulah A. B. M. S. U.,Fattah S. A.,Zhu W. P and Ahmad M. O. F. Wavelet Domain Feature Extraction Scheme Based on Dominant Motor Unit Action Potential of EMG Signal for Neuro muscular Disease classification. IEEE Trans. Biomed. Eng. 2014;8.
- Zhang X. Wavelet transform theory and its application in EMG signal processing,Seventh International Conference on Fuzzy Systems and Knowledge Discovery. 2010 .
- Mohanavelu K., Lamshe R., et. al. Assessment of Human Fatigue during Physical Performance using Physiological Signals. A Review Biomedical & Pharmacology Journal. 2017;10(4):1887-1896.
CrossRef - Christodoulou C. I., Pattichis C. S . Unsupervised pattern recognition for the classification of EMG signals. IEEE Trans Biomed Eng. 1995;46:169–178. Cortes C, Vapnik V.
- Kankar P. K., Satish C Sharma., Harsha S. P. Rolling element bearing fault diagnosis using wavelet transform. Neuro computing. 2011.
CrossRef - Kumar S. P., Sriraam N. B et.al. Entropies based detection of epileptic seizures with artificial neural network classifiers. Expert Systems with Applications. 2010;37(4):3284-91.
CrossRef

