
Manuscript accepted on :17 May 2018
Published online on: 28-06-2018
Plagiarism Check: Yes
Khawla Otmani1, Dalila Naimi2, Romuald Mentaverri3, Thibaut Objois3, Nadiabouderssa4 Marolleau5
1Laboratory of Microbiological Engineering and Applications Molecular Biology and Cellular Physiology Constantine1University, Constantine, Algeria.
2Higher National School of Biotechnology, ENSB Taoufik KHAZNADAR Constantine, Algeria.
3Laboratory of INSERM U1088, Amiens, France.
4Department of Rheumatology Hospital Dr BENBADIS, Constantine, Algeria.
5Laboratory of Normal and Pathological Lymphocyte and Cancers, ONCOPOLE Clinical Hematology and Cell Therapy Department Hospital, Amiens, France.
Corresponding Author E-mail: dalila.naimi76@gmail.com
DOI : https://dx.doi.org/10.13005/bpj/1466
Abstract
Nitric oxide (NO) is an instable free radical considered as a marker of physiological and pathological processes. NO quantification is very sensitive and shows a great variability because of the NO short life time. Myeloma bone diseases (MBD) constitute one of the most visible aspects in MM cancer, which is a favorable microenvironment for the promotion of communication between malignant plasma cells and other cell types using cellular messengers including NO. On the other hand, many researchers have confirmed the association of osteoporosis with a high concentration of (NO), which has been proven to play a primary role in bone remodeling. The relationship between plasma NO concentration and MM pathology is poorly documented. This work aimed to study the variability of NO quantification using R&D and Arbor assays kits in plasma MM patients in comparison with osteoporosis (OP) patients as positive control. MM and OP blood samples were obtained from patients in three hospitals at the East of Algeria. The results showed a slight similarity (21.56%) between NOx concentrations assayed with two kits, that the average concentration of NOx in MM patients(54, 22μM / l ±20, 06μM/l) was higher than the average concentration of NOx in patients with OP (48,34μM/l ±16,71μM /l). Our results confirmed an important difference and variability in NO quantification Thus the high NOx level production in MM patients comparing with OPpatients was noticed.
Keywords
Arbor Assays Kits; Multiple Myeloma (MM); Nitric Oxide (NO);Nitrate/Nitrite (NOx) Quantification; R & D
Download this article as:| Copy the following to cite this article: Otmani K, Naimi D, Mentaverri R, Objois T, Nadiabouderssa N, Marolleau J. P. Quantification of Nitric Oxide in Multiple Myeloma Algerian Patients Using R & D and Arbor Assays Kits. Biomed Pharmacol J 2018;11(2). |
| Copy the following to cite this URL: Otmani K, Naimi D, Mentaverri R, Objois T, Nadiabouderssa N, Marolleau J. P. Quantification of Nitric Oxide in Multiple Myeloma Algerian Patients Using R & D and Arbor Assays Kits. Biomed Pharmacol J 2018;11(2). Available from: http://biomedpharmajournal.org/?p=21127 |
Introduction
Nitric oxide (NO) is a free radical of low molecular weight (30 Da).1 It is known as a major factor in most regulating cellular functions in various physiological processes.2 NO is a prognostic marker for many diseases especially in inflammation and oxidative stress.3 The Griess method is most widely used to measure the amount of conversation of NO to (Nitrate (NO3) / Nitrite (NO2)) (NOx), representative of unstable NO release.4 However, scientific literature shows a great variability in the measurement of NO between 2μM up to 17 μM – 44 μM in healthy individuals, when using the methods based on the Griess reaction.5 For this reason, much work has been done to achieve a method of high performance and reliability in the context of accuracy, specificity, and sensitivity with minimal interference.6 Furthermore, the quantification of NO in biological samples is a major challenge for scientists because of NO rapid release, its short life span.7 and the different functions based on the concentration of this molecule produced in a particular microenvironment.2 In tumor microenvironment, the role of NO is very complex; it is produced in different concentrations that induce either apoptosis or tumor cell growth. At high concentrations, NO acts as a potential anti-cancer agent that favors apoptosis and inhibits angiogenesis. At moderate concentrations, this molecule is linked to tumorigenesis and anti-apoptotic processes.8 Multiple myeloma (MM) is a hematological cancer in a clonal expansion of fully differentiated B cells (plasma cells) in the bone marrow.9 It is characterized by osteolysis and a monoclonal immunoglobulin secretion that can develop an immune deficiency and severe renal impairment.10 Several studies have validated the association of cancer with high concentrations of NO11 in different types of tumors : breast, brain, lung, prostate, colorectal and pancreatic tumors.12 On the other hand, no studies have reported the relationship between NO concentration and MM pathology where quantification of NO levels in MM patients were poorly studied. Myeloma bone diseases (MBD) are one of the most visible aspects in MM cancer, which can reduce the quality of life of patients because of bone pain and pathological fractures.13 As well as osteoporosis (OP) is a disease characterized by low bone mass and deterioration of bone tissue.14 Many researchers have confirmed the association of osteoporosis with a high concentration of (NO).15 In addition, other works have proven the primary role of NO in bone remodeling.16 The aim of this work is to assess the level of plasma nitric oxide in multiple myeloma and to study its quantification variability using two different commercial kits R&D and Arbor assays. OP patients will be used as an internal control. The interference of the deproteinization of the samples during the Griess reaction has been proven by several authors.17 In this study, different methods of deproteinization will be discussed.
Materials And Methods
Nitric Oxide (NO) quantification kits were purchased from Arbor Assays and R&D societies. Trichloroacetic Acid (TCA), zinc sulphate (ZnSO4 ) were purchased from Sigma Aldrich.
Patients
The diagnosis of patients was confirmed after the Clinical and biological examinations, where 40 MM patients and 27 OP patients aged between 35 and 60 were collected over two years (2014 and 2015) in hemato-oncology department at three hospitals in the East of Algeria (Constantine, Batna and Annaba). All subjects signed a clear consent so that we were able to carry out this study by respecting the rules edited by the declaration of HELSENKI (August 2004).
Plasma Samples Preparation
The heparinized blood was centrifuged for 15min at 1400 rpm; the plasmas were aliquoted and frozen at -80°C until use.
Deproteinization
Deproteinization is a necessary step for the quantification of nitric oxide because the presence of protein causes interference on the Griess reaction. Two deproteinization protocols were tested in this work.
Deproteinization with ZnSO4
6 mg of ZnSO4 were added to 400 μl of plasma (15 g / l); the mixture was vortexed and centrifuged (for 10 min at 1400 rpm, and 4 ° C).
Deproteinization with TCA
The plasma was treated with TCA 20% (w/v) for 30 min in ice; the mixture was centrifuged (for 15min at 1400 rpm and 4 ° C). Both supernatants were collected and subjected to protein electrophoresis.
Determination of Nitric Oxide
By the R&D kit
The kit contains reagents necessary for the Griess reaction, including the lyophilized Nitrate Reductase (NR), its storage diluent, lyophilized NADH, the concentrated reaction diluent, and the nitrite and nitrate standard and the Griess reagent I and II.
Preparation of reagents
To prepare 300 ml of reaction diluent (1×), 30 ml of concentrated diluent (10 ×) were added to deionized water.
The (NR) was reconstituted with 1 ml of NR storage diluent and diluted, immediately before use according to the equations:
Reductase Nitrate (μl) = (number of wells +2) × 5μl
Diluent reaction (1X) (μl) = volume of A × 4
The NADH was reconstituted with 5ml of deionized water and placed on ice.
Standard Preparation
100 μl of nitrite and nitrate standard (2000 μmol/L) were added to 900 μL of diluent (1X).
500 μl of diluent were placed in the remaining tubes, 500 μl of mixture was transferred between the tubes to carry out a series of dilutions when (200 μmol / L) has been identified as the highest standard and the diluent (1X) is used to be (0μmol/L).
Determination of nitrites
50 μl of OP and MM samples or standard of nitrite was added to the microplate, diluted with 1X v /v diluent, 50 μl of GriessI and 50 μl of Griess II were added, the mixture was incubated for 10 min in room temperature, the OD(optical density) was read at λ = 570 nm.
Determination of Nitrate
50 μl of OP and MM samples or standard of nitrate was added to the microplate, diluted with 1X v /v diluent. 25 μL of NADH was added with 25 μl of diluted NR to the well and the mixture was incubated for 37 min at 37 ° C. 50 μl of Griess as well as 50 μl of Griess II were added, the mixture was incubated for 10 min at room temperature and the OD was read at 570 nm.
By the Arbor Assays kit
The kit contains reagents to perform the Griess reaction, including the nitrate reductase solution and its stabilizing enzyme, the concentrated NADH solution and kit buffer as well as the nitrite and nitrate standard and the Griess A reagent and B.
Reagents Preparation
550 μl of the stabilizing enzyme was added to the NR solution, the mixture was vortexed and diluted with the v / 3v kit buffer. The concentrated NADH was diluted with Kit buffer v/ v.
Standard Preparation
40 μl of nitrite and nitrate standard (2000 μmol / l) were added to 360 μl of kit buffer. 200 μl of diluent were placed in the remaining tubes. 200 μl of the mixture were transferred between the tubes to produce a series of dilution or (200 μmol / l) was identified as the highest standard and the diluent (1X) is used for white (0μmol / l).
Determination of Nitrites
50 μl of nitrite standard and 12.5 μl of OP and MM samples were added to the microplate, dilution with the v / 4v kit buffer was carried out, 25 μl of Griess A and 25 μl of Griess B were added, Mixture was incubated for 5 min at room temperature and the OD (optical density) was read at 570 nm.
Determination of Nitrate
50 μl of nitrate standard and 12.5 μl of OP and MM samples were added to the microplate, diluted with the v / 4v kit buffer, 10 μl of NADH was added with 10 μl of diluted NR to the well and the mixture was incubated for 20 min at room temperature, 25 μl of Griess A and 25 μl of Griess B were added, the mixture was incubated for 5 min.
Statistics
All the statistical analysis was performed by using student t test and XL STAT software
Results
Characterisation of plasma deproteinization methods
A migration gel of the proteins by electrophoresis was performed to test the presence of proteins in both supernatants treated with ZnSO4 and TCA (figure 1).
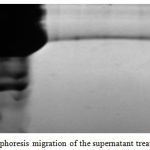 |
Figure 1: Proteins electrophoresis migration of the supernatant treated with TCA and Zn2so4. MW (molecular weight), TCA: supernatant treated with TCA. Zn2so4: supernatant treated with Zn2so4
|
A great difference has been observed between proteins intense migration in the supernatant treated with Zn2sO4 and TCA, that an absence of proteins in the supernatant due to precipitation with TCA was noticed.
Quantification of NOx concentration with Arbor assays and R&D kits in plasma MM patients
The concentration of NOx (nitrite +nitrate) in plasma MM assayed by the two kits was compared to each other (figure 2).The results showed that the concentration of NOx assayed with Arbor assays (NOx= 50,16±6,98 μM/l) presents low concentration in comparison with NOx assayed with R&D kit (NOx= 58,26 ±39,75 μM/l) where the concentration of Nitrate quantified with Arbor assays (NOx= 40,05 ±6,522μM/l ) was higher than the concentration of Nitrate quantified with R&D kitassays (NOx = 30,02 ± 39,10 μM/l ), while the concentration of Nitrite quantified with Arbor assays (Nitrite = 10,10 ±1,02 μM/l ) present low concentration in comparison with Nitrite quantified with R&D kit (Nitrite= 28,22 ±4,75 μM/l ).
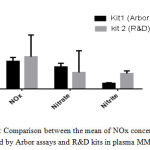 |
Figure 2: Comparison between the mean of NOx concentrations, quantified by Arbor assays and R & D kits in plasma MM patients.
|
Similarity study between NOx concentrations quantified with Arbor assays and R&D kits
A similarity study between NOx concentrations using the student t test was performed.Very important difference and variability in nitrite and nitrate concentrations assayed with two kits was noticed in the MM patients (13.1%),(0.01%); however, a slight resemblance in NOx concentration was detected (21.56%) (Table1).
Table 1: The percentage of NOx concentration similarity quantified by the two Arbor essay And R&D kits according to t test student
| MM patients | |||
| NOx | Nitrate | Nitrite | |
| Percentage of
NOx concentration similarity using two kit |
21.56 %
t=1,248606 p=0,012897 |
13.1%
t=1.52483 p=0.13145 |
0.01% t=22.9570 p<0.0001 |
Correlation study of NOx concentration quantified between Arbor assays And R&D kits in plasma MM patients.
Linear regression and correlation study of NOx concentrations quantified with the two Arbor assays and R&D kits in MM showed a negative and very low significant linear correlation that could be negligible Fig3a (r=-0.03324, P = 0.8386). In addition, a significant average positive linear correlation in Nitrate and Nitrite concentration was found Fig3b(r = 0.2969, P = 0.0628), Fig3c(r= 0.2969 P=0.0628).
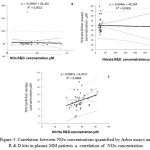 |
Figure 3: Correlation between NOx concentrations quantified by Arbor assays and R&D kits in plasma MM patients .a. correlation of NOx concentration.
|
Correlation of Nitrate concentration. c. correlation of Nitrite concentration.
Study of the impact of Arbor assays and R & D kits on (NOx) quantification in plasma MM patients.
The study of the impact of Arbor assays and R&D kits on (NOx)quantification in MM patients showed a very strong and highly significant negative linear correlation between the difference and the average impact rate of the kits on plasma samples. More NOx, Nitrate and Nitrite concentration values increase, the difference between NOx, Nitrate and Nitrite concentrations using the two kits decrease Fig4 a (r = -0.9402, P˂0.0001), Fig4 b (r = -0.9178, P˂0.0001), Fig4 c (r = 0.9178 P <0.0001).
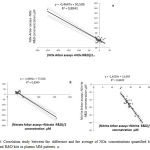 |
Figure 4: Correlation study between the difference and the average of NOx concentrations quantified by Arbor assays and R & D kits in plasma MM patients. a.
|
Correlation of NOx concentration b. Correlation of Nitrate concentration c. Correlation of Nitrite concentration.
Comparison between the averages concentration of NOX quantified with Arbor Assays and R & D kits in MM and OP patients.
The average concentration of NOx assayed with Arbor assays and R&D kits was compared in OP and MM patients, where we have found that MM patients present high concentration of NOx in comparison with OP patients.
Fig 5a (NOxMM = 54.22±20.06μM/l ,NOxOP= 48,34±16,71μM/l); Fig 5b (Nitrite MM = 19,18± 2,55μM/l, Nitrite OP = 17,70±4,45μM/l); Fig 5c (NitrateMM = 35.04± 19,49μM/l , NitriteOP =29.16± 3,27μM/l).
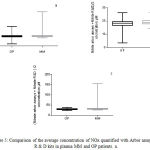 |
Figure 5: Comparison of the average concentration of NOx quantified with Arbor assays and R & D kits in plasma MM and OP patients. a.
|
Comparison between NOx concentration. b. comparison between Nitrite concentration. c. comparison between Nitrate concentration
Discussion
To investigate the rate of NO and its metabolites NOx (Nitrite + Nitrate) measured by the kits, and to test the variability of its quantification in the plasma of MM patients, we have compared proteins’ precipitation methods.These methods constitute a great challenge for scientists as they are a very important and necessary step during the preparation of samples, which may influence the NO concentrations obtained.
Several studies showed that the high concentration of NO in samples is due to a high protein concentration and inadequate deproteinization.6 Different methods have been tested to find an optimal mechanism that does not interfere with the Griess reaction for proteins removal. Many research advice to avoid the use of organic solvents and ammonium and sodium sulphate. Moreover, these methods are not recommended because of the protein residues remaining in the precipitated medium and the interference of these components with the Griess reaction.17
Scientists’ discussion is restricted between the use of TCA and Zn2SO4, where the results are very close.17 Both methods will be tested in this study for further comparison of their efficiency regarding samples deproteinization techniques.
The results of plasma proteins electrophoresis after precipitation show a great difference and variability. It has been observed that proteins intense migration in the supernatant of Zn2sO4 treated plasmas accompanied by an absence of proteins in the supernatant due to precipitation with TCA.
These data confirm the effect of TCA in precipitating protein components in comparison with Zinc. Previously Han Moshage et al (1995) reported that zinc sulphate can eliminate at least 50% of proteins in the precipitated medium6. It is also consistent with studies of T. Sivaraman et al(1997), who observed that the TCA precipitation due to the three-chlorine groups (Cl-) that ensure the increase of the electronegative charge (–) can result in an optimum pH physical acid medium. However, in acidic media, optimal precipitation of proteins cannot be completed; thus, the precipitated pH medium with TCA is sufficient and constitutes the optimum pH of precipitation action.18 Some studies showed that the Zinc is so highly reactive and can reduce the result of quantified nitrite.19 The use of an acidic medium such as TCA can accelerate the Griess reaction.20 Moreover, several researchers have been satisfied with the results of NOx due to the precipitation of Zinc,17 where they have found that it is very effective for the formation of precipitation/turbidity, and removal of the fatty and particular substances that interfere with the Griess reaction.19 Deproteinization in an acid medium would favor the loss of nitrite, which can easily convert to nitric oxide and nitrogen dioxide gas that must be avoided.7
Study on variability of NO quantification in MMpatients is poorly documented; However there are different providers of NO assay kits based on Griess reaction.
These kits are generally varied according to the nitrate reduction method used (cadmium or enzymatic protocol) and samples deproteinization methods (chemicals or ultrafiltration).19
In this work, we have studied the variability of nitric oxide plasma quantification in MM using two different commercial kitsR&D and Arbor assays where the proposed precipitation protocol of the ultrafiltration membrane was changed with a cheaper and quicker precipitation method that has been tested previously: precipitation by the use of TCA. The results obtained using osteoporosis patients as an internal control were compared to have a preliminary idea of NO concentration in MM patients.
NO has a very short life span and it is rapidly oxidized with several components in biological systems. The quantification of NO is becoming very difficult, researchers routinely use the sum of these stable nitrate and nitrite metabolites (NOx indicators of the production of nitric oxide.21
Both kits contain reagents to ensure the Griess reaction in order to dose the nitrite) as (NO2–) supplemented by the reduction of (NO3–) nitrates to nitrites in the presence of NADPH-sensitive reductase.
The study of NO production revealed a significant difference and variability between the nitrite (NO2–) and (NO3–) nitrates concentration obtained by the two kits in the MM patients; however, a slight similarity in (NOx) concentration quantified using the two kits was detected.
Thereafter, we noticed an absence of a significant linear correlation between (NOx)(Nitrite) concentration obtained by R&D and Arbor assays kits. The concentration of (Nitrate) using the two kits reveals an average significant positive linear correlation in MM patients.
The results obtained in the study of the kits impact on Nox concentration in multiple myeloma patients can be explained in terms of higher concentration values of (NOx)– (Nitrate) and (Nitrite), the difference and variability of NO quantification in MM decrease.
Many studies have proven the relationship of NO with the progression of hematological cancers.13 This explains the resemblance that has been found between the two kits at high (NOx) concentrations in the case of hematologic cancer myeloma. Thus, at high levels of (NO x), (Nitrite) and (Nitrate) in the plasma, both kits can perform very similar activities.
The current study revealed a high plasma level in MM patients despite the variability that was noticed in NO concentration using the two kits.
High concentration of NOx was observed in the plasma of OP patients, which was confirmed by many published works.15,22,23,24 In the present work, it has been found that the average of NOx plasma levels in MM patients is higher than the average of NOx plasma levels in OP patients.
Previously, NOS(NO synthase) isoforms expressions in situ have been proven by R.V.Mendes et al. (2001), while NOS2 was expressed in 100% of myeloma plasma cells. Thus, the expression of NOS1 and NOS3 was 30% and 50% respectively,25 which concords with myeloma cells, can produce NO in high concentration. Furthermore, the quantification of plasma nitric oxide has been carried out in several hematological cancers, such as leukemia26 and solid tumors including colorectal carcinoma27, hepatocellular carcinoma,28 Oral Cavity Cancer,29 melanoma cancer,30 breast cancer,31 gastric,32 cancer.
NO has been taken as prognostic marker correlated positively with tumor grade and patients’ survival, it seems to play a complex role in tumor microenvironment.
It has been also related to many cell growth processes, angiogenesis, immunomodulation, and apoptosis11.
Conclusion
We conclude that NO quantification methods need to be improved in order to reach the real concentration of NO in plasma.
According to our results, high NO level in MM has been found despite the important variability in NO quantification that was noticed even in using the commercial kits. Hence, to explain the physiological and pathological role of NO in MM , further studies should be completed to investigate the correlation of NO plasma level with other prognostic markers of MM disease.
Acknowledgments
The authors would like to express their appreciation of the financial support of the laboratories EA4666 – LNPC “Lymphocyte Normal – Pathologique et Cancers” and Inserm Unit 1088 in Amiens, France..
The authors would like to thank Pr.Grifi.F (The Department of Hematology,Hostiptal of Annaba),Pr.Saidi(The Department of Onco-hematology , Hostiptal of Batna ), Pr.Rwabhia. S (The Department of internal medicine, Hostiptal of Batna ,Dr.Benhalilou .M (The Department of Hematology, Hostiptal of Constantine), Algeria for their cooperation in collecting samples.
Conflict of interest
There is no conflict of interest.
References
- Delsouc M.B, Morales L.D, Vallcaneras S.S, Bronzi D, Anzulovich A.C, Delgado S .M, Casais M. Participation of the extrinsic cholinergic innervation in the action of nitric oxide on the ovarian steroidogenesis in the first proestrous in rats. General and Comparative Endocrinology. 2016;236:54–62.
CrossRef - Hill G, Dranka B .P,Shannon M. B, Lancaster Jr .J. R, Darley-Usmar V. M. What Part of NO Don’t You Understand? Some Answers to the Cardinal Questions in Nitric Oxide Biology. the journal of biological chemistry. 2010;285:(26):19699–19704.
- Beckman P.J, Liaudet S.L . Nitric Oxide and Peroxynitrite in Health and Disease. PhysiolRev. 2010;87:315–424.
- D. Analysis of nitrite and nitrate in biological fluids by assays based on the Griess reaction: Appraisal of the Griess reaction in the l-arginine/nitric oxide area of research. Journal of Chromatography B. 2007;8(51):51–70.
- L. Nitric oxide as a challenge for the clinical chemistry laboratory. Scandinavian Journal Clinical and laboratory investigation. 1996;56:7.
- Moshage H, Kok B, Huizenga J .R ,Jansen .P .L. M. Nitrite and Nitrate Determinations in Plasma: A Critical Evaluation. chem. 1995;41(6):892-896
- Espey K.M. M.G, Wink.D.A. Rapid Simple SpectrophotometrieMethod for Simultaneous Detection of Nitrate and Nitrite.Nitricoxide.Biology and chemistry. 2001;5(1):62–71.
- Singh S, Gupta A.K. Nitric oxide: role in tumour biology and iNOS/NO-based anticancer therapies. Cancer ChemotherPharmacol. 2011;67:1211–1224.
CrossRef - Richardson K.P. G, Hideshima T, Chauhan D, Anderson K.C. The malignant clone and the bone-marrow environment. Best Pract Res ClinHaematol. 2007;20(4):597-612.
CrossRef - James N. P. M.D, Philip M. P. MultipleMyeloma .Group International, Inc.ISBN. 2004;0-597-84045-8.
- Kashfi F.K, Nath. N. The dual role of iNOS in cancer. Redox Biology. 2015;6:334-343.
CrossRef - Burke A .J,Sullivan F.J, Giles F. J, Glynn S. A. The yin and yang of nitric oxide in cancer progression.Carcinogenesis. 2013;34(3):503–512.
CrossRef - Heider U, Fleissner C, Zavrski I, Kaiser M, Hecht M, Jakob C, Sezer O. Bone markers in multiple myeloma.european. journal of cancer. 2006;42:1544–1553.10.1016.
- U.H. Bone Remodeling in Post-menopausal Osteoporosis. Journal of Dental Research. 2006;85;(7).
- Ozgocmen S, Kaya H, Fadillioglu E, Aydogan R,Yilmaz Z. Role of antioxidant systems, lipid peroxidation, and nitric oxide in postmenopausal. .2007;295(1-2):45-52.
- Van’T, Hof R.J, Ralston S. H. Nitric oxide and bone. The journal of cells, molecules, systems and technologies. 2001;10:1365-2567.
- Hedayati M.A , Biabani H. Protein precipitation methods evaluated for determination of serum nitric oxide end products by the Griessassay. Journal of Medical Sciences Research. 2007.
- Sivaraman T, Kumar T. K. S, Jayaraman G, Yu C. The Mechanism of2,2,2-Trichloroacetic Acid-Induced Protein Precipitation. Journal of Protein Chemistry. 1997;16:4267.
CrossRef - Zhang X.J, Broderick M, Fein H. Measurement of Nitric Oxide Production in Biological Systems by Using Griess Reaction Assay. Sensors. 2003;3:276-284.
CrossRef - Purol-Schnabel S.R, Roesen R. Measurement of Nitric Oxide by Reconversion of Nitrate/Nitrite to NO. Methods in Molecular Biology:Nitric Oxide Protocols: Second Edition. 2004;279:1-8.
- Iwanejkoa J.I, Dembińska-Kieća A, Pankiewicza J, Wanata A, AnnaaP, Goł̧a̧beka I, Bartuśa S, Malczewska-Maleca M, Szczudlikb A. Determination of nitrite/nitrate in human biological material by the simple Griessreaction. ClinicaChimicaActa. 1998;274:177–188.
CrossRef - Robert E. A, Peter J.V, Grabowski S, David M. R, Stuart H. R. Evidence for a Pathogenic Role of Nitric Oxide in Inflammation-Induced Osteoporosis. Journal of Bone and Mineral Research. 1999;14(12):2137.10.1359.
- Armour K.J, Armour K.E,Van’tHof R. J,Reid D.M,Wei X,Liew F.Y, Ralston S.H. Activation of the inducible nitric oxide synthase pathway contributes to inflammation-induced osteoporosis by suppressing bone formation and causing osteoblast apoptosis. .Arthritis& Rheumatology. 2001;44(12);2790–2796.1002.
- S, Kaya H,Fadillioglu E , Yilmaz Z. EffectsofCalcitonin, Risedronate, and Raloxifene on Erythrocyte Antioxidant Enzyme Activity, Lipid Peroxidation, and Nitric Oxide in Postmenopausal Osteoporosis. Archives of Medical Research. 2007;38(2);196-205.
CrossRef - Mendes .A.R.V, Martins G ,Nucci F, Murad F.A . Soares.Expression of nitric oxide synthase isoforms and nitrotyrosineimmunoreactivity by B-cell non-Hodgkin’s lymphomas and multiple myeloma. Histopathology. 2001;39(2):172-8.
CrossRef - Zhao H, Dugas N, Mathiot C, Delmer A, Dugas B, Sigaux F and Kolb P.K. B-Cell Chronic Lymphocytic Leukemia Cells Express a Functional Inducible Nitric Oxide Synthase Displaying Anti-Apoptotic Activity. The American Society of Hematology. 1998;92:1031-1043 .0006-4971/98/9203-0026$3.00/0.
- Altuntas F.H, Akbulutc K. G, Ozturk G, Cindoruk M, FikriIcli E .U. prognostic role of serum vascular endothelial growth factor, basic fibroblast growth factor and nitric oxide in patients with colorectal carcinoma. Cytokine. 2002;20(4):184–190.
CrossRef - EISA L. A .N. H, EBRAHIM M. A, RAGAB .M , EL-GAYAR A. M. Nitric Oxide is à Potential Diagnostic Marker for Hepatocellular Carcinoma. Sci Pharm, 2013;81:763–775.
CrossRef - Rasheed S.S.S , Geetha A.M.A. Evaluation of Oxidative Stress and Nitric Oxide Levels in Patients with Oral Cavity Cancer. Jpn J ClinOncol. 2004;34(7):379-85.
CrossRef - Ekmekcioglu S .E, Ellerhorst J, Smid C.M, Prieto V. G,Munsell M, Buzaid A, Grimm E.A. Inducible Nitric Oxide Synthase and Nitrotyrosine in Human Metastatic Melanoma Tumors Correlate with Poor Survival. Clinical Cancer Research. 2000;( 6):4768–4775.
- Alagöl H, Erdem .E, Sancak .B, Turkmen .G, Camlibel M. G. Nitric oxide biosynthesis and malondialdehyde levels in advanced breast cancer. Australian and New Zealand Journal of Surgery. 1999;69:647–650.
CrossRef - Bakan. E, Taysi.S, Polat.M .F, Dalga. S, Umudum.Z, Bakan.N, Gumus. M. Nitric Oxide Levels and Lipid Peroxidation in Plasma of Patients with Gastric Cancer. .2002;32(5):162-6.

