
Manuscript accepted on :March 21, 2018
Published online on: --
Plagiarism Check: Yes
A. Jayachandran and D. Stalin David
Department of CSE, PSN College of Engineering and Technology, Tirunelveli, India.
Corresponding Author E-mail: ajaya1675@gmail.com
DOI : https://dx.doi.org/10.13005/bpj/1410
Abstract
Medical image classification system is widely used by the radiologists to segment the medical images into meaningful regions. Diabetic retinopathy is an ocular manifestation of diabetes, and diabetics are at a risk of loss of eyesight due to diabetic retinopathy. Diabetes being a blood-related phenomenon, causes vascular changes, which can often be detected visually by examining the retina, since the retina is well-irrigated by blood vessels. Worldwide, DR is a leading cause of blindness among working populations. DR is also the most frequent micro-vascular complication of diabetes. The eye is one of the first places where micro-vascular damage becomes apparent. Though diabetes is still incurable, treatments exist for DR, using laser surgery and glucose control routines. In this article, computer assisted, multi class lesion classification system using hybrid color image structure descriptor and pair of RBF kernel based SVM in retinal images is developed. It classifies the lesions in to Normal and abnormal classes.The overall classification accuracy of HCSID with HKSVM is 94%, HCSID with SVM is 90 % HCSID with RBF is 84% and HCSID with FFNN is 84%.
Keywords
Classification;Feature Extraction;Neural Network Retinal Images; Texture;
Download this article as:| Copy the following to cite this article: Jayachandran A, David D. S. Textures and Intensity Histogram Based Retinal Image Classification System Using Hybrid Colour Structure Descriptor. Biomed Pharmacol J 2018;11(1). |
| Copy the following to cite this URL: Jayachandran A, David D. S. Textures and Intensity Histogram Based Retinal Image Classification System Using Hybrid Colour Structure Descriptor. Biomed Pharmacol J 2018;11(1). Available from: http://biomedpharmajournal.org/?p=19685 |
Introduction
Medical images are used for investigation, education and research and hence its security is of vital importance. Therefore many authentication techniques have been proposed to protect the medical images. Medical images can be split into ROI and RONI portions. ROI is a key area in the medical image as it is used by doctors for investigation and treatment. Medical images are dissimilar in nature. Therefore ROI selection itself is a problem because ROI of different modalities disparate. Even ROIs of two head CT are unlike. There is also a possibility of having multiple ROIs in an image. Therefore automatic feature detection methods could be useful in identifying ROI and RONI. Automated image segmentation shall also be to discriminate ROI and RONI. These tools have the advantage of minimising the task of manual inspection. Another advantage of automated tools is that there is no need to send the ROI vertices to the receiver as it is required by the receiver for verification.1-2
Glaucoma is a degenerative and progressive optic neuropathy which ranks as the second most disabling and blinding disease worldwide. Early diagnosis is the key to prevent progressive and irreversible damage to retinal nerve fibers’ functionality. Funduscopic sign of the retinalnerve fiber layer (RNFL) defect provides an early objective evidence of structural changes inglaucoma which is caused due to the loss of retinal ganglion cell axons.3 Before the visualfield defect begins, the ganglion cells have already sustained a loss of about 50%.4 Current imaging techniques like optical coherence tomography (OCT), GDx offering RNFLD assessment are expensive and require careful interpretation by experts. Moreover, these imaging techniquesare not feasible solution for mass screening and routine checkup of glaucoma in peripheralsettings. In this regard, computer-aided lesion detection using retinal image provides apractical solution for efficient glaucoma risk assessment.5-6
Several studies have been reported in the literature that utilize data-driven approaches to sub-divide a given ROI into several functional subROIs. One approach is clustering based on features, for example the Pearson’s pair-wise correlation between each voxel’s time course within the ROI with that of other brain regions, and then a clustering algorithm is applied to divide the voxels into several sub-groups.7-10 However, most clustering methods require rigorous preprocessing and denoising steps to obtain spatially continuous results since they are very sensitive to outliers. Another approach, based on graph theory, is where each voxel within the ROI is rep-resented by a node in a graph. This graph is then divided into subROIs using modularity detection11 or a normalized cut approach.12 Furthermore, the robustness of the method highly depends on its optimization parameters and tuning the parameters is a challenging task. Therefore there is still a need for a complete framework for functional subROI parcellation that can incorporate both the inter-ROI and intra-ROI connectivity patterns while imposing spatial continuity for subROIs.13 The rest of the paper is organized as follows: Our proposed feature extraction technique is given in section 2 and feature classification is given in section 3. The detailed experimental results and discussions are given in section 4, while the conclusion is summarized in section 4.
Multi Model Feature Extraction Process
Diabetic retinopathy is an ocular manifestation of diabetes, and diabetics are at a risk of loss of eyesight due to diabetic retinopathy. In our proposed feature extraction system consists of colour, structure and shape.The proposed method feature process consists of the following stages
Computing Feature Vector H(V1)
In this work, original image is divided into 4, 18, and 24 grids. The grids are normally square in shape. Gridding results in smaller grids, so that the analysis can be performed easily, then the Feature vector H(V1) is calculated for each intensity values 1 to 255of the original image.
Feature Vector H(V2) using Orientation
Spatial Gray Level Dependence Matrix technique (SGLDM) is utilized in each ROI to extract second ordermeasurable texture features for the analysis.14 This system is in light of the estimation of second order jointconditional likelihood density functions
![]()
Where angle (θ) is varies from 0 to 180 degrees. Each P(i, j | d,θ ) is the likelihood grid of two pixels which are placed with a inter test distance d and direction θhaving a gray level i to j. The calculated value for these likelihood density function is given by
![]()
where Ng is maximum grey level. In this technique, four gray level co-occurrence matrixes for four different directions are acquired for a given distance and the following five statistical texture features are computed for each gray level co-occurrence matrix. Finally, the features such as correlation ,homogeneity, contrast, energy and entropy are extracted and stored in the feature vector H(V2).
Feature Vector H(V3) using TCM
In Texton co-occurrence matrix (TCM), they divided the image into non-overlapping 2 × 2 sub blocks and then they collected the relationship between the pixel gray values in a 2 × 2 sub block for texton image generation. After calculation of texton image, co-occurrence matrix operation is performed on the texton image to form the final feature vector generation. Figure 1 illustrates the texton shapes which are considered for the texton image generation.
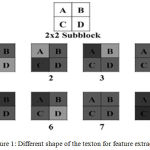 |
Figure 1: Different shape of the texton for feature extraction
|
Then, the block count value is calculated for each intensity value (1-255) on this image. The resultant feature vector H(V3) is obtained from the micro structure image
Feature Vector H(V4) using RGB Plane
Feature vector H(V4) is calculated using Red, Green and Blue plane separately, Here, the relationship of RGB plane of retinal image calculation process is given in the following figure (2). In this technique, the edge detection algorithm is applied in Green plane then the corresponding relationship of Red and Blue plane pixel values are in a 3×3 matrix using various binary pattern , finally the feature vector H(V4) is calculated using histogram.
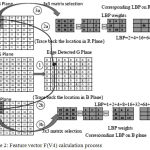 |
Figure 2: Feature vector F(V4) calculation process
|
Concatenated of Four Feature Vectors
Finally the feature vector H(V1),H(V2), H(V3) and H(V4) are concatenated and generate a feature vector H(V)is used for feature classification. It is defined as follows H(V) = H(V1) + H(V2) + H(V3) + H(V4)
Feature Classification
In our feature classification system, various kernels functions are combined and to develop a novel retinal image classification system using SVM. It is a statistical classification algorithm developed using structural risk minimization methods.15-16 It classifies the data into two separate classes that is normal classes and abnormal classes. In SVM, the kernel functions are used to maximize the margin between different classes. The margin is 1/||w||. Maximizing the margin 1/||w|| is equivalent to minimizing ||w||2, whose solution is found after resolving the following quadratic optimization problem:
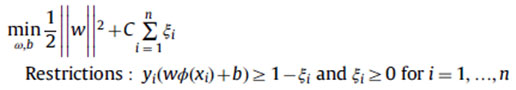
By using the duality theory of optimization is defined as follows
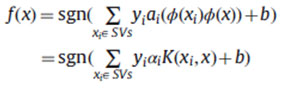
There are several kernel functions, and the generally used kernel functions are given as follows:
Linear kernel k (x,xi) = (xT xi)
Polynomial kernel k (x,xi) = (γ (xT xi) +r)d ,γ>0
RBF kernel k (x,xi) = exp(-||γ x – xi ||2) ,γ>0
Sigmoid kernel k (x,xi) =tanh (γ (xT, xi) +r)
Where y,d,r are kernel parameter for each kernel function
Experimental Results and Comparative Analysis
The experimental image data set contains 100 retinal images ( 80 images for abnormal and the remaining 20 images for normal) that are collected from Government medical college hospital, Tirunelveli, Tamilnadu, India. The normal and abnormal image is shown in Fig 2.
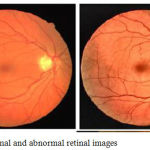 |
Figure 2a: Normal and abnormal retinal images
|
The classification performance of our proposed system is evaluated using the following metrics such as sensitivity,specificity and accuracy.17
Sensitivity = TP/(TP+FN)
Specificity = TN/(TN+FP)
Accuracy = (TN+TP)/(TN + TP+ FN+FP)
Error rate = 1 – Accuracy
The investigational results of CSID with Hybrid SVM and other neural network based classifier are shown in Table 1 and the results are visualized in Figure 3.
Table 1: Experimental results of the proposed and exiting system
|
Evaluation metrics |
CSID + SVM | CSID+ RBF | CSID + FFNN | Our Proposed Approach | ||
| k1+k2 | k1 k2 | |||||
| Input MRI image data set | True Positive(TP) | 37 | 35 | 30 | 38 | 38 |
| True Negative(TN) | 8 | 7 | 6 | 9 | 9 | |
| False Positive(FP) | 2 | 3 | 4 | 1 | 1 | |
| False Negative(FN) | 3 | 5 | 10 | 2 | 2 | |
| Sensitivity | 0.925 | 0.875 | 0.75 | 0.95 | 0.95 | |
| Specificity | 0.8 | 0.7 | 0.6 | 0.9 | 0.9 | |
| Accuracy | 0.9 | 0.84 | 0.72 | 0.94 | 0.94 | |
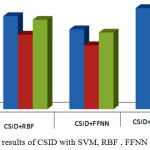 |
Figure 3: Comparison results of CSID with SVM, RBF , FFNN and HKSVM
|
Conclusion
Manual segmentation results look better because it involves human intelligence but the disadvantage is that the results may differ from one person to another person and takes long time. A novel fully automatic , multi class image classification approach using Color image hybrid structure descriptor and pair of RBF kernel based SVM has been developed. In this research work ,Pair of RBF kernel functions are combined for multi class retinal image classification. The overall classification accuracy of HCSID with HKSVM is 94%, HCSID with SVM is 90 % HCSID with RBF is 84% and HCSID with FFNN is 84%..
Reference
- Juuti-Uusitalo K., Delporte C., Grégoire F., Perret J., Huhtala H., Savolainen V., et al. Aquaporin expressionand function in human pluripotent stem cell-derived retinal pigmented epithelial cells. Invest Ophthalmol.Vis Sci. 2013;54:3510–3519.
CrossRef - Schwartz S. D., Hubschman J. P., Heilwell G., Franco-Cardenas V., Pan C. K., Ostrick R. M., et al. Embryonicstem cell trials for macular degeneration: a preliminary report. Lancet. 2012;379:713–720.
CrossRef - Croze R. H., Buchholz D. E., Radeke M. J., Thi W. J., Hu Q., Coffey P. J., et al. ROCK Inhibition Extends Passageof Pluripotent Stem Cell-Derived Retinal Pigmented Epithelium. Stem Cells Transl Med. 2014; cell-derived RPE cultures. Investig. Ophthalmol Vis Sci. 2013;54:6767-6778.
- Jiang Y., Qi X., Chrenek M. a., Gardner C., Boatright J. H , Grossniklaus H. E., et al. Functional principal componentanalysis reveals discriminating categories of retinal pigment epithelial morphology in mice.Invest Ophthalmol Vis Sci. 2013;54:7274–7283.
CrossRef - Vugler A., Carr A. J., Lawrence J., Chen L. L., Burrell K., Wright A., et al. Elucidating the phenomenon ofHESC-derived RPE: anatomy of cell genesis, expansion and retinal transplantation. Exp Neurol. 2008;214:347–361.
CrossRef - Nanni L., Lumini A., Brahnam S. Local binary patterns variants as texture descriptors for medical imageanalysis. ArtifIntell Med. 2010;49:117–125.
CrossRef - Paci M., Nanni L., Lahti A., Aalto-Setala K., Hyttinen J., Severi S. Non-Binary Coding for Texture Descriptorsin Sub-Cellular and Stem Cell Image Classification. Curr. Bioinform. 2013;8:208–219.
CrossRef - Vécsei A., Amann G., Hegenbart S., Liedlgruber M., Uhl A. Automated Marsh-like classification of celiacdisease in children using local texture operators. Comput. Biol Med. 2011;41:313–325.
CrossRef - Nosaka R., Fukui K. HEp-2 cell classification using rotation invariant co-occurrence among local binarypatterns. Pattern. Recognit. Elsevier. 2014;47:2428–2436.
CrossRef - Haralick R., Shanmugam K. D. Textural features for image classification. IEEE Trans Syst ManCybern. 1973;3:610–621.
CrossRef - Hu S., Xu C., Guan W., Tang Y., Liu Y. Texture feature extraction based on wavelet transform and graylevelco-occurrence matrices applied to osteosarcoma diagnosis. Biomed Mater Eng. 2014;24:129–143.
- Jayachandran A., Dhanasekaran R. Brain tumor severity analysis using modified multi-texton histogram and hybrid kernel SVM. Int. J. Imaging Syst. Technol. 2014;24(1):72–82.
CrossRef - Ojala T., Pietikäinen M., Mäenpää T. Multiresolution Gray-Scale and Rotation Invariant Texture Classificationwith Local Binary Patterns. IEEE Trans Pattern Anal Mach Intell. Los Alamitos, CA, USA. IEEE Computer Society. 2002;24:971–987.
- Matsui M., Tashiro T., Matsumoto K., Yamamoto S. A study on automatic and quantitative diagnosis of fundus photographs. I. Detection of contour line of retinal blood vessel images oncolor fundus photographs (author’s transl.). Nippon Ganka.Gakkai. Zasshi. 1973;77(8):907–918.
- Baudoin C. E., Lay B. J., Klein J. C. Automatic detection of microaneurysms in diabetic fluoresceinangiography. Rev Epidemiol. Sante. Publique. 1984;32(3–4):254–261.
- Sonka M., Hlavac V., Boyle R. Image Processing, Analysis, and Machine Vision. 3. Toronto,Canada: Thomson Engineering (1st edition Chapman and Hall, London, 1993; 2nd editionPWS, Pacific Grove, CA, 1997). 2008.
- Jayachandran A., Dhanasekaran R. Severity analysis of brain tumor in MRI images uses modified multi-texton structure descriptor and kernel- SVM. Arab. J. Sci. Eng. 2014;39(10):7073–7086.
CrossRef

