
Manuscript accepted on :February 15, 2018
Published online on: --
Plagiarism Check: Yes
Nijil Raj N1 and T. Mahalekshmi2
1Department of Computer Science and Engineering Younus College of Engineering and Technology, Vadakkevila,Kollam-691010, India.
2Sree Narayan Institute of Technology Vadakkevila, Kollam-691010, India.
Corresponding Author E-mail: nijilrajn@ymail.com
DOI : https://dx.doi.org/10.13005/bpj/1353
Abstract
Multi-label classification methods are important in various fields,such as protein type,protein function, semantic scene classification and music categorization . In multi-label classification, each sample can be associated with a set of class labels. In protein type classification, one of the major types of protein is membrane protein. The Membrane proteins are performing different cellular processes and important functions, which are based on the protein types. Each membrane protein have different rolls at the same time. In this study we proposes membrane protein type classification using Decision Tree (DT) classification algorithm. The DT classifies a membrane protein into six types . An essential set of features are extracted from the membrane protein dataset S1 which are used for the proposed method,and it was revealed an accuracy of 69.81%, whereas existing methods network based and shortest path revealed an accuracy of 66.78%,54.97%.The accuracy got in the existing methods are not for the full set of protein in dataset S1, but it is achieved after removal of few unannotated protein. Both accuracy wise and complexity wise, the proposed method seems to be better than the existing method
Keywords
DT; Multi-Label Classification; Membrane Type Classification
Download this article as:| Copy the following to cite this article: Nijil R. N, Mahalekshmi T. Multilabel Classification of Membrane Protein in Human by Decision Tree (DT) Approach. Biomed Pharmacol J 2018;11(1). |
| Copy the following to cite this URL: Nijil R. N, Mahalekshmi T. Multilabel Classification of Membrane Protein in Human by Decision Tree (DT) Approach. Biomed Pharmacol J 2018;11(1). Available from: http://biomedpharmajournal.org/?p=19054 |
Introduction
Multilabel classification methods are progres- sively used in recent research works, protein function, protein type, semantic scene classification and music categorization. A general form of multi class classification is Multi-label classification. It is single-label problem of grouping instances into one of more than two classes. The main feature of multi-label problem is that the instance can be assigned to any number of classes. We proposes a multi label classification of different types of membrane proteins by implementing DT classifier algorithm. Membrane proteins play different roles in cellular biology. About 30% of human genomes have been encoded from membrane proteins. Information of a given membrane protein type helps to determine its function. Membrane proteins are refereed as membrane associated proteins or membrane-bound proteins. They are classified on the basis of their interaction modes with membranes, and cellular lo-cations. Membrane proteins play important role in-volved in various cellular processes.1 The number of membrane proteins in humans is to 8000 as per the estimation of Gao et al.2 According to Krogh et. al3 20-30% of genes are involved in encoding membrane proteins. The role of membrane proteins the discovery of new drugs as well as in the analyses of the mechanism of cellular activities is worth mentioning.4,5,6 All membrane protein func-tions are usually related with its type.7 Application of traditional biophysical methods8 are time con- suming and costly while determining the types of uncharacterized membrane proteins. On the basis of the interactions between membrane proteins and membrane, H. Lodish et. al9 membrane protein are divided in to two types intrinsic and extrinsic mem-brane proteins. (Fig.1)
Transmembrane protein(Integral membrane pro-teins) are permanently bound to the biological mem-brane. Peripheral membrane proteins are temporar-ily attached to a membrane or integral membrane proteins. Integral membrane proteins are classified as Transmembrane proteins and Anchored mem- brane proteins. Transmembrane proteins are type putational method is an urgent need for the protein functional type prediction. This paper proposed a multi-label classification of membrane proteins in humans, using DT classifier algorithm. For that datasets S1 is constructed from UniProt database. It is reported from the performance of this method that it could be quite effective to classify membrane protein types.
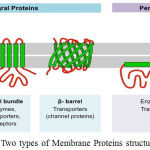 |
Figure 1: Two types of Membrane Proteins structure
|
I,type II, and Multi-pass, whereas Anchored mem-brane proteins are Lipid and GPI. Based on the positions and intramolecular arrangements in a cell, membrane proteins are classified into six types,10 shown in Fig.2.
![Figure 2: Schematic illustration to show the six types of membrane proteins: (a) type I, (b) type II, (c) multipass transmembrane (MPT), (d) lipid chain-anchored membrane (LCM), (e) GPI-anchored membrane, and (f) peripheral membrane(PM). [11].](https://biomedpharmajournal.org/wp-content/uploads/2018/02/Vol11No1_App_Mar_fig22-150x150.jpg) |
Figure 2: Schematic illustration to show the six types of membrane proteins: (a) type I, (b) type II, (c) multipass transmembrane (MPT), (d) lipid chain-anchored membrane (LCM), (e) GPI-anchored membrane, and (f) peripheral membrane(PM). [11].
|
In MPT, the polypeptide crosses the lipid bilayer multiple times, i.e, spanning the membrane more than once. LCM are covalently linked to a lipid molecule and serve to anchor them to either the cytoplasmic or extracellular surface of a biological membrane. GPI-anchored membrane protein is also called membrane-anchored proteins. It is bound to the membrane by a glycosylphosphatidylinositol (GPI) anchor.
Membrane proteins are a common type of pro-teins along with soluble globular proteins, fibrous proteins, and disordered proteins. They are tar- gets of over 50% of all modern medicinal drugs.12 It is estimated that 20-30% of all genes in most genomes encode membrane proteins.3 Thus classification of membrane proteins into six types is a resource intensive and time consuming task. Therefore, developing a reliable and effective com-
Related Work
The computational methods used for the clas- sification of membrane proteins include analyti-cal methods, mathematical modelling and simula- tion. The bioinformatics application generally use strategical analysis methods, like machine learning methods for the classification and prediction of membrane proteins.
For the successful implementation of machine learning techniques are equally important. both fea- ture extraction and learning algorithms are equally required. Feature predictions commonly used are: amino acid composition (AAC), position-specific scoring matrices (PSSMs), pseudo amino acid com- position (PseAAC), physicochemical properties of amino acids and functional domains. AAC was simplest and most efficient represention of protein sequence. Membrane proteins are classified accord- ing to two different schemes by Kuo et al13 which are based on protein types and its location. Their dataset was constructed from the SWISS PROT (release 35) database. The rate of correct prediction of membrane proteins type and cellular location revealed that 76-81% and 66-70 % by using the self consistency ,jackknife tests, as well as by an independent dataset test. This method was improved by using N-Terminal Amino Acid Sequence.14 It also used the dataset from SWISS-PROT database, from which all sequences were extracted and some of the inappropriate sequences were removed before redundancy reduction. It was undertaken to avoid problems related to redundant data during Neural Networks training and testing. A success rate of 85% (plant) or 90% (non plant) on redundancy reduced test sets were observed.
Garg et el.15 introduced a systematic ap- proach for predicting subcellular localizations(SL) of human proteins. A set of human proteins with experimentally annotated SL has been retrieved from the SWISS-PROT database.16 The final dataset consists of 3780 protein sequences that belong to 11 SL. The SVM-based modules for predicting SL using traditional amino acid and dipeptide (i+1) composition achieved accuracy of 76.6% and 77.8%. PSI-BLAST, when carried out using a similarity-based search against a nonredun- dant database of experimentally annotated proteins, yielded 73.3% accuracy. Yu-Dong at el.8 pro- posed a new method for predicting the membrane protein types using the Nearest Neighbor Algorithm. They used manually constructed dataset from Swiss- Prot (http://cn.expasy.org/, release 51.2)17 mainly according to the annotation line stated as SL, to classify the six types of membrane proteins. The predictor achieved the accuracy of 87.02 by using the 56 most contributive features %.
Lipeng at el.18 proposed a new method in which, protein can be represented by a high di- mensional feature vector by using Dipeptide com- position method. They used only 2059 membrane protein sequences from the dataset prepared by Chou and Elord. Based on the reduced low dimen- sional features KNN classifier was introduced to identify the membrane protein types, with predic- tion accuracy of 82.0%.13 Jei Lein et el.19 classified protein based on Chou’s pseudo amino acid compostion with an Ensemble classifier. The protein locations are classified into 5 types. The testing and training dataset that they used originally was prepared by Cedano et al. (1997).20 The com- posite KNN classifier predicted the proteins with location types (1) nuclear proteins, (2) intracellular proteins (non-nuclear), (3) extracellular proteins, (4) anchored membrane proteins, and (5) integral membrane proteins (M,A,E,I,N) with accuracy of 90.0%, 70.8%, 74.2%, 81.5%, 82.5% respectively.
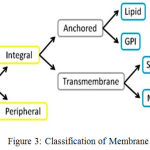 |
Figure 3: Classification of Membrane Proteins
|
For classifying 6 types of membrane proteins 3 methods such as, BLAST/PSI-BLAST Method, Network-Based Method, Shortest-Distance Method were introduced by Huang at el.21 They proposed an integrated approach to predict multiple types of membrane proteins by employing sequence homology and protein-protein interaction network.22 According to their positions and intramolecular arrangements in a cell, membrane proteins are classified into six types : (1) GPI (Glycosylphosphatidylinisotol)-anchor; (2) Lipid-anchor (LCM); (3) Multi-pass (MPT); (4) Peripheral(PM); (5) Single-pass type I; (6)Single- pass type II membrane proteins shown in Fig 3. To evaluate the performance of classification method, the sequence clustering program CD-HIT was employed (Cluster Database at High Identity with Tolerance)23 to construct three datasets: S1, S2, S3 from 3789 proteins. S1 contained 2935 protein sequences in which protein had less than 70% sequence similarity. S2 contained 2120 protein sequences in which protein had sequence similarity lower than 40%. S3 contained 1475 protein sequences with sequence identity less than 25%. The BLAST/PSI-BLAST method achieved the best performance with the highest accuracy 94.71%, 91.15% and 85.02% on datasets S1, S2 and S3, respectively. However, 481, 529 and 620 proteins cannot be annotated from data set. The network-based method achieved the second highest accuracy, i.e. 66.68%, 62.46%, 58.75% on the three datasets,S1,S2,S3 respectively. Since no interactive proteins can be found in the corresponding datasets, there were 86, 38, 41 proteins unannotated. The shortest distance method was capable of annotating all proteins, although it was least effective with lowest Accuracy achieved (54.97%, 48.75%, 44.99% on the three datasets, respectively). The proposed method is capable of annotating all proteins from the dataset S1. It uses 967 features from each of the membrane protein sequences.
Methods and Methodology
Dataset
A total of 3789 human membrane protein sequence were downloaded and verified from Uniprot Protein database (release 2012). To eval- uate the performance of the prediction method, W. Li et al23 use the sequence clustering pro-gram CD-HIT (Cluster Database at Height Identity Tolerance)24 to prepare the benchmark set of data S1 from 3789, containing 2935 proteins sequences with sequence similarity less than 70%. In our pro-
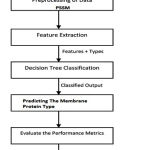 |
Figure 4: The work flow diagram of the DT method posed method we use the dataset S1 (2935 proteins) used for classification.
|
Methodology
The flow diagram for the proposed methodology is in Fig: 4 and the step by step procedures are as follows:
Step 1: Start.
Step 2: Input Dataset S1 (2935 membrane protein seuence)
Step 3: Preprocessing the data from the data set S1, and create position specific scoring matrix (PSSM)
Step 4: Extract the feature set from the dataset S1.
Step 5: Apply the DT classifier algorithm for classifying memberane protien types.
step 6: Evaluate the performance matrices.
step 7: stop.
Preprocessing of Data
The S1 datasets of proteins are preprocessed according to their types and Protein id from the training dataset. For this create a Position Specific Scoring Matrix (PSSM) of the datasets. The PSSM is the numerical representa- tion of proteins in the dataset, which are presented in the 6 types of membrane proteins. The PSSM matrix consists of zeros and ones. If a Protein is presented in one or more membrane protein type, its entry in PSSM matrix is represented with ones, otherwise it is represented as zeros. This PSSM matrix is used for the evaluation of performance metrics.
Feature Extraction: Features are usually extracted from the protein sequence. A sequence comprises of 20 unique amino acids namely A,C,D,E,F,G,H,I,J,K,L,M,N,P,Q,R,S, T,V, W, and Y. Even though all amino acids have a common basic chemical structure, they exhibits different chemical properties becuase of the differences in their side chains. Proteins are represented by a chain of amino acids. The difference in the amino acid string among proteins is due to their order and total number (length of the sequence). The proposed DT classification used 968 distinct features.Extracted features are as follows:
Sequence length
The total number of amino acids in the given protein sequence. For example: the sequence length of ’acdfgyrsmeacvss’ is 15
Hydrophobicity
The hydrophobicity of an amino acid is related to its transfer free energy from a polar medium (such as the cytoplasm) to another polar medium (like a membrane). The transfer free energy depends on the chemical nature of the two solvents, as well as on the structural context of the amino acid residue. The hydrophobicity index is a measure of the relative hydrophobicity i.e, this index is used to measure the hydrophobic affinity of a protein sequence or an amino acid sequence. In a protein, hydrophobic amino acids are likely to be found in the interior, whereas hydrophilic amino acids are likely to be in contact with the aqueous environment.
AAindex
It is a database representing numerical values of various physicochemical and biochemical properties of amino acids and pairs of amino acids. AAindex25 for the amino acid index of 20 numerical values. It gives a total 544 features. Every year the updated version(9.0) of AAindex is released
Di-Amino Acid
Amino acids frequency is the number of combinations of amino acid residue. The count of the combination of sequence pattern AA,AC,.., AY,CA,CC,…CY, and..,YA,YC, .., YY in the protein sequence is called the amino acid frequency. From this ,only count the combination of sequence patterns of Amino acid A,C,D, E. For example the sequence AA, AC, AD, AE,.. AY (20 numbers) and CA, CC, CD, CE…CY (20 numbers), and DA, DC, DD, …, DY (20 numbers) and EA, EC, ED,…EY (20 numbers) are counted. As a total of 400 features are generated as frequency for a particular Protein sequence.
Count of Each Amino Acid Residues
Amino Acid residues are the building block of proteins. Count of each amino acid residue is one of the feature used. For example, let ’AANDCC’ be a amino acid sequence, count of amino acid residue A is 2, D is 1, C is 2 and N is 1. A total 20 features are collected as count for each amino acid.
Molecular Weight
Molecular weight is the mass of a molecule. The size of a protein can be represented with the number of amino acids con- tained in that protein or by using molecular weight. It is represented by unit of Daltons or in Kilo Daltons (KDa). (http://www.sciencegateway.org/tools/) tools used for finding the molecular weight of a protein from its protein sequence. For example, molecu- lar weight of the sequence ’’Acdefghiklmn- Pqrstvwy’ is 2.4 kilodaltons, and protein with protein id Q9P299 has the molecular weight of 23679.0820 KDa.
Decision Tree Classification (DT)
A DT is a decision support tool that uses a tree structure graph or model of decisions and their possible consequences, including chance event outcomes, resource costs, and utility. Decision trees are com- monly used in operations research, specifically in decision analysis, to identify a strategy most likely to reach a goal. A DT is a flowchart-like struc- ture:internal node represents a test on an attribute, branch represents the outcome of the test and leaf node represents a class label (decision taken after computing all attributes). The paths from root to leaf represents classification rules. The extracted features are provided as input to DT classifier. The DT classifies the protein types into six types according to the rule, with classification accuracies 69.81%, on the dataset S1.
Table 1: List of Features from Dataset S1
| Di –Amino Acid | 400 |
| Hydrophobicity | 1 |
| Aaindex | 544 |
| Count of Each Amino Acids | 20 |
| Sequence Molecular | 1 |
| Weight | 1 |
| Total | 967 |
Performance Metrics
The overall classification accuracy of a classification model is evaluated using Self Consistency test. It use training and testing the model with same dataset. This test is also termed as Resubstitution test, which is used to test the dataset. For multi-label classification, the concepts such as Precision, Recall, Accuracy26 are used to measure the performance of methods. The following standard parameters are used to evaluate the performance of clasifier.27 In order to find the values of Precision, Recall, Accuracy, calculate the True Positive(tp), True Negative(tn), False Positive (fp), False Nega- tive (fn). For that calculate the count of 1 values and 0 values in actual score matrix. Then generate the total count of 0 and 1 as N. Next calculate tp which is the count of 1 values in the intersection of actual score matrix and predicted score matrix. Similarly tn is the count of 0 values in the intersection of actual score matrix and predicted score matrix. fp and fn are calculated using the equation (1) and (2),
fp = n − tn (1)
fn = p − tp (2)
Using these values, calculate Accuracy, Precision, Recall from the following equations.
Accuracy
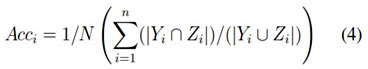
It is the percentage prediction of true examples ie, True prediction divided by the total number of examples. The accuracy is defined by the equation (3), but more generalised form is shown in the equation (4)
Accuracy = (tp + tn)/N (3)
Let D is a dataset with N instances. Let Yi and Zi are the set of original and predicted labels, respectively, where i D, then the accuracy becomes,
Precision
It is the number of correct predictions divided by the number of all returned prediction. It is calculated using the following equa- tion (5), but more generalized form is shown in the equation (6)
P = tp + fp P recision = tp/p (5)
Recall
It is the number of correct pre- dictions divided by the number of predictions. It is calculated using the following equation (7), but more generalised form is shown in the equation (8)
p = tp + f n Recall = tp/p (7)
Results and Discussion
This section depicts the results of both existing Network Based Method, Shortest Distance Method and proposed DT classification. The results of pro- posed method is compared with results of existing methods. From the analysis, the Decision Tree clas- sifier is an efficient multi-label classifier for classify- ing the human membrane proteins into the following six classes, (1) Single -pass type I, (2)Single-pass type II, (3) Multi-pass, (4) Lipid-anchor, (5) GPI (Glycosylphosphatidylinisotol)-anchor, (6) Periph- eral membrane proteins.
The proposed DT classification Results are shown in the Table. II. The Fig.5 illustrate the pie chart representation of decision tree classification on dataset S1. The multipass, lipid, GPI, peripheral, type1, type2 membrane proteins are represented by the colours, green, yellow, orange, brown, dark blue, light blue respectively, From the 2935 proteins from S1, more number of proteins are classified as multipass membrane proteins and less number of proteins as GPI anchored membrane proteins.
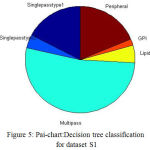 |
Figure 5: Pai-chart:Decision tree classification for dataset S1
|
Each membrane protein can have labeled in one or more types, Fig.6 shows the number of pro- teins having 1-6 types of the dataset S1. In dataset S1, almost 510 membrane proteins are classified as Type1, 119 proteins as Type2, 1543 proteins as Multipass, 157 proteins as Lipid, 57 as GPI, and 549 proteins as Peripheral. Therefore in DT classifica- tion ,the more number of proteins are classified as Multipass and the less number of proteins as GPI in all the dataset s1. The Accuracy, Precision, Recall, are calculated and the results are shown in Table II. The Multi label Protein classification using DT gives better results with all the annotated proteins, when compared to the existing methods with few number of unannotated proteins. The clas- sification accuracy is reached 69.81% on dataset S1
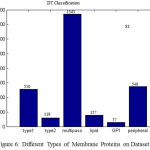 |
Figure 6: Different Types of Membrane Proteins on Dataset S1
|
Table 2: Performances of Decision Tree classification tested on dataset s1
| Dataset | Accur Acy | Precisi on | Recall |
| S1 | 69.81% | 0.1165 | 0.1157 |
The proposed DT classification performs clas- sification on the dataset S1. This method uses the ONE type, TWO types,THREE types.Y axis repre- sent the total count of correct predicted membrane proteins in each type. 2482 one type membrane proteins and 34 two type membrane proteins .Very few of them are partially predicted in and some of them are not correctly predicted.
The Fig.7 shows the correct prediction of differ- ent multi-type membrane proteins in data set S1. X axis represent the types of membrane proteins like whole number of proteins from the dataset for the classification purpose. Its classification accuracies are presented in the Table. III. It is obvious that the DT method contributed the most, annotating 2935 proteins and achieved Accuracy of 69.81%, on datasets S1, but the network-based method number of annotated protein are 467 from the dataset S1, and obtained Accuracy of 66.68%, and shortest-distance method with Accuracy of 54.97%, on the dataset S1.
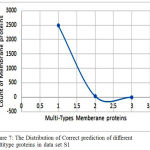 |
Figure 7: The Distribution of Correct prediction of different multitype proteins in data set S1
|
Table 3: Comparison Of Classification Method
| Dataset | Classification Methods | |||||
| S1 | Network | Shortest | DT | |||
| ACC
66.68% |
NU*
86 |
ACC
54.97% |
NU*
0 |
ACC
69.81% |
NU*
0 |
|
The Fig 8 shows the performance of exist-ing and proposed method accuracies. This bar graph shows the classification methods like Network method(NWM), Shortest distance method(SDM), and the proposed Decision tree(DT) classification in Y axis and the corresponding accuracies in the X axis.
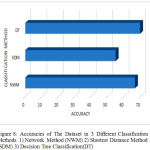 |
Figure 8: Accuracies of The Dataset in 3 Different Classification Methods 1) Network Method (NWM) 2) Shortest Distance Method(SDM) 3)Decision Tree Classification (DT)
|
Conclusion
In multi-label classification ,each sample can be associated with a set of class labels.This paper proposed a DT classification algorithm. The 2935 membrane proteins of the datasets S1 are classified using Decision Tree based on the 967 features extracted from these proteins. As a result, the Deci- sion Tree classifier with most contributive features achieved an acceptable accuracy of 69.81% of the dataset compared to the existing network based and shortest path method.
Conflict of Interest Statement
The authors declare that they have no competing interests.
Acknowledgment
The authors would like to acknowledge to Guohua Huang, Institute of system biology, China, Yuchao Zhang, Department of Maths, Shoyang University, China, Lei Chan, CIE, SM University, China, Ning Zhang, Dept. of BME, Tianjin University, China, supporting for this work.
References
- Almen M.S, Nordstrom K.J, Fredriksson R and Schioth H. B. “Mapping the human membrane proteome: a majority of the human membrane proteins can be classified according to function and evolutionary origin,” BMC biology. 2009;7(1):1.
- Gao Q-B,Ye X-F, Jin Z.-C and He J. “Improving discrimi- nation of outer membrane proteins by fusing different forms of pseudo amino acid composition,” Analytical biochemistry. 2010;398(1):52–59.
CrossRef - Krogh A, Larsson B, Heijne G.V and Sonnhammer E. L. “Predicting transmembrane protein topology with a hidden markov model: application to complete genomes,” Journal of molecular biology. 2001;305(3):567–580.
CrossRef - Arinaminpathy Y, Khurana E, Engelman D.M and Gerstein M.B. “Computational analysis of membrane proteins: the largest class of drug targets,” Drug discovery today. 2009;14(23):1130–1135.
CrossRef - Davey J. “G-protein-coupled receptors: new approaches to maximise the impact of gpcrs in drug discovery,” Expert opinion on therapeutic targets. 2004;8(2):165–170.
CrossRef - Terstappen G. C and Reggiani A. “In silico research in drug discovery,” Trends in pharmacological sciences. 2001;22(1):23–26.
CrossRef - Wang J,Li Y, Wang Q, You X, Man J, Wang C and Gao X. “Proclusensem: predicting membrane protein types by fusing different modes of pseudo amino acid composition,” Computers in biology and medicine. 2012;42(5):564–574.
CrossRef - Jia P, Qian Z, Feng K, Lu W, Li Y and Cai Y. “Prediction of membrane protein types in a hybrid space,” Journal of proteome research. 2008;7(3):1131–1137.
CrossRef - Lodish H, Baltimore D, Berk A, Zipursky S.L, Matsudaira P and Darnell J. Molecular cell biology. Scientific American Books New York. 1995;3.
- Chou K.C and Cai Y.D.“Prediction of membrane protein types by incorporating amphipathic effects,” Journal of chem- ical information and modeling. 2005;45(2):407–413.
CrossRef - A. A. D. H. C. C. E. K. Murzin A. G. “Scop2 prototype: a new approach to protein structure mining,” Nucleic Acids Research. 2014;42:d310–d314.
CrossRef - Overington J.P, Al-Lazikani B. and Hopkins A.L. How many drug targets are there? Nature reviews Drug discovery. 2006;5(12):993–996.
CrossRef - Chou K.C and Elrod D.W. “Prediction of membrane protein types and subcellular locations,” Proteins: Structure, Function and Bioinformatics. 1999;34(1):137–153.
CrossRef - Emanuelsson O, Nielsen H,Brunak S and Heijne G.V. “Predicting subcellular localization of proteins based on their n-terminal amino acid sequence,”Journal of molecular biology. 2000;300(4):1005–1016.
CrossRef - Garg A,Bhasin M and Raghava G. P. “Support vector machine-based method for subcellular localization of human proteins using amino acid compositions, their order, and simi- larity search,”Journal of biological Chemistry. 2005;280(15):14 427–14 432.
- Bairoch A and Apweiler R. “The swiss-prot protein sequence database and its supplement trembl in 2000,”Nucleic acids research. 200;28(1): 45–48.
CrossRef - Boeckmann B, Bairoch A, Apweiler R, Blatter M.C, Estreicher A, Gasteiger E, Martin M.J, Michoud K,Donovan C.O, Phan I. et al. The swiss-prot protein knowl- edgebase and its supplement trembl in 2003, Nucleic acids research. 2003;31(1):365–370.
CrossRef - Wang L, Yuan Z,Chen X and Zhou Z. The prediction of membrane protein types with npe, IEICE Electronics Express. 2010;7(6):397–402.
CrossRef - Lin J, Wang Y and Xu X. “A novel ensemble and composite approach for classifying proteins based on chous pseudo amino acid composition,” African Journal of Biotechnology. 2011;10(74):16 948–16 952.
- Cedano J, Aloy P, Perez-Pons J. A and Querol E.“Rela- tion between amino acid composition and cellular location of proteins,” Journal of molecular biology. 1997;266(3):594–600.
CrossRef - Huang G, Zhang Y, Chen L, Zhang N, Huang T and Cai Y.D. “Prediction of multi-type membrane proteins in human by an integrated approach,” PloS one.2014;9(3):e93553.
CrossRef - Consortium U. et al. “The universal protein resource (uniprot) in 2010,” Nucleic acids research. 2010;38(1):D142– D148.

