
Manuscript accepted on :November 20, 2017
Published online on: --
Plagiarism Check: Yes
Ammi Reddy Pulagam1, Venkata Krishna Rao Ede2 and Ramesh Babu Inampudi3
1Vasireddy Venkatadri Institute of Technology, Nambur, Guntur, AP, India.
2Lakireddy Bali Reddy College of Engineering, Mylavaram, Vijayawada, AP, India.
3Acharya Nagrjuna University, Nagarjuna Nagar Guntur, AP, India.
Corresponding Author E-mail: pulagamammireddy@gmail.com
DOI : https://dx.doi.org/10.13005/bpj/1325
Abstract
Traditional statistical thresholding algorithms use only class variance sum as a standard for threshold selection. These algorithms overlook characteristics of surrounding thin airways and fail to obtain without leakage. The airways are the leakage of fluid into the surrounding lung parenchyma which would result in low contrast between the airways and the lung parenchyma due to noise or pathologies. We propose, a novel criterion combining the class variance sum and discrepancy of variances in between thin airways and lung parenchyma to eliminate the described drawback for traditional statistical process. After that, we use morphological methods to identify candidate airways on CT slices and then reconstruct a connected three dimensional airway tree. Extensive validation work was done using Lung TIME database. The experimental airway test results substantial increase number of branches and total tree length. From inspiration scans on the mean number of branches detected is 46.5%, the tree length detected is 42.33% and the number of false positives is 0.28%.
Keywords
Computed Tomography; Lung Region; Segmentation; Airways
Download this article as:| Copy the following to cite this article: Pulagam A. R, Ede V. K. R, Inampudi R. B. Segmentation of Airways in Lung Region Using Novel Statistical Thresholding and Morphology Methods. Biomed Pharmacol J 2017;10(4). |
| Copy the following to cite this URL: Pulagam A. R, Ede V. K. R, Inampudi R. B. Segmentation of Airways in Lung Region Using Novel Statistical Thresholding and Morphology Methods. Biomed Pharmacol J 2017;10(4). Available from: http://biomedpharmajournal.org/?p=17895 |
Introduction
Lung airways are the breathing structures for inhalation and exhalation of the air process into and out of the lungs. These airways split into smaller and smaller branches from trachea to alveoli. The airways structure is depicted as a binary tree. The trachea splits into two primary branches (bronchus), which progress into the right and left. The primary bronchus splits further into two left, three right lobar bronchi that enter each lung lobe, respectively. The lobar bronchus repetitively splits until 8-10 bronchi trees in every lung region. The airways end in air sacs (alveoli) in which carbon dioxide and oxygen is swapped through air-blood barrier. These airways incorporate a composite and highly variable set of structures. Airways are pathologically concerned in various lung diseases resulting in direct exposure to airborne pathogens. This exposure results in diseases such as bronchiectasis with chronic infection, inflammation, and obstruction.1 Airway wall thickening is associated with airway narrowing resulting in bronchitis and asthma. Tumors on airway wall may create obstructions. These diseases are connected with high morbidity, and mortality.2 Hence, precise extraction and quantitative evaluation of airway morphology related features is needed in clinical perform for evaluating the existence or severity of specific diseases for treatment. Due to inherent complexity of the airways and surrounding lung parenchyma resolution limitations of computed tomography (CT), manual observing and analysing airways is an enormously challenging task. Even though advanced CT techniques enabled visualization of 3D lung structures, it is very time consuming for segmenting airways manually. It is due to the complexity of bronchial structure and the involvement of a large quantity of CT slices in a single examination process more than seven hours of intensive work per case.3 There are typically large errors associated with subjective assessments in terms of inter and intra observer variability.4,5 Consequently, the availability of automated, reliable and accurate computerized segmentation for this purpose could be of great value.
Chest CT slices exemplify the airway lumen as a dark surrounded by a bright airway wall. Many airway segmentation approaches have been proposed and subsequently investigated in the literature, a common approach to segment the airway is to use variants of gray value. A wide diversity of algorithms has been developed to segment the airways.7- 20 Among these algorithms, region growing procedure is a commonly used technique for segmentation of the airways. All methods are rule-based mostly relying on region growing, morphology, or a combination of the two. The main problem of region growing approach to find the airways is the leakage of fluid into the surrounding lung parenchyma which would result in low contrast between the airways and the lung parenchyma due to noise or pathologies such as emphysema.20 These problems occur normally in the extraction of thin airways where image artifacts or noise have a relatively high impact on the detectability of thin airways. These problems are exaggerated in the presence of lung diseases such as interstitial lung disease (ILD) or chronic obstructive pulmonary disease (COPD).
Therefore, region growing often results in leakage into the lung parenchyma. To resolve these issues, rules that limit the region growing, so as to grow only in tubular shapes or local image descriptors. Most of the algorithms have been evaluated on a small number of scans. A common feature in all these algorithms was how to fetch a good tradeoff between increasing the tree length and reducing the leaks. Segmenting small bronchi without leakage was the conclusion drawn to circumvent this problem In this paper, we propose a new method to development of an advanced thresholding for the automated detection of complete airway tree and reduce leaks. The method uses a four-stage approach. The first step is to segment the lung field from chest CT slices using the density histogram, thresholding the original slices, and subsequently applying a morphological operation to the resultant slices. The second stage extracts the trachea and main branches by using label filtering following fist stage results. The third stage is to demarcate lower density structures (e.g., airways, air region) spread during the extracted lung region using a minimum variance thresholding algorithm. The last stage is to extract airways from the detected air regions using a morphological filtering and forward pass progression to all filtering slices in the axial, coronal, and sagittal planes are extract the complete airways.
The Proposed Method
The proposed method consists of four major stages and the whole process can be examined in the Fig. 1, the input is a chest CT slices that displays all the structures in the chest. The method starts by segmenting lung regions, and subsequently process trachea and main bronchi are extracted. Finally, binary airways are extracted from lung region.
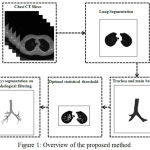 |
Figure 1: Overview of the proposed method
|
Extraction of the Lung Region
A lung region is extraction based on thresholding, smoothing, and repairing is as follows21 is first step to segment the lung region in the chest CT slices. This lung region extraction is predestined for defining the area of interest of airway regions in the process. The extracted lung region is shown in fig 2.
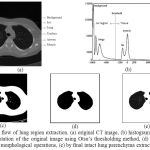 |
Figure 2: The flow of lung region extraction. (a) original CT image, (b) histogram of CT image, (c) by segmentation of the original image using Otsu’s thresholding method, (d) by mask after application of morphological operations, (e) by final intact lung parenchyma extraction.
|
Trachea and Main Bronchi Segmentation
It is easy to segment the trachea and main bronchus, because of a well defined intensity and structures. So, simple thresholding and label filtering methods are often used to extract the larger airways and saves processing time. By using the output of the binary lung segmentation the trachea is localized. The trachea and the main parts of the bronchial tree are extracted using 3D connected component labeling and mathematical morphology operations. The area of trachea and main bronchi has a minimum size of 50 mm2 and maximum size of 1225 mm2.18 We need to extract only the specified area objects which are within a region and remove rest of the objects. The segmented Trachea and Bronchi from the CT images are shown as white curves in Fig.3.
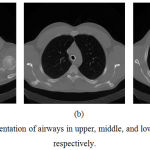 |
Figure 3: The segmentation of airways in upper, middle, and lower slices in a CT scan respectively.
|
Minimum Variance Threshold Selection
The proposed new thresholding algorithm considers sum of class variance sum and variance discrepancy into account. Traditional statistical thresholding algorithms22,23 consider only the sum of class variance, but neglect variance discrepancy for similar statistical distributions in between the airway lumen and wall. As only the sum of variance of threshold classes are taken as criterion for optimal statistical threshold search, sufficient attention on specific characteristic of lung region images is now drawn upon. In order to eliminate this limitation, a minimum variance discrepancy threshold is used, that defines a new statistical threshold criterion is combining two ways and determines the optimal threshold by optimizing the proposed criterion.
By sustaining novelty, let the segmented lung field having L gray values (0 to L-1) and then the probability of gray value is defined as
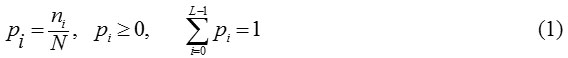
where N is the total number of pixels in the lung field, ni having grey scale intensity ’i’ as a fraction of the total number of pixels N.
The lung field is segregated into two classes Bc and Oc by using a gray value’t’. Here, Bc is the background with values’0’ to ’t’, and all the remaining pixels are the airways in Oc.
Then the probabilities of these classes as
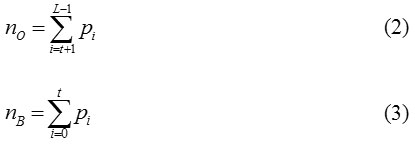
The mean of the classes are
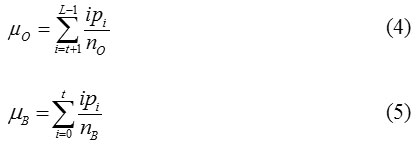
where μB is the average of the all border pixels (background) of lung field and μo is the average of everything else.
The variance of the classes is defined by
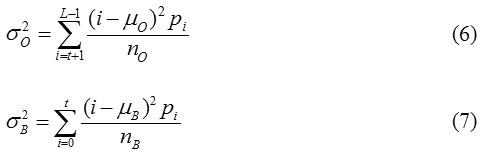
Computing the between class variance, within class variance, and the total variance of the distribution is defined as Otsu22
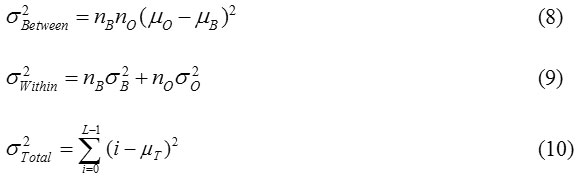
Where
from the equations 8 and 9, the following relation always holds:
![]()
Thus, the optimal threshold value ’t*’can be defined by Otsu,22
![]()
The optimal threshold maximises the class between variance of airways and lung parenchyma, but exhibits a constraint while classifying a lung field into two parts of similar sizes regardless of the practical size of the airways. After exploring the potential reason for the fault, Hou23 proposed a comprehensive new threshold criterion, i.e., total class variance, and establish the optimal threshold by minimizing it. The optimal threshold ’t*’ can be defined as
![]()
Otsu and Hou select class variance sum as standards for threshold, while change in their coefficients for two class variances.
The traditional methods consider only the sum of class variance, but neglect variance discrepancy between the airway wall and lung parenchyma of lung region. The typical example is in Fig. 4(a) where the airway wall has slight gray level changes and small class variance, whereas the background has large gray level changes and large class variance. In this case those statistical methods find incorrect thresholds and fail to extract the airways from background of lung field as exposed in Fig. 4(b & c). The reason for traditional methods considers only the sum of class variance, but ignores discrepancy of class variances. The proposed statistical thresholding method is an attempt to eliminate the limitations of Otsu and Hou methods. The new method takes the sum of class variance and variance discrepancy into account at the same time and constructs a minimum variance criterion for threshold selection, which can be formulated as:
![]()
Where
![]()
is used to measure variance discrepancy of two threshold classes. Here σo (t) and σB (t) are their respective standard deviations. The parameter is a weight that balances the contributions of the sum of variance and variance discrepancy. When α = o i.e no = nB, the proposed method degenerates as a generalized version of Otsu method. A minimum variance threshold t* can be establish by minimizing the discrepancy in the proposed criterion
![]()
Actually, equation (15) attempts to decrease the effect of sum of class variance and emphasizes the influence of variance discrepancy simultaneously. In this manner, the variance discrepancy becomes an explicit factor for determining the minimum variance threshold as shown in Fig. 5(d).
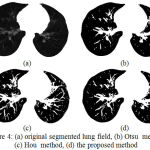 |
Figure 4: (a) original segmented lung field, (b) Otsu method, (c) Hou method, (d) the proposed method
|
Morphological Filtering
After minimum variance threshold based segmentation 2D airway candidates are detected. As we are very much interested in a wide range of airway sizes (airway cross-sectional diameters range from a few centimeters in the trachea to well below the resolution of the CT scanner) a range of morphological structuring element (SE) sizes are used during the airway extraction. Topographically, the lung parenchyma and airways can be seen in black in the segmented region. We use reconstruction through binary SEs to identify airways in the lung region, corresponding to candidate airway locations.
The thresholding procedure explained above yields a set of airway candidate regions for an image slice I. Let Ci (I)be the set of airway candidate regions obtained for slice I with SE B = Bi.The final set of airway candidate regions for image slice I, C(I) is the union of all airway regions found during this processing
where N is the total number of SEs applied, we use N = 15 and
Bi = iB4 (17)
Where B4 is a 4-connected SE, and iB4 is the ith order homothetic of B4 computed as
![]()
The largest airway will be extracted by N and the form of the Bi. The smallest detectable airway will be determined by the choice of the B1SE used to compute C1 (I). Airway candidate regions C1 (I) are calculated on each slice. A 3D binary image c is assembled by stacking these cross-sectional slices. Later on, c is processed using a closed space dilation with a unit kernel radius to reconstruct the tree. During the reconstruction process, c is used to extract only the 3D connected region of the airway tree, removing disconnected airways and other false identifies. The tree renovation consists of forward passes to pick up the connected 3D airway tree branches. These forward passes are functional sequentially until no new branches can be getting to the reconstructed tree.
The forward pass processes the segmented airways slices from apex to base. Starting with the airway cross section corresponding to the first slice of trachea, 3D region growing with six-connectivity is considered to identify connected airway regions on adjacent slices. This process iteratively constructs a set of voxels in the 3D region representing the trachea. The trachea splits into the right and left mainstem bronchi. This split is detected by the change in 2D region connectivity of the trachea has divided into smaller, child branches. Every child branch now serves as the root of a new sub tree, and the closed space dilation is recursively applied to each of the sub trees. This process continues until no new voxels can be added to the airway tree region.
A linked list structure is used to explain the airway regions and tree topology. The most apical cross section of the trachea is at the head of the linked list. Each linked list node contains a pointer to the node parent, a list of node children, region generation number, the 2D region centroid, and cross-sectional area. Branch splits are represent by a list node with two or more children nodes. If a list node has no children, it signifies a branch endpoint.
Experimental Results
The sources of data for implementation and validation of this algorithm are the images from the publicly available Lung TIME database.24 This database contains 148 CT scans. Each scan contains a varying number of image slices. On an average, 220 images per scan and every image have 512 × 512 pixels and 12 bit gray values in HU; the resolution of image exist 1.6 pixels per 1mm, image spacing 1mm, image thickness 5mm, and transversal resolution 0.58 ±0.06 mm. A total number of 10 cases are taken into consideration with total number of 3262 (average 326) slices.
The performance of proposed airway tree segmentation method is assessed by using volumetric CT images of the human chest. The assessment of the proposed method eminence is made by evaluating airway trees collected with the corresponding templates. The templates are collected from analyzed CT scans by manual marking and filling airway lumen areas in successive slices. A skilled radiologist’s help was taken to establish the airway segmentation gold standard. We first applied the automatic extraction method to recognize the airway tree. After the automatic extraction, the expert shortened the results to remove false identifications and insert missing airway regions. Only after the radiologist’s was satisfied with the edited results, the 3D connected tree rooted at the trachea was extracted by region growing and saved for use as the gold standard. This procedure was repeated for each of the validation data set.
The reliability of the segmentation is statistically measured by the sensitivity and the positive predictive value. The sensitivity describes the reliability that bronchi branches are found (intersection between segmentation and gold standard bronchi branches / gold standard). On the contrary, the positive predictive value (PPV) describes the accuracy in the existing branches as detected by the segmentation pipeline (intersection between segmentation and gold standard bronchi branches / segmentation branches). Hence, we can interpret specificity of the PPV (negative cases are sensed as negative) of leaked bronchi branches.
The proposed segmentation method extract bronchi up to the fifth generation the sensitivity is more than 85%, up to the sixth generation is 58%, and a PPV of more than 90%. Away from the sixth generation, the sensitivity is just below 30%, while the PPV maintains its high level.
The Following Measurements Are Computed and used for Comparing the Results
Branch count: The number of detected branches is correctly as the length of the centerlines is more than 1 mm.
Branch detected: The fraction of automatic detected branches by the proposed method, with respect to the ground truth branches present.
Tree length: The total length of all correctly detected branches.
Tree length detected: The fraction of airway tree length in the marked ground truth that is correctly detected.
Leakage count: The number of unrelated extraction of ‘correct’ regions that are neighboring with a ‘wrong’ region. Indicates how difficult / easy it is to physically separate leaks from the detected correctly branches.
Leakage volume: The volume of extracted regions that are detected wrongly.
False positive rate: The fraction of the volume of extracted regions that are detected wrongly over the volume of all detected regions.
Trachea is excluded from the branch length and branch count related measurements. For the leakage based measures, both trachea and main bronchi are excluded. In Table 1 we have given all the computed experimental measures. This algorithm produced a fair result; the mean number of branches detected is 46.5%, the tree length detected is 42.33% and the number of false positives is 0.28%. The time taken to process a case varied according to computer specifications and the number of slices containing airways. The mean and standard deviation of the time taken to complete each of the 10 cases is 35 ± 18 minutes using a MATLAB 2014b on Core i7 3.33 GHz PC with 16 GB memory. This time can be considerably decreased by converting the code from MATLAB to C or another compiled language. Fig. 5 shows an example of case 1 and 6 the airway trees and superimposed on the lungs parenchyma.
Table 1: Evaluation measures for the ten cases in the selected set.
| Case No. | Branch count | Branch count detected | Tree length (cm) | Tree length detected (cm) | Leakage count | Leakage volume mm3 | False positive rate (%) |
| 1 | 165 | 82.2 | 128.4 | 68.7 | 0 | 0 | 0 |
| 2 | 86 | 46.2 | 65.5 | 39 | 0 | 0 | 0 |
| 3 | 119 | 29.8 | 74.8 | 20.9 | 3 | 31.3 | 0.35 |
| 4 | 43 | 19.3 | 30.2 | 16.5 | 0 | 0 | 0 |
| 5 | 89 | 50.6 | 74.2 | 57.5 | 4 | 64.8 | 0.93 |
| 6 | 189 | 30.6 | 173.8 | 35.7 | 0 | 0 | 0 |
| 7 | 56 | 68.8 | 54.1 | 62.6 | 2 | 39.8 | 0.18 |
| 8 | 81 | 50.6 | 54.6 | 68.7 | 3 | 31.4 | 0.36 |
| 9 | 125 | 52.6 | 82.7 | 36.3 | 0 | 0 | 0 |
| 10 | 77 | 29.8 | 53.7 | 17.4 | 4 | 63.3 | 0.97 |
| Mean | 103 | 46.05 | 79.2 | 42.33 | 1.6 | 23.06 | 0.279 |
| Std. dev. | 46.47 | 19.41 | 42.03 | 20.74 | 1.78 | 26.75 | 0.38 |
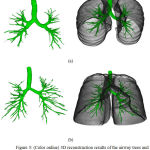 |
Figure 5: (Color online) 3D reconstruction results of the airway trees and superimposed on the lungs parenchyma.
|
The volume shown on the images represents only the volume for the segmented area (green).
Discussion and Conclusion
The proposed algorithm is a three-dimensional approach to the automated lung airways segmentation in chest CT scans and provides a good basis for CAD airway detection system. The fundamental objective of this algorithm is to propose a method for airway segmentation that will allow radiologists to move away from the console working place as well as avoid the need for expensive software applications provided by the modality vendors. The main features of the algorithm are the use of minimum variance threshold and morphological operators. The algorithm, tested on 10 cases high-resolution CT scans, provides high performance and segmentation quality, showing good accuracy in the airway segmentation, as noted in comparison against the gold standard, and also through visual inspection done by our radiologists. In 60 percent of the cases, it matched with the gold standard which is a good outcome.
Acknowledgement
The authors would like to thank Dr. Giri Babu Kande and Dr Babu Rao G for generating ground truth templates on CT chest images.
Conflict of Interest
The authors declare that they have no conflict of interest.
Ethics Statement
This article does not contain any studies with human or animal directly involved.
References
- Pleasants R. A., Ohar J. A., Croft J. B., Liu Y., Kraft M., Mannino D. M., Donohue J. F and Herrick H. L. Chronic obstructive pulmonary disease and asthma–patient characteristics and health impairment. COPD. Journal of Chronic Obstructive Pulmonary Disease. 2014;11:256-266.
- Rabe K. F., Hurd S., Anzueto A., Barnes P. J., Buist S. A., Calverley P., Fukuchi Y., Jenkins C., Rodriguez-Roisin R., Weel C. V and Zielinski J. Global strategy for the diagnosis management and prevention of chronic obstructive pulmonary disease: GOLD executive summary.American journal of respiratory and critical care medicine. 2007;176:532-555.
CrossRef - Sonka M., Park W., Hoffman E. A. Rule – based detection of intra thoracic airway trees. IEEE Trans. Med. Imaging. 1996;15:314–326.
CrossRef - Li Q., Li F., Suzuki K., Shiraishi J., Abe H., Engelmann R., Nie Y., MacMahon H and Doi K. Computer-aided diagnosis in thoracic CT,.Seminars Ultrasound, CT, MR. 2005;26:357–363.
CrossRef - Fujita H., Uchiyama Y., Nakagawa T., Fukuoka D., Hatanaka Y., Hara T., Lee G. N., Hayashi Y. Computer-aided diagnosis: The emerging of three CAD systems induced by Japanese Health Care needs. Comput. Methods Programs Biomed. 2008;92:238–248.
CrossRef - Graham M. W., Gibbs J. D., Cornish D. C., Higgins W. E. Robust 3D airway tree segmentation for image-guided peripheral bronchoscopy. IEEE Trans. Med. Imag. 2010;29:982–997.
CrossRef - Aykac D., Hoffman E. A., McLennan G., Reinhardt J. M. Segmentation and analysis of the human airway tree from three-dimensional X-ray CT images. IEEE Trans. Med. Imaging. 2003;22:940–950.
CrossRef - Fetita C. I., Preteux F., Beigelman A. C., Grenier P. Pulmonary airways 3D reconstruction from multiscale CT and clinical investigation. IEEE Trans. Med. Imag. 2004;23;1353–1364.
CrossRef - Park W., Hoffman E. A., Sonka M. Segmentation of intra thoracic airway trees: a fuzzy logic approach. IEEE Trans Med Imaging. 1998;17:489–497.
CrossRef - Lo P., Sporring J., Ashraf H., Pedersen J. J. H., deBruijne M. Vessel-guided airway tree segmentation: a voxel classification approach. Med. Image Anal. 2010;14:527–538.
CrossRef - Fan L., Chen C. W. Reconstruction of airway tree based on topology and morphological operations. SPIE Med. Imag. 2000;3978:46–57.
- Sato Y., Nakajima S., Atsumi H., Koller T., Gerig G., Yoshida S., Kikinis R. 3D multi-scale line filter for segmentation and visualization of curvilinear structures in medical images. Lecture Notes in Computer Science. 1997;1205:213–222.
CrossRef - Williams J., Wolff L. Analysis of the pulmonary vascular tree using differential geometry based vector fields. Comput. Vis. Image Understand. 1997;65:226–236.
CrossRef - Bauer C., Bischof H. A novel approach for detection of tubular objects and its application to medical image analysis. in Proc. 30th DAGM Symp. Pattern Recognit. 2008;163–172.
CrossRef - Mayer D., Bartz D., Fischer J., Ley S., Rio A. D., Thust S., Kauczor H. U., Heussel C. P. Hybrid segmentation and virtual bronchoscopy based on CT images. Acad. Radiol. 2004;11:551–565.
CrossRef - Kaftan J. N., Kiraly A. P., Naidich D. P., Novak C. L. A novel multipurpose tree and path matching algorithm with application to airway trees, in Proc. SPIE Med. Imag. 2006;6143:61430.
- Xu Z., Bagci U., Foster B., Mansoor A., Jayaram K. U., Mollura D. J. A hybrid method for airway segmentation and automated measurement of bronchial wall thickness on CT. Med. Image Anal. 2015;24:1–17.
CrossRef - Mori K., Hasegawa J., Toriwaki J., Anno H and Katada K. Recognition of bronchus in three-dimensional X-ray CT images with aplication to virtualized bronchoscopy system. Proceedings of the International Conference on Pattern Recognition. 1996;3:528–532.
CrossRef - van Ginneken B., Baggerman W., van Rikxoort E. Robust segmentation and anatomical labeling of the airway tree from thoracic CT scans. MICCAI. 2008;5241:219–226.
CrossRef - Sluimer I., Schilham A., Prokop M., van Ginneken B. Computer analysis of computed tomography scans of the pulmonary: A survey. IEEE Trans. Med. Imag. 2006;25:385–405.
CrossRef - Pulagam A. R., Kande G. B., Ede V. K. R and Inampudi R. B. Automated lung segmentation from HRCT scans with diffuse parenchymal lung diseases. Journal of Digit Imaging. 2016;29:507–519.
CrossRef - Otsu N. A threshold selection method from gray-level histograms. IEEE Transactions on Systems Man and Cybernetics. 1979;SMC-9:62-66.
CrossRef - Hou Z., Hu Q., Nowinski W. L. On minimum variance thresholding. Pattern Recognition Lett. 2006;27:1732–1743.
CrossRef - Dolejˇs´ı M., Kybic J. Automatic two-step detection of pulmonary nodules. The International Society for Optical Engineering. 2007. doi:10.1117/12.709161.
CrossRef

