
Manuscript accepted on :November 06, 2017
Published online on: --
Manoj Jha1, Akshay Kumar Kawale2 and Chandan Kumar Verma1
1Department of Department of Mathematics, Bioinformatics, Computer Applications MANIT, Bhopal, India.
2Department of Bioinformatics, MANIT, Bhopal, India.
DOI : https://dx.doi.org/10.13005/bpj/1316
Abstract
The identification of Antibiotic resistance in bacteria is a key step of improvement in the field of drug discovery and vaccinology. We present a method for this task that relies on a k-mer representation of genomes and a deep learning algorithm that produces interpretable models. The method is computationally accessible and well-suited for whole genome sequencing studies. Deep learning is an application of machine learning that uses a cascade of many layers of nonlinear processing units for extracting features and transforming it. The existing approaches for predicting antibiotic resistance genes in bacteria is not efficient enough whereas machine learning proves to be more effective than traditional methods. Our study relies on a k-mer representation method. In computational genomics, k-mer refers to all the possible subsequence (of length k) from a read obtained through DNA sequencing. The study generates the result with the help of features like coverage and depth that tells us about resistivity of the bacteria against the antibiotic. The accuracy of the model varies from 93% to 97%. The method was validated by generating models that predicted the antibiotic resistance of bacteria. The model is accurate, faithful to biological pathways targeted by the antibiotics, and they provide insight into the process of resistance acquisition. The model is computationally scalable and well suited for whole genome sequencing studies.
Keywords
Antibiotic Resistance; Bacteria;Deep Learning; Genomics Machine learning;
Download this article as:| Copy the following to cite this article: Jha M, Kawale A. K, Verma C. K. Interpretable Model for Antibiotic Resistance Prediction in Bacteria using Deep Learning. Biomed Pharmacol J 2017;10(4). |
| Copy the following to cite this URL: Jha M, Kawale A. K, Verma C. K. Interpretable Model for Antibiotic Resistance Prediction in Bacteria using Deep Learning. Biomed Pharmacol J 2017;10(4). Available from: http://biomedpharmajournal.org/?p=17714 |
Introduction
Antibiotics are extensively used globally in both human and farm animals, to treat diseases or ensure fast boom. Through the years this has created favorable situations for emergence, choice, and spread of resistant bacteria. Speedy and reliable dedication of the resistance profile of Bacteria is important for surveillance, in addition to manual medical treatment. In current years, next technology sequencing (NGS) technologies have turn out to be cheaper, faster and more correct and are today within attain for routine use in surveillance and rapid scientific diagnosis. One concern is the ability of NGS to predict phenotypic susceptibility, even though preliminary studies have proven a totally excessive concordance between expected and measured susceptibility. A number of specific strategies were evolved to discover genes in WGS data, however, there is no consensus on which approach is the most excellent to apply. These methods can roughly be divided into two companies, primarily based both on assembling raw reads to contigs before evaluating with a reference database or on mapping the reads directly to reference sequences.
Zankari et al.1 developed one of the first approaches to detect antimicrobial resistance from WGS data. This method is based on assembling the WGS and using BLAST to identify resistance genes. One risk with this approach is that identification of a gene may be missed if it is split over two or more contigs, which may happen if the data and thereby the assembly is of poor quality.
Inouye et al.21 therefore proposed an approach using Bowtie223 to map resistance genes directly to the raw WGS data, to gain sensitivity and thereby increase performance. But, this methodology of mapping against raw WGS data creates other problems, such as a gain in false positives due to redundancy or noise in the WGS data, such as contaminating agents.
Alexandre Drouin et. al. in4 discussed a reference-free technique for this task that depends on a k-mer22 representation of genomes and a machine learning formula that produces an intelligible model. the strategy is computationally scalable and well-suited for whole genome sequencing studies.
To maintain sensitivity and keep the false positive rate low, we here present a new approach based on k-mers (fragments of the DNA sequence of length k).22 k-mers are used to map the raw WGS data against reference databases, and not only identify the resistance genes but also determine the resistivity of the species. Mapping against the species reference is then used to normalize the antimicrobial resistance prediction. This new approach, as well as Kover4 was compared with standard resistivity tests, performed on various bacteria.
Methods and Materials
Genome Assembly
In the present study, the genomic sequences data for a gene or all the micro-organism can be downloaded from NCBI14 in FASTA or FASTQ format. The genome assembly can be searched in NCBI database either by gene name or by the nucleotide accession number. The genome, if downloaded in FASTQ, is then assembled into genome assembly sequences. The FASTQ is downloaded as NCBI Sequence Read Achieve. The FASTQ can also be converted into genome assembly sequences using BIOJAVA libraries.17 Another approach to convert FASTQ to genome assembly sequence is using GZIP classes of JAVA. Another approach of genome assembly is using SPAdes (St. Petersburg genome assembler), which is python software used to assemble the single cell and multi-cell bacteria dataset.20 It has an ability to use k-mers with varying values of k.
Creating Antibiotic DB
From various external sources and experimental results such as ResFinder, CARD etc., next, we are creating antibiotics genes database. These databases are BLASTDB, hence it required NCBI BLAST+ software.14 The BLAST+ can be downloaded from.15 The latest version of BLAST+ is 2.6.0 and the same is used in the proposed work. The BLAST+ is CLI based software i.e. command line interface. Another way to create nucleotide/antibiotic DB is using BIOEDIT software.6 It is GUI based software, integrated with BLAST and all its packages. To create a nucleotide database in BIOEDIT, click on Accessory Application → BLAST → Create a local nucleotide database file → Browse the resistance file in FASTA format. makeblasdb command will execute and the local antibiotic database file is created.
Fragment Into K-mers and Dataset
Next step after downloading genome is creating the dataset by fragmenting the genome into k-mers. In general, k-mers is the substring of length k contained in a string. Similarly, in genomic, k-mers refer to the subsequence of length k of DNA sequences.22 In the field of bioinformatics, the k-mers has many applications for e.g. sequence assembly, detecting bacterial contamination, etc. The possible amount of k-mer of a given sequence is − + 1, where L is the length of the sequence. The possible number of k-mer for n possibilities is nk. In case of DNA sequences, the possibilities are 4 i.e. A, T, G, C hence the possible number of k-mer for DNA sequences is 4.
K-mer Mapping
Now to create the dataset we examine the occurrence of k-mers between the input genome and the database of resistance genes. The occurrence can be measured by matching the k-mers gene in the resistance database. But any mismatch in the occurrence will affect both coverage and depth of the gene. To avoid gaining multiple hits due to identical k-mers between genes in the database, each k-mer is first only assigned to the gene with the highest number of unique k-mer matches. After this, the k-mers mapping to the best hit is removed and the process is repeated with the remaining reads. It is stated that if the occurrence of the k-mer match, then it is resisted. The coverage is the fraction of the genome covered by at least one k-mer, and the depth is the average number of times the k-mers in the hit are seen in the input genome. Having this features of the genome, the exponential survival function is used to measure the quality of identified genes.4
![]()
Here is the exponential survival function, with𝜇 being the expected value of either depth or coverage, while is the corresponding measured value. ( < ) expresses the probability of the current hit being better than expected. T, based on depth and coverage have been named ‘depth’ and ‘coverage’. A depth of 0.09 and coverage of 0.5 was found to be the optimal threshold.
Build Neural Net using Deep Learning
After creating the dataset, the next step is to build a neural network model based on deep learning. As we building the model in JAVA, there is a library called deeplearning 4 j which is open source library.8,17 The various platform has particular libraries, for example, python has theano or tensorFlow. Deep Learning can also be implemented using GPU, so there are backend and CUDA API for Deep Learning. Deep Learning committee also created some libraries which we used in the proposed work. The Deep Learning can also be implemented using a freeware software known as RapidMiner.13 We implemented our work both CLI and GUI based i.e using deeplearning4j and RapidMiner. RapidMiner is a learning science bundle platform created by the corporate of indistinguishable name that has to relate degree coordinated surroundings for data preparation, machine adapting, profound learning, content mining, and prophetic analytics.14 The RapidMiner Studio Free Edition, that is limited to 1 sensible processor and 10,000 data columns, is offered beneath the AGPL license.13
To build model in RapidMiner, we have passed our dataset in three phase
Training
Cross-Validation
Testing
In cross-validation, we have set the parameters of the deep neural network that are giving best accuracy. Then these deep neural networks are used for further testing of the completely new dataset to find the accuracy. The results are further used for visualizing and result in analysis.
Results and Discussion
The results of the model in RapidMiner for Clostridioides difficile is mentioned in the table below. It consists of the confusion matrix between susceptibility and resistivity. The table shows the matrix build on the confidence of susceptibility and resistivity of Clostridioides difficile to antibiotics. It shows that the actual S and predict S are equal, whereas the actual R and predict R are not, which shows that the previous approaches failed to predict resistivity.
Based on the Coverage and Depth obtained from the BLAST, the dataset is created and this dataset is passed through the model in RapidMiner. This calculates the confidence for susceptibility and resistivity based on the model build using deep learning.
Table 1: Prediction result of Proposed Model Using RapidMiner
| true S | true R | class precision | |
| pred. S | 11 | 1 | 91.67% |
| pred. R | 0 | 3 | 100.00% |
| class recall | 100.00% | 75.00% | accuracy: 93.33% |
Figure 1 shows the graphical representation resistance result for the bacteria Clostridioides difficile. The graph is plotted between Antibiotics and Prediction(Resistance). The Prediction(Resistance) has two values as S and R i.e. susceptible and resistance respectively. The S represents in blue color, whereas the R represents in red color. In the graph, the X-axis is for Antibiotics and Y-axis for Prediction(Resistance).
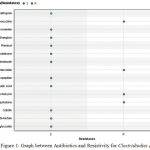 |
Figure 1: Graph between Antibiotics and Resistivity for Clostridiodies Difficle
|
Table 2 shows the predicted resistivity results in tabular form for Clostridioides difficile. It consists of 7 column named, Resistance, Prediction(Resistance), Confidence(S), Confidence(R), Antibiotics, Coverage and Depth. Prediction(Resistance) column show the predicted result of the proposed model based on Confidence(S) and Confidence(R). The Confidence is calculate using activation function and coverage and depth values for individual antibiotics.
Table 2: Prediction result of Clostridioides difficile.
| Resistance | Prediction (Resistance) |
Confidence(S) | Confidence(R) | Antibiotics | Coverage | Depth |
| S | S | 0.993 | 0.007 | Aminoglycoside | 0 | 0 |
| S | S | 0.989 | 0.011 | Beta-lactam | 0 | 0 |
| S | S | 0.974 | 0.026 | Colistin | 0 | 0 |
| R | R | 0.481 | 0.519 | Fluoroquinolone | 97.230 | 2.630 |
| R | S | 0.782 | 0.218 | Fosfomycin | 92.600 | 1.720 |
| S | S | 0.999 | 0.001 | Fusidic Acid | 0 | 0 |
| S | S | 0.998 | 0.002 | Glycopeptide | 0 | 0 |
| R | R | 0.307 | 0.693 | Macrolide | 100 | 3.320 |
| S | S | 0.999 | 0.001 | Nitroimidazole | 0 | 0 |
| S | S | 0.990 | 0.010 | Oxazolidinone | 0 | 0 |
| S | S | 0.992 | 0.008 | Phenicol | 0 | 0 |
| S | S | 0.757 | 0.243 | Rifampicin | 0 | 0 |
| S | S | 0.743 | 0.257 | Sulphonamide | 0 | 0 |
| R | R | 0.059 | 0.941 | Tetracycline | 95.680 | 2.423 |
| S | S | 0.990 | 0.010 | Trimethoprim | 0 | 0 |
As it describes in the table that it shows the resistivity prediction result for the Clostridiodies Difficle based on coverage and depth using the model build in Deep Learning. Figure 10 shows the accuracy and confusion matrix of the model and figure 11 shows the prediction graph result for Clostridiodies Difficile between Antibiotics and prediction resistance.The observations from the table and figures are:
The accuracy of the model for Clostridiodies Difficile to be 93.33 %. Comparing with the model present in the Kover,3 the accuracy for Clostridiodies Difficile is 92.79 %. Kover3 is based on Set Covering Machine technique which is part of Machine Learning. The Set Covering Machine does not require features to predict and in Kover, there are possibilities of multiple occurrences of the k-mers.
The Confusion matrix shows that the predicted susceptibility is equal to true susceptibility, but the predicted resistance is not equal to the true resistance because on the basis of coverage and depth and hence, the evolved Clostridiodies Difficile will not resistance to fosfomycin.
The Graph is plotted between the antibiotics and the prediction result on the basis of confidence from the table and hence the graph shows that the Clostridiodies Difficile is resistance to Tetracycline, Macrolide, Fluoroquinolone.
The table shows the confidence for both S and R. The confidence is calculated on the basis of activation function and coverage and depth comes after BLAST. The prediction result is based on confidence as the table show that large value of confidence is the prediction result. The confidence of S is more than the confidence of R in case of fosfomycin. Hence it shows that the Clostridiodies Diffcle will no resist to fosfomycin.
Conclusion
The proposed interpretable predictive model is basically relying on a small set of genomic variations. The model predicts the resistivity of antibiotics for C. difficile, M. tuberculosis, P. aeruginosa, S. pneumoniae and other bacteria for 16 antibiotics. The proposed model is accurate, faithful to the biological pathways targeted by the antibiotics, and it provides vision into the process of resistance acquire than existing approach such as Kover. The Kover only uses k-mer to be matched with the resistance DB and based on this it predicts the resistivity. The proposed model is based on BLAST score as well as Deep Learning, hence it is more accurate over other methods like Kover.
The method is now limited to predict antibiotic resistance in bacteria and in further, applicable to a variety of organisms such as viruses. Kover, which is based on the same approach but using set covering algorithm, is helping to predict the resistance in above bacteria but only based on the presence and absence of k-mers in the genome, while the proposed work is based on presence and absence of k-mers and BLAST score of the genome with resistance DB. The feature helps the proposed model over Kover and other methods like ResFinder, CARD, ARG-ANNOT etc.
Future Scope
The proposed method is currently limited to the predict bacteria using k-mers. This method also helps in future to predict antibiotics in virus and other microorganisms and allows the use of highly efficient atomic GPU instructions in the implementation using deep learning native libraries. Thus, the proposed method implements linearly with the number of k-mers and genomes, something that would not be possible if k-mer frequencies occurred. In future work, we will explore ways to unite k-mer frequencies, while keeping the scalability of our method. This new type of model will allow the predict at multiple genomic loci. The present model also helps in prescribing antimicrobial agent and prediction of antimicrobial drug and vaccinology.
Reference
- Zankari E et al, Identification of acquired antimicrobial resistance genes. Journal of Antimicrobial Chemotherapy. 2012;67:2640-2644.
- Jia B, Amogelang R.R, Alcock B, Waglechner N, Guo P , Kara K.T, Briony A.L, Biren M.D, Pereira S, Arjun N.S. CARD 2017: expansion and model-centric curation of the comprehensive antibiotic resistance database. Nucleic Acids Res. 2017;45(1):566-573, 2017.
- Drouin S, Giguère M, Déraspe M, Marchand M, Tyers V.G.L, et al. Predictive computational phenotyping and biomarker discovery using reference-free genome comparisons. BMC Genomics. 2016;17:754.
- Gupta S.K et al. ARG-ANNOT a new bioinformatic tool to discover antibiotic resistance genes in bacterial genomes. Antimicrob. Agents Chemother. 2014;58(1):212-220.
- Feuerriegel S et al, PhyResSE a Web Tool Delineating Mycobacterium tuberculosis Antibiotic Resistance and Lineage from Whole-Genome Sequencing Data. Journal of Clinical Microbiology. 2015;56(6):1908-1914.
- Bradley N.C, Gordon T. M, Walker L, Dunn S, Heys B.H et al, Rapid antibiotic-resistance predictions from genome sequence data for Staphylococcus aureus and Mycobacterium tuberculosis. Nat Commun. 2015;6.// 2015.
- Walker M. et al, Whole-genome sequencing for prediction of Mycobacterium tuberculosis drug susceptibility and resistance: a retrospective cohort study. The Lancet Infectious Diseases. 2015;15(10): 1193-1202.
- “Deep Learning” [Online]. Available: http://deeplearning.net/
- Goodfellow I , Bengio Y and Courville A. Deep Learning. MIT Press. 2016.
- Deng L, Yu D. Deep Learning: Methods and Applications (PDF). Foundations and Trends in Signal Processing. 2014;7(3–4):1–19.
CrossRef - Yoshua B. Learning Deep Architectures for AI (PDF). Foundations and Trends in Machine Learning. 2009;2(1):1–127.
CrossRef - Schmidhuber J. Deep Learning in Neural Networks: An Overview. Neural Networks. 2015;61:85–117.
- Miner R. [Online]. Available: http://www.rapidminer.com.
- “NCBI” [Online]. Available: https://www.ncbi.nlm.nih.gov/.
- “NCBI BLAST” [Online]. Available: ftp://ftp.ncbi.nlm.nih.gov/blast/executables/blast+/LATEST/..
- Beta-Lactamase. [Online]. Available: https://www.ncbi.nlm.nih.gov/pathogens/beta-lactamase-data-resources/.
- “Deeplearning for JAVA” [Online]. Available: http://www.deeplearning4j.org/.
- “JAVA” [Online]. Available: https://www.oracle.com/java/download.
- “BIOJAVA” [Online]. Available: http://biojava.org/.
- Bankevich et al, SPAdes A New Genome Assembly Algorithm and Its Applications to Single-Cell Sequencing. Journal of Computational Biology. 2012;19(5):455-477.
- Michael I et al. SRST 2 Rapid Genomic Surveillance for Public Health and Hospital Microbiology Labs. Genome Medicine. PMC. 2014;11:90.
- Melsted and Pritchard J.K. Efficient counting of k-mers in DNA sequences using a bloom filter. BMC Bioinformatics. 2011 August 10;12:333.
- Ben L and Steven L.S. Fast Gapped-Read Alignment with Bowtie 2. Nature methods. PMC. Web. 2012;4:357–359.

