
Manuscript accepted on :December 18, 2017
Published online on: 21-12-2017
Plagiarism Check: Yes
Divya Kotagiri and Viswanatha Chaitanya Kolluru
Department of Biotechnology, GITAM Institute of Technology, GITAM University, Visakhapatnam, 530045, Andhra Pradesh, India.
Corresponding author Email: viswanatha.chaitanya@gmail.com
DOI : https://dx.doi.org/10.13005/bpj/1275
Abstract
The present study aimed at determining the morphological and physiological response of five different Coleus species under salinity stress. Salinity is one of the major abiotic stress factor shows negative effect on different agricultural activities. Thus, demands the need of developing salt tolerant plant varieties. Coleus is one of the important medicinal plants with several therapeutic properties, but the information related to physiological and morphological response which helps in determining the level of salt tolerance in Coleus species has not been reported yet. Study carried out to investigate the effect of different salinity concentrations (100, 200 & 300 mM NaCl) on carbohydrate content, plant growth, leaf area and biomass. Salinity stress significantly reduced the plant growth, leaf water potential (LWP) and relative water content (RWC) in all five Coleus species whereas, the content of carbohydrates, water uptake capacity (WUC) and electrolyte leakage (EL) was increased. Among the five different Coleus species considered for the present study, Coleus aromaticus and Coleus amboinicus have shown better tolerance to the salinity stress with respect to their morphology, carbohydrate content, decreased water potentials, increased electrolyte leakage and water uptake capacity. The increased accumulation of carbohydrates with increased salinity suggests that they act either as respiratory substrates or as osmolytes confer salinity stress tolerance.
Keywords
Coleus; biomass; carbohydrates; electrical conductivity Salinity stress;
Download this article as:| Copy the following to cite this article: Kotagiri D, Kolluru V. C. Effect of Salinity Stress on the Morphology and Physiology of Five Different Coleus Species. Biomed Pharmacol J 2017;10(4). |
| Copy the following to cite this URL: Kotagiri D, Kolluru V. C. Effect of Salinity Stress on the Morphology and Physiology of Five Different Coleus Species. Biomed Pharmacol J 2017;10(4). Available from: http://biomedpharmajournal.org/?p=18251 |
Introduction
Salinity stress is one of the most deleterious abiotic stress factors that affect the growth, productivity and physiology of plants. Salinity imposes negative effect on the plant growth by decreasing leaf water potential, inducing morphological and physiological changes, production of reactive oxygen species (ROS), increased osmotic stress, ion toxicity and by altering the biochemical processes.1 Factors responsible for salinization are climate, human activities, composition of salt and topography of lands.2 One of the most common sources of salinity is sodium chloride.3 Salinity increases the concentration of Na+ and Cl– ions and decreases the concentration of N+, PO4-3, K+, Mg+2 and Ca+2 ions in leaves.4 The growth of plants is affected by reduction in the uptake of water, lack of nutrients and accumulation of toxic sodium and chloride ions.5 Sodium is responsible for the dispersion of secondary clay minerals in the soil. Chloride is utilized by plants as a micronutrient and as mineral nutrient by many halophytes, but over accumulation of these salts results in low biodiversity and reduced growth and reproduction of salt sensitive plants.6 The presence of sodium and chloride ions at higher concentrations within the plant cell can also impair the function of enzymes present in the cytosol. The effects of salinity stress are more prominent in arid and semi-arid regions where 25% of the agricultural lands are affected. The two main phases of salinity stress-induced responses of plants are shoot ion independent and ion dependent responses. The first phase occurs within minutes or few days caused by sodium ions leads to closure of stomata and the expansion of leaf is inhibited. During this phase plant water relation is affected by salinity. In second phase, the accumulation of toxic ions takes place particularly in older leaves causing premature senescence, reduced yield and death of plant. Plants have adapted various mechanisms to tolerate the adverse effects of salt stress.7 Tissue tolerance, shoot ion independent tolerance and ion exclusion are some of the tolerance mechanisms shown by plants to overcome salinity stress. Osmotic adjustment is considered to be one of the most important physiological mechanisms of salinity stress tolerance in plants. The uptake of water, cell turgor and other physiological processes such as cell expansion, photosynthesis and stomatal opening is well controlled with the osmotic adjustment in both the leaves and roots of plants resistant to salts.8 Although the relationship between salt resistance and osmoregulation is not clear, there is evidence that few plant genotypes exhibit salt tolerance with increasing osmotic adjustment.9 Plants resistant to salinity stress will grow well by inducing the production of secondary metabolites and avoiding the toxic effects caused by the ion.10 The other physiological parameters involved in tolerating salinity are transpiration use efficiency, transpiration, production of antioxidants, seed germination, harvest index, early seedling growth, leaf area and maintenance of water status.11
The objective of the present study is to analyse the morphological and physiological status of five different Coleus species subjected to salinity stress for the identification of the resistant ones. Selection of salt tolerant species is one of the important strategies to overcome the problem of salinity as well as for increasing the production of plants with medicinal value of which genus Coleus is a valuable tool. In order to increase the cultivation of Coleus species, it is necessary to understand the effects of salinity on its morphology and physiology. Study carried out to determine the effect of salinity on morphological parameters like plant height, biomass and leaf area of Coleus. Relative water content (RWC), leaf water potential (LWP), water uptake capacity (WUC) and relative electrolyte conductivity (REC) are physiological parameters carried out in the present study to understand the plant water relations. The method of relative water content (RWC) in leaves is used to determine the status of plant water reflecting the tissue metabolic activity.12 The reduced availability of water for the process of cell extension is the result of cell turgor loss indicated with the reduced relative water content.13 When the plants are under stress, the availability, translocation and absorption of water from soil to roots and leaves is decreased resulting in decreased relative water content and leaf water potential. The electrical conductivity of soil is used to determine whether the soil is partially or strongly saline. Soil is considered to be saline when the electrical conductivity of the soil saturation extract (EC) is 4 dS/m or more and when it exceeds 15 dS/m, soil is considered to be strongly saline.14
Material and Methods
Collection of plant material and salinity stress treatment
Five Coleus species, aromaticus (Herbarium No. 21901), amboinicus (Herbarium No. 21903), forskohlii (Herbarium No. 21905), zeylanicus (Herbarium No. 21904) and barbatus (Herbarium No. 21906) were propagated in the GITAM University botanical garden in 12 inch pots under 720 minutes natural photoperiod [Irradiance (400-700 nm) of 1600-1800 µ mols m-2 s-1] with day/night temperatures of 30°C/23°C with an approximate air humidity of 60%. The pots were arranged in rows 1m apart and the plants were irrigated daily. Three months old plants with uniform growth were selected for this study. Coleus plants of all varieties were then separated into four groups namely control (c), mild (100 mM), moderate (200 mM) and severe (300 mM). Control plants were watered daily and salt-stressed plants were treated with 250 ml of 100, 200 and 300 mM NaCl solutions twice a day for a period of 1 week. Third or fourth leaf from the top of the plant was collected for all the experiments.
Physiological and Morphological studies
Leaf water potential (LWP)
The leaf water potentials were measured for control, mild, moderate and severe salt stressed plants of all five Coleus species using plant moisture system SKPM purchased from Skye instruments, UK.
Relative water content (RWC)
Relative water content is measured by collecting ten leaf discs from all the species of Coleus and immersed into 20 ml of distilled water, left overnight in a refrigerator. The turgid weight (TW) of leaf discs after drying is taken followed by wrapping leaf pieces in aluminum foil placed in an oven at a temperature of 65°c overnight. The dry weight (DW) of the leaf discs is measured and calculated using the following formula.15

Water uptake capacity (WUC)
Water uptake capacity was calculated using the following formula according to Sangakkara et al.16
Water uptake capacity (WUC) = TW – FW/DW
Relative electrolyte conductivity (REC)
Electrolyte conductivity is measured using three leaf discs of 10 mm size, washed thoroughly and placed in a test tube containing 10 ml of distilled water for 30 min. Electrical conductivity of solution (L1) is measured and the tubes were autoclaved. The electrical conductivity was measured again after the solution had cooled to a temperature of 20°c (L2). REC was calculated according to the following formula.17

Electrical conductivity of soil
Soil-water suspension was prepared at a ratio of 1:5, mixed vigorously for 1 hour to dissolve soluble salts. The electrical conductivity of soil is measured by inserting the conductivity meter probe into the solution without disturbing the settled soil using 0.01M KCl as a reference solution.
Estimation of leaf area, plant height and biomass
Coleus leaf area is measured by graph paper method according to Pandey and Singh.18 Plant height is measured in centimeters and the biomass measured in grams per fresh weight using weighing balance.
Estimation of carbohydrates
The content of carbohydrates; glucose and fructose were determined according to Ashwell et al.19 and Dubois et al.20 The extracts were prepared by homogenizing the 0.5 grams of Coleus leaf tissue in 80% ethanol followed by centrifugation for 10 min at 5000 rpm. 5 ml of anthrone reagent is added to 1 ml of supernatant, incubated for 30 min using water bath and the absorbance was measured at 620 nm for the estimation of glucose. The carbohydrate fructose was estimated by adding 1 ml of resorcinol reagent to 2 ml of extract and by measuring the absorbance at 520 nm after 10 min of incubation. The contents of sucrose and starch were estimated according to Ramachandra Reddy et al.21
Statistical analysis
Data were analyzed using ANOVA statistical program. Mean + SD values calculated for five samples in each group and the significance of the data was tested using student’s t test (P < 0.05).
Results and Discussion
In the present study, the leaf area, plant height, biomass, carbohydrate assay and the physiological parameters such as leaf water potential, relative water content, water uptake capacity, electrolyte conductivity of soil and relative electrolyte conductivity were studied in five different species of coleus during salinity stress. Relative water content and leaf water potentials were decreased in all the Coleus species subjected to salinity stress (Figure 1 & 2), whereas water uptake capacity and electrolyte leakage levels increased with increasing NaCl concentrations (Figure 3 & 4). The leaf water potentials decreased from -0.02 to -1.2 MPa in Coleus aromaticus, -0.06 to -1.6 MPa in Coleus amboinicus, -0.05 to -2.14 MPa in Coleus forskohlii, -0.04 to -1.82 MPa in Coleus barbatus and -0.02 to -1.42 MPa in Coleus zeylanicus. The relative water content of five different Coleus species were decreased from 103% to 77.6% in Coleus aromaticus, 121% to 65.5% in Coleus amboinicus, 75% to 48% in Coleus forskohlii, 104% to 59% in Coleus barbatus and 95% to 31% in C.zeylanicus. However, the relative water content was high in Coleus aromaticus and Coleus amboinicus during both control and salinity stress conditions. The results of decreased leaf relative water content with the increased levels of stress were reported.22 Similar results were reported in Rosmarinus officinalis when grown under salinity stress.23 The decrease in relative water content could be due to non-availability of water near root zone and loss of water by transpiration. Electrical conductivity is used to measure the amount of dissolved material or salts from an aqueous solution. The higher electrical conductivity (EC) is due to the presence of higher dissolved salts in soil sample. The increase in the soil electrical conductivity with increased salt treatment compared to control soil was observed in the study (Figure 5). The EC values recorded above 4 dS/m in mild, moderate and severe salt treated soil samples indicate that the water is not suitable for agriculture purposes and the soil is not suitable to support the growth of plants.
The decreased plant growth indicated by the reduced leaf area, plant height and biomass in five Coleus species subjected to salinity stress was observed and the results were depicted in Table 1. During salinity stress, plant growth is reduced due to several physiological responses such as changes in the water level, photosynthetic efficiency, carbon utilization and allocation. The decreased plant growth with reduced dry weight was reported in Andrographis paniculata Nees. seedlings subjected to salinity stress.24
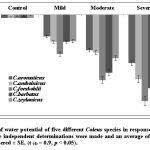 |
Figure 1: Leaf water potential of five different Coleus species in response to salinity stress. Five independent determinations were made and an average of each point was considered ± SE, (t (4) = 0.9, p < 0.05)
|
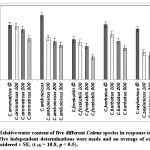 |
Figure 2: Relative water content of five different Coleus species in response to salinity stress. Five independent determinations were made and an average of each point was considered ± SE, (t (4) = 10.8, p < 0.5)
|
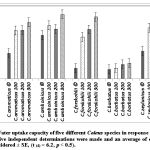 |
Figure 3: Water uptake capacity of five different Coleus species in response to salinity stress. Five independent determinations were made and an average of each point was considered ± SE, (t (4) = 6.2, p < 0.5)
|
Salt tolerant plants exhibit the mechanism of ion compartment in vacuoles, salt resistance at genetic level and by the accumulation of compatible solutes in the cytoplasm.25 The increased accumulation of carbohydrates glucose, sucrose, fructose and decrease in the content of starch with increased salinity was observed in all the five species of Coleus indicating the plant tolerance to stress (Table 2). To carry out the process of glycolysis and the mechanism of crassulacean acid metabolism (CAM) which involves the transport of intermediate compounds across the membrane and the involvement of starch degrading enzymes degrades the existing starch and utilize it as a source of malate. The changes in the content of starch for regeneration of phosphoenol pyruvate were reported in several CAM plants.26 The increased content of soluble sugars with increased salinity was observed in the leaves of Echium amoenum,27 tomato28 and in barley.29 The reduction in the biomass of two safflower cultivars namely Carthamus tinctorius L. TSF1 and SM; with increased accumulation of soluble sugars and amino acids to overcome stress was reported.30 The reduced growth and dry weight in response to salinity was reported in several plant species like Zea mays, Hordeum vulgare, Gossypium hirsutum and Plantago ovate.31,32,33,34 The decreased plant growth, height and leaf area during salinity stress is due to the accumulation of toxic ions and less availability of water. In order to avoid the harsh effects of salinity stress, the leaf area will be decreased and the mechanism of osmotic adjustment is brought about by the accumulation of carbohydrates in tissues. The sugars or carbohydrates act either as respiratory substrates or as osmolytes confer salinity stress tolerance. The higher accumulation of carbohydrates during salinity stress also favors the accumulation of an important osmolyte proline. Similar study carried out on other medicinally important CAM plant Aloe vera showed reduced growth and yield in terms of decreased leaf number, leaf thickness and plant height; enhanced carbohydrate and proline content under severe conditions of salinity stress.35 Plants with medicinal value have been used for centuries as herbal medicine to treat diseases36 and to overcome the usage of synthetic drugs due to their side effects and toxicity. At present only few medicinal plants were cultivated for commercial purposes. Coleus is one of the medicinal plants with many therapeutic properties. Hence, there is a need to cultivate this medicinal plant as it is capable of growing under stress conditions. Salinity is one of the major abiotic stress factors affecting medicinal plants.37 It is evident that salinity interferes with gas exchange during moderate and severe salt stress levels thereby decreases the rate of photosynthesis.38 The immediate effect of salinity is decrease in stomatal conductance followed by reduced respiration rate and CO2 assimilation. Earlier, many researchers have reported the translocation of assimilates and the reduced rate of photosynthesis during salinity stress depends mainly upon the species and concentration of salt.39 By studying the role of plants when subjected to stress, it is possible to know about their metabolic pathways and the function of enzymes involved. The mechanism of sensitivity and tolerance to stress in plants is not fully known due to complexity of mechanisms involved.40 Plant water status is affected during salinity stress due to toxic ions which limits the availability of water; major reason for growth reduction in plants as water is being utilized by plants as a solvent and transport medium for their biological activities. The level of tolerance under stress can be evaluated by measuring relative leaf water content which is an integrative index of plant water status. The sensitivity of plants to dehydration is also indicated by relative leaf water content.41 Accumulation of salts at root zone decreases leaf water potential preventing the absorption of nutrients and water by plants. The water status of plant gets decreased due to the conditions of physiological drought experienced by plants when subjected to salinity stress.7,42 The growth of plants is affected initially due to decrease in the soil water potential which ultimately leads to the death of plant due to rapid increase in the concentration of salts in the cytoplasm.43 It was reported that the over accumulation of salts leads to the death of older leaves and the supply of carbohydrates and growth hormones to the other regions of plant is decreased thereby preventing the growth of plant.44 The enzyme phosphoenolpyruvate carboxylase gets induced by salinity stress and the advantage with the CAM plants is increased water uptake efficiency as the stomata closes during day time and opens at night minimizing the water loss.
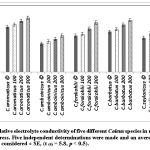 |
Figure 4: Relative electrolyte conductivity of five different Coleus species in response to salinity stress. Five independent determinations were made and an average of each point was considered ± SE, (t (4) = 5.8, p < 0.5)
|
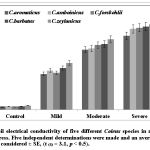 |
Figure 5: Soil electrical conductivity of five different Coleus species in response to salinity stress. Five independent determinations were made and an average of each point was considered ± SE, (t (4) = 3.1, p < 0.5)
|
Plants acquire resistance to stress through water influx, accumulation of compatible solutes and maintenance of nutrients by potential gradient.45 The cell membrane acts as a semi-permeable barrier for the transport of solutes but the presence of excess salts leads to the damage of membrane and leakage of ions from cell.46 The more leakage of electrolytes results in higher conductivity. In our present study a significant decline in the leaf water potential and relative water content was observed in all the five species of coleus subjected to salinity stress compared with the non-stressed plants. Electrolytic leakage also called as relative electrolyte conductivity is higher in coleus species at severe conditions of salinity stress compared with controls. The relative electrolyte conductivity increased from 40.42% to 48.63% in C.aromaticus, 25.6% to 32.68% in C.amboinicus, 32.7% to 44.45% in C.forskohlii, 36.25% to 46.52% in C.barbatus and 30.7% to 40.37% in C.zeylanicus. The decreased leaf water potential and increased electrolyte leakage with increased salinity was reported in two cultivars of Brassica juncea Czern and Coss varieties (Varuna and RH-30). The electrolyte leakage increased by 26.7% and 32.3% in Varuna and RH-30 compared to controls with an increase in the concentration of NaCl.47 A significant decrease in the relative water content and increase in the electrolyte leakage was also observed in the medicinal plant Henna (Lawsonia inermis) with the increased levels of salinity from 0 to -6 bar.48 Water uptake capacity is determined by the ability of plant to utilize water is measured in terms of units per dry weight in relation to turgid weight. The increase in the water uptake capacity was observed in C.aromaticus from 4.25% to 9.3%, 7.2% to 10.6% in C.amboinicus, 1.8% to 10.19% in C.forskohlii, 1.6% to 2.6% in C.barbatus and 4.6% to 10.4% in C.zeylanicus species during salinity stress. The increase in the water uptake capacity (WUC) was reported in wheat cultivars under salinity stress.49
Table 1: Changes in the leaf area, plant height and biomass of five different Coleus species in response to salinity stress. Each value is the mean ± SE of five independent determinations, (t (4) = 3.81, P < 0.05).
| Plant species | Leaf area (Cm2) | Plant height (cm) | Biomass (g) |
| C.aromaticus | |||
| Control | 68.12±2.2 | 48.8±1.7 | 698±1.32 |
| Mild (100) | 66.11±1.1 | 42±2.2 | 642±2.2 |
| Moderate (200) | 54.62±1.5 | 36.17±1.2 | 556±2.1 |
| Severe (300) | 48.12±2.1 | 32.24±2.1 | 520±1.7 |
| C.amboinicus | |||
| Control | 38.27±1.9 | 42.44±2.5 | 712±2.3 |
| Mild (100) | 32.28±1.7 | 40.11±2.2 | 668±1.7 |
| Moderate (200) | 24.48±1.2 | 32.98±2.1 | 618±1.9 |
| Severe (300) | 20.81±2.1 | 31.78±1.9 | 586±1.3 |
| C.forskohlii | |||
| Control | 72±1.98 | 34±2.11 | 622±1.3 |
| Mild (100) | 68±1.24 | 32±1.26 | 584±1.5 |
| Moderate (200) | 42±1.9 | 24±1.46 | 548±1.7 |
| Severe (300) | 38±1.7 | 22±1.54 | 518±2.1 |
| C.barbatus | |||
| Control | 38.91±2.4 | 49.12±1.1 | 612±1.9 |
| Mild (100) | 32.68±2.3 | 34.98±1.5 | 596±2.2 |
| Moderate (200) | 22.89±1.7 | 32.62±1.8 | 582±1.7 |
| Severe (300) | 21.22±1.9 | 29.88±1.1 | 529±2.1 |
| C.zeylanicus | |||
| Control | 44.12±1.5 | 44.65±1.7 | 582±2.2 |
| Mild (100) | 41.67±2.1 | 34.59±1.2 | 572±2.4 |
| Moderate (200) | 40.22±1.82 | 31.97±1.57 | 558±1.6 |
| Severe (300) | 39.99±1.2 | 36.66±1.9 | 542±2.1 |
Table 2: Estimation of carbohydrate content in five different Coleus species subjected to salinity stress. Each value is the mean ± SE of five independent determinations, (t (4) = 2.8, P < 0.05).
| Plant species | Glucose | Fructose | Sucrose | Starch |
| C.aromaticus | ||||
| Control | 78±2.2 | 72±2.1 | 92±2.6 | 58±1.5 |
| Mild (100) | 86±3.2 | 78±1.4 | 82±1.48 | 52±1.2 |
| Moderate (200) | 102±1.8 | 88±2.4 | 98±2.6 | 42±2.2 |
| Severe (300) | 112±1.4 | 96±2.2 | 120±1.8 | 38±2.8 |
| C.amboinicus | ||||
| Control | 72±2.1 | 62±2.4 | 96±1.4 | 66±1.1 |
| Mild (100) | 78±2.2 | 72±1.6 | 84±1.8 | 54±2.1 |
| Moderate (200) | 98±3.1 | 92±3.2 | 102±2.6 | 46±1.5 |
| Severe (300) | 122±2.4 | 108±1.8 | 132±2.8 | 42±1.7 |
| C.forskohlii | ||||
| Control | 64±2.4 | 52±1.3 | 88±1.9 | 38±1.5 |
| Mild (100) | 78±2.0 | 68±1.3 | 82±1.7 | 32±1.8 |
| Moderate (200) | 86±3.2 | 82±2.2 | 92±2.2 | 29±1.4 |
| Severe (300) | 101±1.6 | 98±2.4 | 122±2.4 | 22±2.6 |
| C.barbatus | ||||
| Control | 68±2.6 | 54±1.9 | 88±1.3 | 32±1.8 |
| Mild (100) | 84±2.2 | 76±2.1 | 78±1.6 | 28±2.2 |
| Moderate (200) | 92±1.8 | 88±1.7 | 89±1.9 | 22±2.3 |
| Severe (300) | 108±2.6 | 102±1.4 | 118±2.2 | 12±1.7 |
| C.zeylanicus | ||||
| Control | 62±2.1 | 42±1.7 | 82±2.2 | 38±1.8 |
| Mild (100) | 72±2.1 | 58±2.1 | 74±1.9 | 28±1.9 |
| Moderate (200) | 80±1.8 | 76±2.7 | 88±1.5 | 22±2.1 |
| Severe (300) | 96±2.8 | 88±1.8 | 112±1.4 | 20±2.3 |
Conclusions
From the above results, it can be concluded that the study of morphological and physiological parameters is used to determine the response of Coleus plants to salinity stress. All Coleus species have shown a decrease in their growth and physiology during their exposure to the salinity stress. However, the Coleus aromaticus and Coleus amboinicus have shown better tolerance to the salinity stress with respect to their morphology, carbohydrate content, decreased water potentials, increased electrolyte leakage and water uptake capacity.
Acknowledgement
Research lab of K.V. Chaitanya is funded by the grants from the University grants commission (UGC), Govt. of India, 42-197/2013. Divya is thankful for the UGC research fellowship.
Conflict of Interest
No conflict of interest declared by authors.
Funding Source
This study was supported by University grants commission (UGC), Govt. of India, 42-197/2013.
References
- Khan N. A., Khan M. I. R., Asgher M., Fatma M., Masood A., Syeed S. Salinity Tolerance in Plants: Revisiting the Role of Sulfur Metabolites. Journal of Plant Biochemistry and Physiology. 2014;2:120.
- Blumwald E., Grover A., Good A. G. Breeding for abiotic stress resistance: challenges and opportunities new directions for a diverse planet, 4th International Crop Science Congress, Brisbane, Australia. 2004.
- Li X. G., Li F. M., Ma Q. F., Cui Z. J. Interactions of NaCl and Na2SO4 on soil organic C mineralization after addition of maize straws. Soil Biology and Biochemistry. 2006;38:2328-2335.
CrossRef - Khalid A., Cai W. The effects of Mannitol and salinity stresses on growth and biochemical accumulations in lemon balm. Acta Ecologica Sinica. 2011;31:112-120.
CrossRef - Gehan G. M. Improving the Growth of Fennel Plant Grown under Salinity Stress using some Bio stimulants. American Journal of Plant Physiology. 2015;10:77-83.
CrossRef - Parida A. K., Das A. B. Salt tolerance and salinity effects on plants: A Rev. Ecotoxicology and Environmental Safety. 2005;60:324-349.
CrossRef - Munns R. Comparative physiology of salt and water stress. Plant.Cell & Environment. 2002;28:239-250.
CrossRef - Serraj R., Sinclair T. R. Osmolyte accumulation: can it really help increase crop yield under drought conditions? Plant.Cell & Environment. 2002;25:333-341.
CrossRef - Chaves M. M., Flexas J., Pinheiro C. Photosynthesis under drought and salt stress: regulation mechanisms from whole plant to cell. Annals of Botany. 2009;103(4):551-560.
CrossRef - Chen X., Wang Y., Li J., Jiang A., Cheng Y., Zhang W. Mitochondrial proteome during salt stress-induced programmed cell death in rice. Plant Physiology and Biochemistry. 2009;47:407–415.
CrossRef - Negrao S., Schmockel S. M., Tester M. Evaluating physiological responses of plants to salinity stress. Annals of Botany. 2017;119:1-11.
CrossRef - Flower D. J., Ludlow M. M. Contribution of osmotic adjustment to the dehydration tolerance of water stressed pigeon pea (Cajanas cajan (L.) Milsp) leaves. Plant. Cell & Environment. 1986;9:33-40.
- Katerji N., Hoorn J. W. V., Hamdy A., Mastrorilli M., Karzel E. M. Osmotic adjustment of sugar beets in response to soil salinity and its influence on stomatal conductance growth and yield. Agricultural Water Management. 1997;34:57-69.
CrossRef - Omami N. E. Response of amaranth to salinity stress, Thesis (Ph. D.) University of Pretoria etd. Pretoria, South Africa. 2005.
- Silveira J. A. G., Viegas R. A., Rocha I. M. A., Moreira A. C. D. M., Moreira R. A., Oliveira J. T. A. Proline accumulation and glutamine synthetase activity are increased by salt-induced proteolysis in cashew leaves. Journal of Plant Physiology. 2003;160:115-123.
CrossRef - Sangakkara U. R., Hartwig U. A., Nosberger J. Response of root branching and shoot water potentials of french beans (Phaseolus vulgaris ) to soil moisture and fertilizer potassium. Journal of Agronomy and Crop Science. 1996;177:165–173 .
CrossRef - Hamed K. B., Castagna A., Salem E., Ranieri A., Abdelly C. Sea fennel (Crithmum maritimum L.) under salinity conditions: a comparison of leaf and root antioxidant responses. Plant Growth Regulation. 2007;185-194.
CrossRef - Pandey S. K., Singh H. A simple, cost effective method for leaf area estimation. Journal of Botany. 2011;2011:1-6.
CrossRef - Ashwell G. Colorimetric analysis of sugars. In: Methods in Enzymology. (Eds. S. P. Cohvick and N. O. Kaplan), New York: Academic Press Inc. 1957;3:73-105.
CrossRef - Dubois M., Gilles K. A., Hamilton J. K., Rebers P. A., Smith F. Colorimetric method for determination of sugars in related substances. Analytical Biochemistry. 1956;28:350-356.
CrossRef - Reddy A. R., Reddy K. R., Hodges H. F. Mepiquat chloride (PIX)-induced changes in photosynthesis and growth of cotton. Plant Growth Regulation. 1996;20:179-183.
CrossRef - Bolat I., Dikilitas M., Ercisli S., Ikinci A., Tonkaz T. The Effect of Water Stress on Some Morphological, Physiological, and Biochemical Characteristics and Bud Success on Apple and Quince Rootstocks. The Scientific World Journal. 2014;8.
CrossRef - Mehrizi M. H., Shariatmadari H., Khoshgoftarmanesh A. H., Dehghani F. Copper Effects on Growth, Lipid Peroxidation, and Total Phenolic Content of Rosemary Leaves under Salinity Stress. Journal of Agricultural Science and Technology. 2012;14:205-212.
- Daryush T., Khanif Y. M., Mihdzar A. K., Alireza V., Mohd P. A. Response of King of Bitters (Andrographis paniculata) seedlings to salinity stress beyond the salt tolerance threshold. Australian Journal of Crop Science. 2012;6(6):1059-1067.
- Girija C., Smith B. N., Swamy P. M. Interactive effects of NaCl and CaCl2 on the accumulation of proline and glycine betaine in peanut (Arachis hypogaea). Environmental and Experimental Botany. 2002;47:1-10.
CrossRef - Black C., Osmond C. B. Crassulacean Acid Metabolism Photosynthesis: ‘Working the Night Shift’. Photosynthesis Research. 2003;76:329.
CrossRef - Ramezani E., Ghajar S. M., Ali N. B. H. The effect of salinity on the growth, morphology and physiology of Echium amoenum & Mey. African Journal of Biotechnology. 2011;10(44):8765-8773.
CrossRef - Amini F., Ehsanpour A. A. Soluble Proteins, Proline, Carbohydrates and Na+ /K+ Changes in Two Tomato (Lycopersicon esculentum). Cultivars under in Vitro Salt Stress. American Journal of Biochemistry and Biotechnology. 2005;1:204-208.
CrossRef - Bagheri A., Sadeghipour O. Effects of Salt Stress on Yield, Yield Components and Carbohydrates Content in Four Hull Less Barley (Hordeum vulgare) Cultivars. Journal of Biological Sciences. 2009;9:909-912.
CrossRef - Vijayalakshmi T., Vijayakumar A. S., Kiranmai K., Kumar A. N., Sudhakar C. Salt stress induced modulations in growth, compatible solutes and antioxidant enzymes response in two cultivars of safflower (Carthamus tinctorius cultivar TSF1 and cultivar SM) differing in salt tolerance. American Journal of Plant Sciences. 2016;7:18.
CrossRef - Turan M. A., Elkrim A. H. A., Taban N., Taban S. Effect of Salt Stress on Growth and Ion Distribution and Accumulation in Shoot and Root of Maize Plant. African Journal of Agricultural Research. 2010;5:584-588.
- Innocenti E. D., Hafsi C., Guidi L., Navari F. The Effect of Salinity on Photosynthetic Activity in Potassium-Deficient Barley Species. Journal of Plant Physiology. 2009;66:1968-1981.
- Rezaee M. E., Khavarinejad R. E., Fahimi H. Physiological Response of Cotton (Gossypium hirsutum) Plants to Soil Salinity. Pajouhesh and Sazandegi. 2004;17: 81-89.
- Safarnejad A., Salami M., Hamidi H. Morphological Characterization of Medicinal Plants (Plantago ovata, Plantago psyllium) in Response to Salt Stress. Pajouhesh and Sazandegi. 2007;75:152-160.
- Jahangir S., Hassanali N. B., Hossein Z., Farahnaz K. S., Payam N. Effects of Salinity and Drought on Morphological and Chemical traits of Aloe vera Biological Forum-An International Journal. 2015;7(1):518-527.
- Keyvan A., Setsuko K. Crop and medicinal plants proteomics in response to salt stress. Frontiers in Plant Science. 2013;4.
- Heidari A., Mahmoud T., Ali B., Mohammad-Reza S. Effect of NaCl Stress on Growth, Water Relations, Organic and Inorganic Osmolytes Accumulation in Sunflower (Helianthus annuus) Lines. Universal Journal of Environmental Research and Technology. 2011;1(3):351-362.
- Loreto F., Centritto M., Chartzoulakis K. Photosynthetic limitations in olive cultivars with different sensitivity to salt stress. Plant Cell and Environment. 2003;26:595-602.
CrossRef - Parida A., Das A., Mittra B. Effects of salt on growth, ion accumulation, photosynthesis and leaf anatomy of the mangrove, (Bruguiera parviflora). Trees-Structure and Function. 2004;18:167-174.
CrossRef - Vijayan K. Approaches for enhancing salt tolerance in mulberry (Morus L) -A review. Plant Omics Journal. 2009;2(1):41-59.
- Kavas M., Avas M., Baloglu C., Akca O., Kose F. S., Gokcay D. Effect of drought stress on oxidative damage and antioxidant enzyme activity in melon seedlings. Turkish Journal of Biology. 2013;37:491-498.
CrossRef - Munns R., James R. A. Screening methods for salinity tolerance: A case study with tetraploid wheat. Plant soil. 2003;253:201-218.
CrossRef - Ramón A. M. J., Fernanda O. M., Agustina B. C., Pedro D. V., Jesus S. B. M., Jose Antonio H. Plant Responses to Salt Stress: Adaptive Mechanisms. Agronomy. 2017;7:18.
CrossRef - Munns R. A. Leaf elongation assay detects an unknown growth inhibitor in xylem sap from wheat and barley. Australian Journal of Plant Physiology. 1992;19:127-135.
CrossRef - Koyro H. Effect of salinity on growth, photosynthesis, water relations and solute composition of the potential cash crop halophyte Plantago coronopus (L.). Environmental and Experimental Botany. 2006;56:136-146.
CrossRef - Effect of salinity on morphophysiological characteristics of Dalbergia sissoo Roxb, Thesis submitted to CCSHAU Hisar. 2015.
- Arif S. W., Aqil A., Shamsul H., Qazi F. Salt-induced modulation in growth, photosynthesis and antioxidant system in two varieties of Brassica juncea. Saudi Journal of Biological Sciences. 2013;20:183-193.
CrossRef - Hassan F. A. P. P., Narges R. Physiological response of henna (Lawsonia inermise) to salicylic acid and salinity. Plant Production Science. 2017;20(2):237-247.
CrossRef - Akhtar N., Hossain F., Karim A. Influence of calcium on water relation of two cultivars of wheat under salt stress. International Journal of Environment. 2013;2(1):1-8.
CrossRef

