
Manuscript accepted on :November 07, 2017
Published online on: --
Syed Amir Ashraf1 and Z. R. Azaz Ahmad Azad2
1Department of Food Technology, Faculty of Engineering, JJT University, Jhunjhunu, Rajasthan, India.
2Department of Food Technology, FEIS, Hamdard University, New Delhi, India.
Corresponding Author E-mail: zrazad.jamia@gmail.com
DOI : https://dx.doi.org/10.13005/bpj/1319
Abstract
The aim of present study was to develop and validate a rapid, precise, simple and sensitive method for the detection and quantification of streptomycin (STR) and dihydrostreptomycin (Di-STR) residues in honey using ultra performance liquid chromatography (UPLC) with electron spray ionization (ESI) tandem mass spectrometry. Separation of both the analytes were carried out by using BEH Hillic column 1.7 μm X 2.1 mm X 100 mm (Waters) and triple quadruple mass spectrometer in positive ESI mode. Two characteristics transitions of both the analytes were measured in multiple reaction monitoring mode. The method involved sample preparation in 2% acetic acid in water and acetonitrile followed by solid phase extraction and quantification by UPLC-MS/MS. The developed method was validated in accordance with European Commission Decision 2002/657/EC. The validation parameters were established for STR and Di-STR as CCα (11.68 and 11.27 µg kg-1 respectively), CCβ (13.36 and 12.55 µg kg-1 respectively) and average recovery was between 82-105%. The method presented showed adequate linearity with correlation coefficient above 0.994 for both analytes. Validation parameters were found to be satisfactory and within the European Commission Decision 2002/657/EC. Determination of STR and Di-STR confirms that, the validated method is suitable for routine analysis of commercially available honey samples. Finally, the validated method was applied for the determination of STR and Di-STR in 21 honey samples obtained from the local markets of New Delhi and Gurgaon, India.
Keywords
Antibiotic Residues; Honey; Method Validation;Streptomycin; UPLC-MS
Download this article as:| Copy the following to cite this article: Ashraf S. A, Azad Z. R. A. A. Development and Validation of an UPLC-ESI-MS/MS Analytical Method for the Determination of Streptomycin and Dihydrostreptomycin Residues in Honey. Biomed Pharmacol J 2017;10(4). |
| Copy the following to cite this URL: Ashraf S. A, Azad Z. R. A. A. Development and Validation of an UPLC-ESI-MS/MS Analytical Method for the Determination of Streptomycin and Dihydrostreptomycin Residues in Honey. Biomed Pharmacol J 2017;10(4). Available from: http://biomedpharmajournal.org/?p=17747 |
Introduction
Without any hesitation honey is the most recognized and well-known natural food produced by bees (Apis mellifera) from nectar and honeydew (Cuili et al. 2016). It has at least 181 substances mainly fructose and glucose, and has minor amounts of proteins, enzymes, amino acids, minerals, trace elements, vitamins, aroma compounds and polyphenol (Alvarez-Suarez et al. 2010; De-Melo et al. 2017). Its historic, cultural and economic significance make it the important beekeeping product. Bee keeping has become billion dollar industries in modern days, but due microbiological infestation, environmental, botanical and bad apicultural practices, honey bees and their combs gets effected. This leads to contamination of honey and so inferior quality. Major contaminations of honey in apicultural produces are antibiotic and pesticide residue (Zhou et al. 2014; Zai et al. 2013). However, presence of antibiotic residue are major concerns as antibiotic residue originating from agricultural usage or apicultural practices can adversely influence public health due to allergenic and carcinogenic factors, and may give to bacterial resistance (Wassenaa TM 2005).
The occurrence of antibiotic residues in human foods, arising from its veterinary use is a cause of concern to consumers worldwide (Taokaenchan and Sangsrichan 2010). Streptomycin (STR) is an aminoglycoside produced by Streptomyces griseus strains and dihydrostreptomycin (Di-STR) is the product of its catalytic hydrogenation. STR is protein synthesis inhibitors and in spite of their toxicity, it is widely used in veterinary medicine for treatment of aerobic gram-negative bacteria (Oliveira et al. 2009; Horie et al. 2004). STR is commonly used in apiculture for the prophylactic treatment or control of bacterial brood diseases such as European foul brood and American foul brood disease (Victoria et al. 2007; Pena et al. 2009). Due to these instances, contamination of antibiotics in honey is unavoidable. In the German market, it was found that 21% of 183 honey sample contained streptomycin residues. 1.7% samples found to be positive for streptomycin, sulfonamides, tetracycline, chloramphenicol, nitrofurans, tylosin and quinolones out of 3855 samples, consequently samples was a noncompliant as per European Standards (Al-Waili et al. 2012). During 2000-2001, streptomycin detected in 4 samples out of 248 honey sample. Honey samples collected during the peak flowering season in southern part of Tamil Nadu, India reported to have streptomycin residue in the range of 4–17 ng/kg (Solomon et al. 2006).
Centre for Science and Environments (CSE’s) Pollution Monitoring Lab, or PML found that out of 12 branded honey samples, 11 samples was contaminated with six antibiotics and the tested samples were brought randomly from various markets of Delhi in July 2009. 10 samples were Indian brands and 2 samples were imported brands (CSE, Delhi, India). Presence of such antibiotic residue in honeys is unfavorable for human consumption. High concentrations of streptomycin may produce ototoxicity and nephrotoxic effects. However, regular consumption of STR at low concentrations in foods may also cause allergies, destroy intestinal flora and cause resistance to certain microorganisms (Cara et al. 2013; Gacia et al. 2015). High levels of antibiotic residue in honey exported from India to EU and US have been reported by Agricultural Processed Food Product Export Development Agency (APEDA) from 2005 onwards (Al-Waili et al. 2012).
So far, there are no maximum residue limits (MRLs) for antibiotic residues in honey. Therefore, the presence of veterinary drugs in honey is not authorized. The European Union Reference Laboratories (EU-RLs) provide recommended concentrations (RCs) for the control of non-authorized substances in honey as presented in Table 1 in order to improve and harmonize the performance of the monitoring analytical methods (Hawari et al. 2017; Mahmoudi et al. 2014).
Table 1: Tolerance levels (μg kg-1) for veterinary drugs in honey in several countries
| EU-RLs | India | Canada | Australia | Switzerland | |
| Classes | RCs | MRLs | MRLs | MRLs | MRLs |
| Streptomycin | 40 | 10 | 125 | – | 10 |
| Tetracyclines | 20 | – | – | – | – |
| Tetracycline | – | 10 | 250 | – | – |
| Chlortetracycline | – | 10 | 100 | – | – |
| Oxytetracycline | – | – | – | 300 | – |
| Sulphonamide | 50 | 10 | 100 | – | 50 |
Various methods have been developed and validated for the analysis of antibiotic residues in human food. The selection of method is dependent on the objective of the analysis, availability and the required sensitivity for that particular analysis. Chromatographic techniques coupled with mass spectrometry have turn out to be very popular in recent years, most notably ULTRA performance liquid chromatography–mass spectrometry (UPLC-MS) (Kivrak et al. 2016; Tamosiunas and Padarauskas 2008). Method development for STR and Di-STR becomes challenging because, these antibiotics are highly polar organic basic compounds. Moreover, it shows practically no retention in reversed phase liquid chromatography, except an ion-pairing reagent added to the mobile phase, also considering the suitable concentration to reduce ionization suppression (Kujawski and Namiesnik 2008).
The aim of the present study was to develop a simple, precise and economical analytical method for determination of STR in honey, applying solid phase extraction (SPE) and UPLC-ESI-MS/MS determination. To enhance the accuracy and precision of the analytical method, validation was done in compliant of European Commission (EC) Decision 2002/657/EC. Finally, the method applied for the quantification of STR and Di-STR residue in different honey samples.
Material and Methods
Chemical and Reagents
STR and Di-STR purchased from Sigma Aldrich (St. Louis, MO, USA), SPE Cartridge (Waters Sep-pak Vac 6cc Accell plus CM), Acetic acid, Milli-Q water, Acetonitrile, Aquity UPLC BEH HILIC 1.7 μm, 2.1×100 mm column from waters (Waters Co., Milford, MA, USA), Ammonium formate, Formic acid. LC–MS grade Acetonitrile purchased from Merck Millipore. 10mg standards weighed with 0.1mg sensitivity into 10 ml volumetric flask and dissolved into water: acetonitrile (80:20). Concentration of stock standards calculated considering their purity percentages.
Sample Collection
21 honey samples purchased from the local markets of New Delhi and Gurgaon, India during the month of July – October in the year 2016. Samples stored at room temperature in the dark until analysis. Selected honey samples checked for targeted antibiotics using proposed method, samples found to be free from target antibiotics were considered as blank.
Sample Extraction
10g honey sample weighed into 50 ml centrifuge tube and mixed with 25 ml Milli-Q water to dissolve honey. Furthermore 25 ml Milli-Q water added to make up solution up to 50 ml. After that, samples filtered through Whattman No-1 filter paper and filtered sample solution loaded into SPE cartridge and passed at 2 drops per sec. 5 ml elution solvent 2% acetic acid in water and acetonitrile (80:20) used for elution and collected into 5 ml volumetric flask. Required volume were adjusted with Milli-Q water and filtered into UPLC vial for analysis.
Instrumentation
Chromatographic analysis performed on a UPLC-MS/MS (Waters Acquity Ultra Performance LC-MS/MS, Waters Co., and Milford, MA, USA) equipment consists of a Waters acquity ultra performance liquid chromatography with a Waters column manager, binary system manager, sample manager coupled to a Waters XEVO TQD triple quadruple mass spectrometer equipped with electrospray ionization (ESI). An acquity UPLC BEH Hillic column 1.7 μm X 2.1 mm X 100 mm used for the determination of STR and Di-STR. The mobile phase was (A) Ammonium formate in water having pH 2.5 adjusted with formic acid and (B) Formic acid Acetonitrile in the ratio (90:10), Injection flow 5μL, flow rate 400 μL/min, Column oven temp 40°C. The gradient program was: 0 – 0.1 (A) 10% and (B) 90 %, 0.1 – 2.5 minute (A) 90% and (B) 10%, 2.5 – 6.0 (A) 10% and (B) 90 %. The analysis of samples carried in the positive ESI-MS-MS ion mode.
Mass Spectrometry
MS/MS parameters and precursor-product ions of STR and Di-STR tuned by direct infusion in the SRM mode and 0.40 ml/min flow rate of the mobile phase (A) and (B). MS/MS detector parameters presented in Table 2.
Table 2: MS/MS detector parameters
| Ionization mode | Positive |
| MS Aquire time | 6.0 minute |
| Capillary voltage | 3.8kV |
| Source temperature | 150°C |
| Disolvation temperature | 550°C |
| Ion energy | 0.50 |
| Cone gas flow | 25 L/Hr |
Method Validation
The UPLC–MS/MS method validated according to 2002/657/EC guidelines. UPLC–MS/MS identification of antibiotic residues verified during the course of validation study by monitoring relative retention times, ion recognition (signal-to-noise ratio) and relative ion intensities. UPLC-MS/MS identification criteria were set out in the legislation and verified throughout validation of the method. In this study, various validation parameters such as selectivity, linearity, recovery (accuracy), repeatability (precision), limit of quantification (LoQ), decision limit (CCα), detection capacity (CCβ), ruggedness validated to evaluate performance of the developed method.
Results and Discussion
An accurate, simple, fast and cost effective UPLC–ESI- MS/MS method developed and validated as per European Commission Decision 2002/657/EC for determination of STR and Di-STR residue in honey samples. Subsequently, quantification of STR and Di-STR achieved by means of validated method in honey samples collected from the local markets of New Delhi & Gurgaon, India.
UPLC-ESI-MS/MS Method Development
To carry out this experiment Aquity UPLC BEH Hilic column used with 20mM ammonium formate in Milli-Q water having pH 2.5 adjusted with formic acid and acetonitrile as mobile phase. The gradient program in the analysis under the conditions described in the methodology section allows separation of STR and Di-STR with good resolution. The mean retention time for STR and Di-STR was obtained 1.70 minutes as presented in Fig. 1. However, Area for the blank sample spiked with 10.0 μg kg-1 was illustrated in Table 3. Previous studies reported that, analysis of STR and Di-STR by means of LC-MS/MS using mobile phase A as (water with 0.05% formic acid) and B (Acetonitrile with 0.05% formic acid) and the coloum Hilic Atlantis (150 x 2.1 mm, 3 µm particle size) and the Hilic MonoChrom 5 MS from Varian (150 x 2 mm), each with adequate guard were used (Bohm et al. 2012). Retention time obtained in this study was at 8.0 minutes, which was higher than our retention time 1.70 minutes. Granja et al. 2009 reported determination of streptomycin using column Gemini 5 µm C18 (50mm×2mm) and 5mM heptafluorobutiric acid/acetonitrile (85:15) as the mobile phase at a flow rate of 200 µL min−1. Retention time obtained in this study was at 5.40 minutes. This was also higher than our retention times. From the retention point of view the present study have advantage over former one.
MS/MS technique allows for mass analysis to take place in a sequential manner in different regions of the instrument. Triple quadruple system follows the tandem in space arrangement due to ionization, primary mass selection, collision induced dissociation, and mass analysis of fragments produced during collision induced dissociation and detection occurring in separate segments of the instrument. Optimized Multiple Reaction Monitoring (MRM) transition of the validated method has been presented in Table 4.
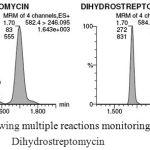 |
Figure 1: Chromatogram showing multiple reactions monitoring for streptomycin and Dihydrostreptomycin
|
Table 3: Selectivity for validated method of streptomycin and dihydrostreptomycin
| Compound 1 2 3 4 5 6 Mean SD % RSD | ||||||||||
|
STR |
RT | 1.70 | 1.70 | 1.70 | 1.71 | 1.70 | 1.71 | 1.70 | 0.004 | 0.217 |
| Area | 128 | 137 | 139 | 144 | 141 | 137 | 138 | 5.4 | 3.9 | |
|
Di-STR |
RT | 1.70 | 1.70 | 1.70 | 1.70 | 1.70 | 1.70 | 1.70 | 0.000 | 0.000 |
| Area | 201 | 231 | 217 | 220 | 224 | 208 | 217 | 10.9 | 5.0 | |
Table 4: Summary of multiple reactions monitoring for analytes detected in positive ionization mode
| Compound | Parent ion | Daughter ion | Cone Voltage | RT | Dwell Time (Sec) | Collision
Energy |
| STR | 582.4 | 246.09 | 80 | 1.70 | 0.1 | 35 |
| 263.13 | 80 | 1.70 | 0.1 | 30 | ||
| Di-STR | 584.5 | 246.10 | 80 | 1.70 | 0.1 | 35 |
| 263.14 | 80 | 1.70 | 0.1 | 30 |
RT- Retention time
Method Validation
Validation was carried out in accordance with the procedures outlined in Europe Commission Decision 2002/657/EC covering specificity, linearity, accuracy, precision, Limit of Quantification (LoQ), Decision limits (CCα) and Decision capability (CCβ). The ruggedness of the method was demonstrated as an ongoing basis through the use of it, to analyze various honey sample collected from local markets of New Delhi & Gurgaon, India during 2016. The values identified for these parameters were all within Europe Commission Decision 2002/657/EC.
Specificity/ Selectivity
The developed method was checked for specifity by preparing 7 different honey matrix blank samples and injected into the UPLC-MS/MS system. The analysis was performed and from the chromatogram & mass spectra. We found that, no significant peaks with S/N (signal to noise) ratios and no interferences at the retention time of our interest of analytes as presented in Fig. 2 and the method was specific.
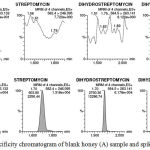 |
Figure 2: Specificity chromatogram of blank honey (A) sample and spiked sample (B) Linearity
|
A matrix calibration curves were constructed for analyte in the sample. A sufficient number of standards were used to adequately define the relationship between concentration and response. We constructed a matrix spiked calibration curve with the 6 different concentration ranges from 2.0 μg kg-1, 5.0 μg kg-1, 10.0 μg kg-1, 15.0 μg kg-1, 20.0 μg kg-1 and 50.0 μg kg-1 of the anlayte. A calibration curves were evaluated between the Area vs Concentrations of the analyte and the r2 was calculated 0.994. This was acceptable as per Commission Decision 2002/657/EC.
Accuracy/Recovery
Recovery of an anlayte was obtained from the known concentration added to the sample matrix and recovered. To evaluate the recovery 7 blank honey samples were taken each spiked with STR and Di-STR at 2.0 µg kg-1, 5.0 µg kg-1, 10.0 µg kg-1, 20.0 µg kg-1 and 50.0 µg kg-1. Recoveries of seven spiked samples were presented in Table 5 and Table 6. The recovery results were observed in acceptable range of 80-110 %.
Table 5: Showing spiked concentration versus estimated concentration
|
Spike Concentration |
Streptomycin (µg kg-1) | ||||
| 2.0 | 5.0 | 10.0 | 20 | 50.0 | |
| Mean (7 sample) | 2.07 | 4.64 | 9.32 | 19.82 | 50.16 |
| SD | 0.25 | 0.49 | 1.08 | 0.33 | 0.76 |
| RSD % | 5.7 | 11.73 | 11.58 | 6.71 | 14.92 |
| Recovery % | 85.9 | 82.7 | 93.2 | 96.8 | 99.5 |
SD- Standard deviation, RSD- Relative standard deviation
Table 6: Showing spiked concentration versus estimated concentration
|
Spike Concentration |
Dihydrostreptomycin (µg kg-1) | |||||
| 2.0 | 5.0 | 10.0 | 20 | 50.0 | ||
| Mean (7 sample) | 1.96 | 4.51 | 10.08 | 19.48 | 51.11 | |
| SD | 0.45 | 0.23 | 0.39 | 0.50 | 1.16 | |
| RSD % | 10.09 | 5.27 | 3.92 | 10.05 | 8.02 | |
| Recovery % | 91.7 | 88.2 | 99.9 | 91.6 | 93.2 | |
SD- Standard deviation, RSD- Relative standard deviation
Repeatability (Precision)
Repeatability of STR and Di-STR in honey was performed by taking blank honey samples fortified with STR and Di-STR at 2.0 µg kg-1, 5.0 µg kg-1, 10.0 µg kg-1, 20.0 µg kg-1 and 50.0 µg kg-1. For each level, analysis was performed with 7 replicates as per the EC guidelines. Same method was repeated in two other different days and Coefficient of variation (CV) % and Mean recovery (MR) % were calculated as shown in Table 7.
Table 7: showing spiked concentration at different levels with % mean recovery and % coefficient of variation
|
Analyte |
2 µg kg-1 | 5 µg kg-1 | 10 µg kg-1 | 20 µg kg-1 | 50 µg kg-1 | |||||
| MR% | CV% | MR% | CV% | MR% | CV% | MR% | CV% | MR% | CV% | |
| STR | 93.8 | 4.1 | 93.30 | 13.0 | 94.40 | 9.9 | 101.5 | 3.9 | 96.0 | 10.4 |
| Di-STR | 98.7 | 3.0 | 92.40 | 7.0 | 97.60 | 4.8 | 94.9 | 2.2 | 94.60 | 10.5 |
MR- Mean Recovery CV- Coefficient of variation
Limit of Quantification (LoQ)
The minimum concentration of the anlayte that can be quantified with acceptable accuracy and precision. LoQ was evaluated, 7 Honey samples were spiked with STR and Di-STR at concentration of 2.0 μg kg-1 and determination was performed 3 times, Recovery percentage and Relative standard deviation were calculated as presented in Table 8. The recovery obtained was in the range of 92- 104%, however RSD was below 11%. So, we conclude our LoQ as 0.15 μg kg-1. Values calculated for LoQ was within the EC regulation.
Table 8: showing Limit of quantification of streptomycin and dihydrostreptomycin with spiked concentration
| Conc. Spiked (μg kg-1) | Conc. Recovered (μg kg-1) STR | Mean | %RSD | Recover% | ||||||||||
| 1 | 2 | 3 | 4 | 5 | 6 | 7 | ||||||||
| 2.0 | 1.99 | 1.82 | 1.90 | 1.92 | 2.03 | 2.04 | 1.84 | 1.95 | 4.3 | 97.5 | ||||
| 2.0 | 1.82 | 1.67 | 1.81 | 1.72 | 1.83 | 1.64 | 1.74 | 1.75 | 4.9 | 87.4 | ||||
| 2.0 | 2.06 | 2.02 | 2.19 | 2.04 | 2.07 | 2.00 | 2.12 | 2.08 | 2.9 | 104.2 | ||||
| Conc. Spiked (μg kg-1) | Conc. Recovered (μg kg-1) Di- STR | Mean | %RSD | Recover% | ||||||||||
| 1 | 2 | 3 | 4 | 5 | 6 | 7 | ||||||||
| 2.0 | 1.98 | 2.06 | 2.14 | 1.96 | 1.97 | 2.19 | 1.82 | 2.05 | 4.9 | 102.5 | ||||
| 2.0 | 1.92 | 1.89 | 1.93 | 1.93 | 1.83 | 1.87 | 1.82 | 1.90 | 2.2 | 94.8 | ||||
| 2.0 | 1.94 | 1.91 | 1.97 | 1.90 | 1.91 | 2.03 | 1.95 | 1.94 | 2.6 | 97.2 | ||||
Decision limits (CCα), Decision Capability (CCβ)
The CCα is the lowest concentration level of the analyte that can be detected in a sample with a chance of 1% of a false positive decision whereas CCβ is the smallest content of the analyte, which can be detected in a sample with a chance of 5% of false negative decision. In compliance with the decision 2002/657/EC concerning the performance of the methods, CCα and CCβ were elaborated using blank honey samples fortified with (2.0, 5.0, 10.0, 20.0 and 50.0 μg kg-1). CCα and CCβ values obtained for STR and Di-STR was 11.68 μg kg-1,11.27 μg kg-1 and 13.36 μg kg-1, 13.36 μg kg-1respectively. Both CCα and CCβ were presented in Table 9. This was found to be in compliance with EC Decision.
Table 9: showing validation parameters for CAP
| Compounds | LoQ (μg kg-1) | Decision Limit (CCα) (μg kg-1) | Detection Capability (CCβ) (μg kg-1) |
| STR | 2.0 | 11.68 | 13.36 |
| Di-STR | 2.0 | 11.27 | 12.55 |
Application of the Developed Method to Market Samples
After validation of the analytical methodology, the applicability of the method was evaluated by analyzing 21 honey samples collected from local market of New Delhi and Gurgaon, India. These samples were processed as described in material & method section. In 21 honey samples, none of them were detected for STR and Di-STR as presents in Fig. 3. The identification criteria were based on the presence of chromatographic peaks for both transitions (qualifier and quantifier) at the same retention time. Quantification was carried out using calibration standards that were prepared by spiking blank samples before extraction with the analytes at different specific concentration levels used for validation.
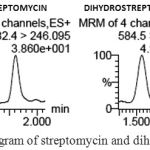 |
Figure 3: Total ion chromatogram of streptomycin and dihydrostreptomycin in honey sample
|
Conclusion
The proposed method developed and validated for determination of STR and its derivatives Di-STR in honey as per Commission Decision 2002/657/EC. The objective of this study was to develop a time saving, cost effective, precise and sensitive method for determination of STR and Di-STR. The sample preparation procedure was simple, which is critical for a rapid analysis that makes procedure less susceptible to analyte losses and as a result an adequate extraction with recovery (82–102% for STR, 88–102% for Di-STR). The method linearity was acceptable with correlation coefficients above 0.994 for both the analytes in the linear range from 2–50 μg kg-1. All the obtained data fulfills the requirements laid down by European Commission Decision 2002/657/EC. The method allowed for the monitoring of parent ion and two fragment ions for each analyte, which attains the purpose of confirming identity of the analytes. The validation parameters showed that the method developed was adequate for the quantification and confirmation of STR and Di-STR residue in honey at concentration lower than the recognized RC 40 μg kg-1 led by European Commission Decision 2002/657/EC.
Acknowledgements
We are thankful to the Department of Food technology, F.E.I.S., Hamdard University, New Delhi and Department of Food technology, JJT University, Rajasthan for providing facilities to carrying out the present study
Conflict of Interest
There is no conflict of interest.
Funding Sources
There was no funding source to carry out this study.
References
- Cuili M, Spano N, Pilo M.I, Sanna G. Recent advances in the analysis of phenolic compounds in unifloral honeys. Molecules. 2016;21:451.
CrossRef - Alvarez-Suarez J.M, Tulipani S, Romandini S, Bertoli E, Battino M. Contribution of honey in nutrition and human health: a review. Mediterranean Journal of Nutrition and Metabolism. 2010;3:15–23.
CrossRef - De-Melo A.A.M, Almeida-Muradian D.L.B, Sancho M.T, Pascual-Mate A. Composition and properties of Apis mellifera honey: A review. Journal of Apicultural Research. 2017.
- Zhou J, Yao L, Li Y, Chen L, Wu L, Zhao J. Floral classification of honey using liquid chromatography–diode array detection–tandem mass spectrometry and chemometric analysis. Food Chemistry. 2014;145: 941–949.
CrossRef - Zai I.U.M, Rehman K, Hussain A, Detection and quantification of antibiotics residues in honey samples by chromatographic techniques. Middle-East Journal Scientific Research. 2013;14(5):683-687.
- Wassenaa T.M. The use of antimicrobial agents in veterinary medicine and implications for human health. Critical Reviews Microbiology. 2005;31:155-169.
CrossRef - Taokaenchan N, Sangsrichan S. HPLC-Fluorescence detection method for quantitative determination of tetracycline antibiotic residues in honey. NU Science Journal. 2010;6(2):147–155.
- Oliveira R.C.D, Paschoal J.A.R, Sismotto M, Airoldi F.P.D.S, Reyes F.G.R. Development and validation of an LC–APCI-MS–MS analytical method for the determination of streptomycin and dihydrostreptomycin residues in milk. Journal Chromatographic Science. 2009;47:757-761.
CrossRef - Horie M, Saito H, Natori T, Nagata J, Nakazawa H. Determination of streptomycin and dihydrostreptomycin in honey by liquid chromatography–electrospray mass spectrometry. Journal of Liquid Chromatography & Related Technologies. 2004;27(5):863–874.
CrossRef - Victoria B, Marghitas L.A, Dezmirean D, Moise A, Bobis O, Maghear O. Optimization of HPLC method for quantifying tetracycline residue in honey. Bulletin USAMV-CN. 2007;63:186-190.
- Pena A, Pelantova N, Lino C.M, Silveira M.I.N, Solich P. Validation of an analytical methodology for determination of oxytetracycline and tetracycline residues in honey by HPLC with fluorescence detection. Journal Agricultural and Food Chemistry. 2005;53:3784-3788.
CrossRef - Al-Waili N, Salom K, Al-Ghamdi A, Ansari M.J. Antibiotic, pesticide, and microbial contaminants of honey: human health hazards. The Science World Journal. 2012;1-9.
CrossRef - Solomon R, Satheeja S, Vimalan J. Prevalence of antibiotics in nectar and honey in South Tamil Nadu, India. Integra Biosciences. 2006;10: 163-167.
- http://www.cseindia.org/content/cse-lab-study-busting-myth-about-%E2%80%98pure-and-natural%E2%80%99-honey
- Cara M.C, Dumitrel G, Glevitzky M, Mischie C, Silaghi-Perju D. Thermal degradation of streptomycin residues in honey during storage. Food Technology and Biotechnology. 2013;51(3):429–433.
- Gacic M, Bilandzic N, Sipusic D.I, Petrovic M, Kos B, Vahcic N, Suskovic J. Degradation of oxytetracycline, streptomycin, sulphathiazole and chloramphenicol residues in different types of honey. Food Technology and Biotechnology. 2015;53(2):154–162.
- Hawari K.E, Mokh S, Doumyati S, Iskandarani M.A, Verdon E. Development and validation of a multiclass method for the determination of antibiotic residues in honey using liquid chromatography tandem mass spectrometry. Food Additives & Contaminants: Part. A. 2016;34(4).
- Mahmoudi R, Moosavy M, Norian R, Kazemi S, Nadari M.R.A, Mardani K. Detection of oxytetracycline residues in honey samples using ELISA and HPLC methods. Pharmaceutical sciences. 2014;19(4):145-150.
- Kivrak I, Kivrak S, Harmandar M. Development of a rapid method for the determination of antibiotic residues in honey using UPLC-ESI-MS/MS. Food Science and Technology (Campinas). 2016;36(1):90-96.
CrossRef - Tamosiunas V, Padarauskas A. Comparison of LC and UPLC coupled to MS–MS for the determination of sulfonamides in egg and honey. Chromatographia. 2008;67:783–788.
CrossRef - Kujawski M.W, Namiesnik J. Challenges in preparing honey samples for chromatographic determination of contaminants and trace residues. Trends in Analytical Chemistry. 2008;27(9):785-793.
CrossRef - Bohm D.A, Stachel C.S, Gowik P. Confirmatory method for the determination of streptomycin and dihydrostreptomycin in honey by LC–MS/MS. Food Additives & Contaminants: Part A. 2012;29(2): 189–196.
CrossRef - Granjaa R.H.M.M, Nino A.M.M, Zucchetti R.A.M, Nino R.E.M, Patel R, Salerno A.G. Determination of streptomycin residues in honey by liquid chromatography–tandem mass spectrometry. Analytica Chimica Acta. 2009;637:64–67.
CrossRef

