
Manuscript accepted on :December 13, 2017
Published online on: --
Plagiarism Check: Yes
Hyung Lyung Jung1, Jong Sik Ryu1, Sang Yeong Kim1, Young Taek Doo2 and Ho Youl Kang1
1Department of Physical Education, Kyungpook National University, Daegu, Republic of Korea.
2Department of Physical Therapy, Gwangju Woman’s University, Gwangju, Republic of Korea.
Corresponding Author E-mail: hokang@knu.ac.kr
DOI : https://dx.doi.org/10.13005/bpj/1276
Abstract
We evaluated the effects of low- and high- dosage growth hormone (GH) administration on muscle ceramide contents and insulin resistance in rats. 24 rats were randomly assigned to three groups: low dosage GH injection group (L/GH, n = 8), high dosage GH injection group (H/GH, n = 8) and saline injection group (CON, n = 8). GH groups received GH by subcutaneous injections (L/GH; 65 μg/kg/day, H/GH; 130 μg/kg/day, 6 days/week) for 4 weeks, while CON received saline injections that were equivalent in volume to L/GH group. At the end of 4-week treatments, plasma lipids, insulin and glucose levels were measured. Glucose transporter 4 protein (GLUT-4) and ceramide contents were determined in muscle while triglyceride contents were determined in both muscle and liver. Rate of glucose uptake was determined under submaximal and non- insulin conditions during the epitrochlearis incubation. After 4 weeks of GH injection, H/GH had significantly higher plasma FFA levels (p < 0.05), but L/GH did not have it compared to CON. Plasma insulin levels were significantly lower in H/GH and glucose level in H/GH was higher than CON group (p < 0.05). Muscle ceramide, muscle and liver triglyceride contents were significantly greater in H/GH than CON, but those were not significantly different between L/GH and CON. Glucose transport rate under submaximal insulin condition was significantly lower in H/GH group than CON group (p < 0.05), but L/GH was not different from CON. Therefore, results of this study suggested that the deterioration of muscle insulin resistance due to GH treatment is strongly associated with the elevated TG and ceramide contents due to high GH administration dosage in rats.
Keywords
Growth Hormone; Muscle Triglyceride, Liver Triglyceride; Ceramide; Glucose Transport Rate; Insulin Resistance
Download this article as:| Copy the following to cite this article: Jung H. Y, Ryu J. S, Kim S. Y, Doo Y. T, Kang H. Y. Comparison of Low and High-dose Growth Hormone Administration on Muscle Ceramide Contents and Insulin Resistance in Rats. Biomed Pharmacol J 2017;10(4). |
| Copy the following to cite this URL: Jung H. Y, Ryu J. S, Kim S. Y, Doo Y. T, Kang H. Y. Comparison of Low and High-dose Growth Hormone Administration on Muscle Ceramide Contents and Insulin Resistance in Rats. Biomed Pharmacol J 2017;10(4). Available from: http://biomedpharmajournal.org/?p=18348 |
Introduction
The over the past decades, GH administration has been accepted as anti–ageing, physical growth, and bone health treatments in medical clinics, and the physiological effects of GH are well presented in the literature (Doga et al. 2006; Henwood et al. 2002; Woodhouse et al. 2006). Notably, injection of GH is also suggested to antagonize the effects of insulin on glucose and lipid metabolism; (Bramnert et al. 2003; Cartee et al. 1995; Chrisoulidou et al. 2000; Groop et al. 2005; Ng et al. 1990) in vivo experimental investigations demonstrate that GH treatment can reduce glucose and insulin and responses in animals (Cartee & Bohn. 1995; Hou et al. 2003; Ng et al. 1990). Also, the injection of GH in rats is reported to increase the triglyceride contents in both muscle and hepatic tissues and also to increase muscle insulin resistance (Park et al. 2008).
The responsible mechanism for the reported association between GH treatment and insulin resistance is not fully elucidated, but elevated levels of plasma FFA and reduced levels of GLUT-4 protein contents have been suggested (Binnerts et al. 1992; Jorgensen et al. 2004; Kim et al. 1999; Moller et al. 2003; Zisman et al. 2000). It has been widely accepted that increased plasma FFA concentrations could accelerate the increase in intramuscular triglyceride content, which might contribute to deterioration of insulin sensitivity in skeletal muscle of rats (Jung et al. 2010). Some researchers have reported a positive association between intramuscular triglyceride content and insulin resistance in muscle (Hegarty et al. 2002; Pan et al. 1997). According to previous our results, GH injection (130 mg/kg/6 days/4 weeks) in rats caused the increase in insulin resistance and triglyceride contents in skeletal muscle (Park et al. 2008). These results could be suggested that GH treatment might develop the skeletal insulin resistance even though other beneficial therapeutic effects of GH treatment have been believed in clinic. However, in the literature, the results about GH treatment have been inconsistent in insulin resistance (Park et al. 2008; Reynolds et al. 2013; Yuen et al. 2014) . We assume that these differences in GH administration might be due to injection dosage of GH. But, little is known about injection dosage in GH treatment for the development of insulin resistance. Therefore, we examined the effects of high- and low- dosage of GH treatment and hypothesized that it will be different in elevated muscle triglyceride level and deteriorate insulin sensitivity.
Methods
Animals
Studies were performed on 24 male Sprague–Dawley rats weighing 125–131 g (Samtaco Bio Korea, Inc.). Experimental protocol was approved by by Kyungpook National University Animal Care and Use Committee. During experiments, the rats were kept in cages placed in a room temperature with 12 h light-darkness cycle and given Harlan rat chow (Harlan Teklad®) with tap water ad libitum. At the start of the study, rats were matched by randomly separated into 1 of 3 groups: saline treatment group (CON, n = 8), Low dosage GH treatment group (L/GH, n = 8) and High dosage GH treatment group (H/GH, n = 8). GH treatment groups received recombinant human growth hormone (Eutropin®, LG inc, Gyeonggi-Do, Korea) by subcutaneous injections (L/GH; 65 μg·kg-1·day-1, H/GH; 130 μg·kg-1·day-1, 6 days·week-1) for 4 week experimental period, while CON group injected equivalent volume saline as GH group.
Tissue and Blood Processing
After the 8 h fasting, rats were anesthetized by sodium pentobarbital (6.5 mg·kg-1) through the intraperitoneal injection. Both right- and left-side epitrochlearis muscles were sugically removed to determine glucose transport rate in muscle (Kawano et al. 1999), while plantaris muscle and liver were excised to measure the triglyceride content. Blood samples were drawn from an abdominal aorta to determine plasma glucose, insulin, total cholesterol, triglyceride, high-density lipoprotein cholesterol (HDL-C), and FFA concentrations.
Biochemical Measurements
Blood was added to 0.1 ml EDTA (24 mg/ml, pH 7.4) and centrifuged for 10 min at 1,000 g, and the plasma was separated. Plasma glucose was determined with a glucose analyzer (Model YSI-23A, Yellow Springs Instruments, Yellow Springs, OH, USA) and plasma insulin was measured via radioimmunoassay (Linco, St. Charles, MO) by using a double antibody procedure (Morgan et al. 1962). Plasma FFA was determined using Noma’s method (Noma et al. 1973). Plasma triglyceride, total cholesterol, and HDL-C concentrations were determined by an enzymatic method.
Muscle and Liver Triglyceride Content
Plantaris muscle samples were homogenized as 1:20 dilution in 50 mM potassium phosphate and 1 mM EDTA (pH 7.4), while liver samples were homogenized with 1:15 dilution. Lipid was determined by following guidelines described by Burton and Anderson (Burton et al. 1985). After centrifugation (1,000 g at 4°C for 10 min), the lipid-containing phase was evaporated to dryness with N2 gas, leaving a small lipid pellet that was then resuspended in 0.5 ml of 4% ethanoic KOH and heated for 20 min at 75°C to hydrolyze the triglyceride into fatty acyl and glycerol. The addition of 1 ml of 0.15 M MgSO4 and subsequent centrifugation (1,000 g at 4°C for 10 min) allowed for precipitation of the fatty acyl units, leaving only glycerol, which was determined by an enzymatic method
Skeletal Muscle GLUT-4 Content
GLUT-4 protein was assayed in plantaris muscle homogenates by use of quantitative Western blotting procedures, which involved digitizing autographs and using a heart reference standard, as reported previously (Park et al. 2008).
Skeletal Muscle Ceramide Content
Ceramide content was assayed in plantaris muscle as reported previously (Park 2008). Plantaris muscle was homogenized in buffer (0.25M sucrose, 25mM KCl, 50mM Tris, 0.5mM EDTA; pH 7.4). After homogenization, lipid extraction was made by adding a chloroform, methanol, and buffer water mixture maintained at the ratio of 0.5:1.0:0.4 and 1.0:1.0:0.9 (v/v/v) before and after dilution, respectively. Lipid extraction and ceramide quantification were by following methods described by Bielawska et al. (2001). The silica gel was then exposed to X-ray film at -20°C for 12 hours. Then, ceramide 1-[32P] phosphate’s activity was measured for one minute per silica gel using a liquid scintillation counter (Wallac 1409 DSA; PerkinElmer Inc., Waltham, MA, USA).
Glucose Transport Rate Assay
Epitrochlearis muscles were subjected to glucose transport rate assay, which was performed by using non-metabolized 3‐O‐methyl‐d‐glucose (3-MG), as described previously (Jung and Kang, 2013). After pre-incubation, epitrochlearis muscle was incubated in 2 mL of Krebs–Ringer buffer containing 4 mmol·L−1 [3H]3MG (2.2μCi·mL−1) and 16 mmol/L d‐[1‐14C]‐mannitol (0.2 μCi·mL−1) at 30°C for 10 min. Epitrochlearis was then digested with 1 mol·L− NaOH at 80°C for 10 min, neutralized with 1 mol·L−1 HCl, and then centrifuged at 1,600 rpm for 4 min at the micro centrifuge. Radioactivity in the supernatant was measured by dual‐label liquid scintillation counting and then glucose transport rate was (Young et al. 1997).
Statistical Analysis
Statistical analysis was performed using SPSS software (SPSS, Chicago, IL). Values are expressed as means ± standard error (Mean ± SE). A significant difference was considered to exist when p < 0.05. One-way ANOVA was used to see the change among three groups after handling. Least significant difference was used for post-hoc analysis.
Results
Biochemical Characteristics
Biochemical characteristics after 4 weeks of GH treatments are showed in Table 1. Insulin concentrations of H/GH had lower than that of CON (p < 0.05) and plasma glucose concentrations of H/GH had higher than that of CON (p < 0.05). However, plasma glucose and insulin levels were not different between L/GH and CON. H/GHhad significantly higher FFA values than the CON ( p < 0.05), but FFA level was not different between L/GH and CON. There were no statistically significant differences in plasma triglyceride, total cholesterol, and HDL-C values among all three groups.
Table 1: Biochemical characteristics after 4-week GH injection.
| Variable | CON (n=8) | L/GH(n=8) | H/GH(n=8) |
| GLUCOSE(mmol/L) | 10.05±0.58 | 9.31±0.52 | 8.37±0.16 |
| INSULIN(pmol/L) | 6.60±0.69 | 7.78±0.83 | 11.46±1.74 |
| FFA (mmol/L) | 0.58±0.04 | 0.63±0.05 | 0.88±0.06* |
| TC (mmol/L) | 2.06±0.06 | 2.14±0.06 | 2.23±0.07 |
| TG (mmol/L) | 0.39±0.04 | 0.44±0.03 | 0.43±0.04 |
| HDL-C(mmol/L) | 0.79±0.04 | 0.92±0.07 | 0.85±0.04 |
CON, Control group; L/GH, Low GH injection group; H/GH, High GH injection group; FFA, free fatty acids; TC, total cholesterol; TG, Triglycerides; HDL-C, high-density lipoprotein cholesterol. Data are show as means ± SE. *p<0.05 vs CON.
Muscle and Liver Triglyceride Content
Triglyceride contents in the muscle and liver of H/GH had significantly higher than those in the CON, respectively (Figure 1). However, triglyceride contents in muscle and liver were not different between L/GH and CON.
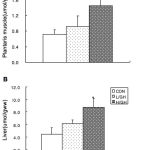 |
Figure 1: Triglyceride levels in plantaris muscle (A) and liver (B) in rats.
|
CON, Control group; L/GH, Low GH injection group; H/GH, High GH injection group. Data are show as means ± SE.*p<0.05 vs CON.
Skeletal Muscle GLUT-4 Content
There was no significant difference contents among all three groups in GLUT-4 protein (Figure 2).
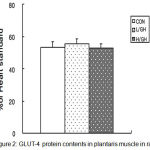 |
Figure 2: GLUT-4 protein contents in plantaris muscle in rats.
|
CON, Control group; L/GH, Low GH injection group; H/GH, High GH injection group. Data are show as means ± SE.
Glucose Transport Assay
Glucose transport rate in epitrochlearis muscle of H/GH had a lower under submaximal insulin concentrations than did the CON, but the glucose transport rate was not significantly different between L/GHand CON. But, there was no significant difference among three groups under non-insulin concentraion (Figure 3).
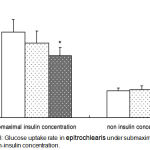 |
Figure 3: Glucose uptake rate in epitrochlearis under submaximal insulin and non-insulin concentration.
|
CON, Control group; L/GH, Low GH injection group; H/GH, High GH injection group. Data are show as means ± SE.*p<0.05 vs CON.
Skeletal Muscle Ceramide Content
Ceramide content in muscle of H/GH was significantly higher than that of the CON (Figure 4). However, the ceramide contents were not significantly different between L/GH and CON.
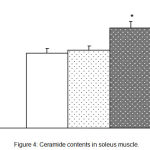 |
Figure 4: Ceramide contents in soleus muscle.
|
CON, Control group; L/GH, Low GH injection group; H/GH, High GH injection group. Data are show as means ± SE.*p<0.05 vs CON
Discussion
In this investigation, we found a decreased glucose transport rate under submaximal insulin concentration and also an increased triglyceride contests in both muscle and liver at only high dosage GH injected rats. However, in low dosage GH injected rats, a glucose transport rate and triglyceride contents in muscle and liver was not significantly affected by GH injection compared to control rats. In addition, plasma FFA and glucose levels in high dosage GH injected rats were significantly elevated in comparison to control rats, but those in low dosage GH injected rats did not. Hence, the significant result of this experiment is that the insulin sensitivity and triglyceride content of skeletal muscle in rats would be insignificantly affected by low dosage of GH injection.
It has been reported that chronic GH injection in rats significantly elevated intramuscular and hepatic triglyceride contents and also deteriorated insulin sensitivity in epitrochlearis muscle (Park et al. 2008). Thus, the authors suggested that intramuscular triglyceride increase due to GH administration could partly related to the deterioration of insulin resistance. Also, the elevated intramuscular triglyceride content in itself might not affect muscle insulin sensitivity, but rather acts as a source for lipid derivatives, such as diacylgycerol, ceramides or long chain fatty acid acyl-CoA, that directly affect the intracellular insulin-signaling process and, thus, insulin sensitivity (Straczkowski et al. 2007; Summers. 2006; Summers et al. 1998). According to the results of Summer’s study (Summers. 2006), it has been reported that the muscle ceramide content may affect insulin signaling process at the level of intracellular protein kinase B (PKB)/Akt in muscle (Schmitz-Peiffer et al. 1999). Hence, we suggested that the decreased glucose transport activity due to GH treatment may partly related to the elevations of intramuscular triglyceride storage and ceramide content. In this investigation, we observe that muscle triglyceride storage and ceramide contents are only significantly elevated in high dosage GH injected rats, but they are not occurred in low GH dosage injected rats. Thus, the increased muscle ceramide content due to GH treatment may probably depend upon amount of GH injected dosage.
It has been suggested that plasma FFA level due to GH injection is positively related to insulin resistance in rats (Krag et al. 2007; Segerlantz et al. 2003). In this investigation, the elevated FFA levels is only observed in H/GH group, but they are not observed in L/GH group. Many prior studies suggested that an elevation in plasma FFA level might be a major responsible factor for the deterioration of insulin affinity in skeletal muscle and adipocytes (Boden et al. 2002; McGarry. 2002). Elevation of plasma FFA levels by GH injection has been proposed to be strongly connected to insulin resistance (Johansen et al. 2003; Jorgensen et al. 2004; Moller et al. 2003). According to the results of the previous studies, the lipolytic activities of GH might stimulate the gene expression after binding to the GH receptor on plasma membrane and then subsequent elevating activities of JAK2 tyrosine kinase and adenyl cyclase, and then stimulating cAMP production, activating the hormone-sensitive lipase by increasing plasma FFA level (Louveau et al. 2004; Richelsen. 1999; Yip et al. 1999). In accordance with the glucose-FFA cycle proposed by Randle et al. (Randle et al. 1963), the elevated plasma FFA levels may reduce the glucose uptake in insulin sensitive tissues such as skeletal muscle and adipocyte. In here, skeletal muscle is major storage space for 70 – 80% of insulin-mediated transported carbohydrate in the whole body. Thus, the skeletal muscle is considered to be the major body tissue of insulin resistance (Ivy et al. 1999). The mechanism by which increased plasma circulating FFA levels suppressed the insulin-mediated glucose uptake of skeletal muscle may involve the intracellular signaling pathway of insulin responsible for GLUT-4 translocation to muscle plasma membrane, including glycogen synthase activity, PI3K activity or IRS-1 phosphorylation (Boden. 2003; Cartee & Bohn. 1995; Christopher et al. 1998; Jessen et al. 2005). In addition, a reverse relation between insulin sensitivity and triglyceride content has been observed in human skeletal muscle by biopsy (Pan et al. 1997), computed tomography (Goodpaster et al. 2000) and magnetic resonance spectroscopy (Virkamaki et al. 2001). Triglyceride level of the skeletal muscle has been considered as an important factor between insulin resistance in skeletal muscle and circulating FFA level in blood, and the suggested mechanism involves intra-myocellular increase of diacylglycerol, activation of myoplasmic long-chain fatty acyl CoA, or protein kinase C (Hegarty et al. 2003; Stannard et al. 2004).
In this investigation, we reported that GLUT-4 protein contents were not significantly different among the L/GH, H/GH and CON groups. In the previous study, GLUT-4 protein was considered to be the most important protein of glucose uptake in skeletal muscle, and GLUT-4 content protein was strongly related to the rate of glucose uptake in skeletal muscle incubation (Henriksen et al. 1990). Thus, any reduction in the rate of glucose transport in high GH-treated rats could seem to require a decrease in GLUT-4 contents of muscle. But, in this study, no reduction of muscle GLUT-4 contents was observed in the high GH-treated rats. This observation suggests that the deflection in the insulin signaling pathway appeared prior to the process of GLUT-4 translocation. This observation is consistent with the previous report that GLUT-4 contents in muscle were unaltered in GH-injected rats (Hou et al. 2003), and supports the result that alterations of GLUT-4 contents in muscle may not be responsible for the deterioration of insulin-mediated glucose uptake in high-dose GH-injected rats.
It is reasonable that high-dose GH-injected rats only appear the deterioration of muscle insulin resistance of rats due to increased muscle triglyceride and ceramide contents. Increase in plasma FFA concentrations due to high GH treatment develops the elevation of intramuscular triglyceride content. Increased muscle triglyceride and ceramide contents are responsible for the deterioration of insulin resistance in skeletal muscle of rats. Our results in this investigation also observed that reduced glucose transport rate in the high GH-treated rats occurred without the significant change in GLUT-4 protein content, and was directly related to the triglyceride and ceramide contents of the skeletal muscle in rats. To our knowledge, a significant finding of the current study is that this would be the first observation to particularly examine the association among muscle triglyceride level, muscle ceramide content and glucose transport rate after the different dosage of GH administration. The current investigation is well designed to eliminate all possible confounding influences using a randomized control design. Further investigations could be necessary to examine our findings in humans.
In conclusion, we found that the elevation of muscle insulin resistance due to GH treatment is strongly associated with the dosage of GH administration in rats. In addition, the contributing factor for insulin resistance in skeletal muscle might be that GH treatment elevates triglyceride content and ceramide level in skeletal muscle, and an increased triglyceride and ceramide contents are positively related to the insulin resistance of muscle in rats.
Acknowledgement
This project was financially supported by the National Research Foundation of Korea Grant funded by the Korean Government (NRF-2014 S1 A5 B5 A07042269).
Conflict of Interest
There is no conflict interest.
References
- Binnerts A., Swart G. R., Wilson J. H., Hoogerbrugge N., Pols H. A., Birkenhager J. C & Lamberts S. W. The effect of growth hormone administration in growth hormone deficient adults on bone, protein, carbohydrate and lipid homeostasis, as well as on body composition. Clin Endocrinol (Oxf). 1992;37(1):79-87.
CrossRef - Boden G. Effects of free fatty acids (FFA) on glucose metabolism: significance for insulin resistance and type 2 diabetes. Exp Clin Endocrinol Diabetes. 2003;111(3): 121-124.
CrossRef - Boden G & Shulman G. I. Free fatty acids in obesity and type 2 diabetes: defining their role in the development of insulin resistance and beta-cell dysfunction. Eur J Clin Invest. 2002;32(3)14-23.
- Bramnert M., Segerlantz M., Laurila E., Daugaard J. R., Manhem P & Groop L. Growth hormone replacement therapy induces insulin resistance by activating the glucose-fatty acid cycle. J Clin Endocrinol Metab. 2003;88(4):1455-1463.
CrossRef - Burton A. F & Anderson F. H. Increased cholesteryl ester content in liver of mice fed lipid emulsion diets high in polyunsaturated fats. JPEN J Parenter Enteral Nutr. 1985;9(4):480-482.
CrossRef - Cartee G. D & Bohn E. E. Growth hormone reduces glucose transport but not GLUT-1 or GLUT-4 in adult and old rats. Am J Physiol. 1995;268(5 Pt 1):E902-909.
CrossRef - Chrisoulidou A., Beshyah S. A., Rutherford O., Spinks T. J., Mayet J., Kyd P., Anyaoku V., Haida A., Ariff B., Murphy M., Thomas E., Robinson S., Foale R & Johnston D. G. Effects of 7 years of growth hormone replacement therapy in hypopituitary adults. J Clin Endocrinol Metab. 2000;85(10):3762-3769.
CrossRef - Christopher M., Hew F. L., Oakley M., Rantzau C & Alford F. Defects of insulin action and skeletal muscle glucose metabolism in growth hormone-deficient adults persist after 24 months of recombinant human growth hormone therapy. J Clin Endocrinol Metab. 1998;83(5):1668-1681.
- Doga M., Bonadonna S., Gola M., Mazziotti G & Giustina A. Growth hormone deficiency in the adult. Pituitary. 2006;9(4):305-311.
CrossRef - Goodpaster B. H., Thaete F. L & Kelley D. E. Thigh adipose tissue distribution is associated with insulin resistance in obesity and in type 2 diabetes mellitus. Am J Clin Nutr. 2000;71(4):885-892.
- Groop L., Segerlantz M & Bramnert M. Insulin sensitivity in adults with growth hormone deficiency and effect of growth hormone treatment. Horm Res. 2005;64(3):45-50.
- Hegarty B. D., Cooney G. J., Kraegen E. W & Furler S. M. Increased efficiency of fatty acid uptake contributes to lipid accumulation in skeletal muscle of high fat-fed insulin-resistant rats. Diabetes. 2002;51(5):1477-1484.
CrossRef - Hegarty B. D., Furler S. M., Ye J., Cooney G. J & Kraegen E. W. The role of intramuscular lipid in insulin resistance. Acta Physiol Scand. 2003;178(4):373-383.
CrossRef - Henriksen E. J., Bourey R. E., Rodnick K. J., Koranyi L., Permutt M. A & Holloszy J. O. Glucose transporter protein content and glucose transport capacity in rat skeletal muscles. Am J Physiol. 1990;259(4 Pt 1):593-598.
CrossRef - Henwood M. J., Grimberg A & Moshang T. Jr. Expanded spectrum of recombinant human growth hormone therapy. Curr Opin Pediatr. 2002;14(4): 437-442.
CrossRef - Hou C. W., Chou S. W., Ho H. Y., Lee W. C., Lin C. H & Kuo C. H. Interactive effect of exercise training and growth hormone administration on glucose tolerance and muscle GLUT4 protein expression in rats. J Biomed Sci. 2003;10(6 Pt 2):689-696.
CrossRef - Ivy J. L., Zderic T. W & Fogt D. L. Prevention and treatment of non-insulin-dependent diabetes mellitus. Exerc Sport Sci Rev. 1999;27:1-35.
- Jessen N., Djurhuus C. B., Jorgensen J. O., Jensen L. S., Moller N., Lund S & Schmitz O. Evidence against a role for insulin-signaling proteins PI 3-kinase and Akt in insulin resistance in human skeletal muscle induced by short-term GH infusion. Am J Physiol Endocrinol Metab. 2005;288(1):194-199.
CrossRef - Johansen T., Richelsen B., Hansen H. S., Din N & Malmlof K. Growth hormone-mediated breakdown of body fat: effects of GH on lipases in adipose tissue and skeletal muscle of old rats fed different diets. Horm Metab Res. 2003;35(4):243-250.
CrossRef - Jorgensen J. O., Krag M., Jessen N., Norrelund H., Vestergaard E. T., Moller N & Christiansen J. S. Growth hormone and glucose homeostasis. Horm Res. 2004;62(3)(51-55.
- Jung H. L., & Kang H. Y. Effects of endurance exercise and high-fat diet on insulin resistance and ceramide contents of skeletal muscle in sprague-dawley rats. Korean Diabetes J. 2010;34(4):244-252.
CrossRef - Kawano Y., Rincon J., Soler A., Ryder J. W., Nolte L. A., Zierath J. R & Wallberg-Henriksson H. Changes in glucose transport and protein kinase Cbeta(2) in rat skeletal muscle induced by hyperglycaemia. Diabetologia. 1999;42(9):1071-1079.
CrossRef - Kim J. K., Choi, C. S., & Youn, J. H. Acute effect of growth hormone to induce peripheral insulin resistance is independent of FFA and insulin levels in rats. Am J Physiol. 1999; 277(4 Pt 1): E742-749.
CrossRef - Krag M. B., Gormsen L. C., Guo Z., Christiansen J. S., Jensen M. D., Nielsen S & Jorgensen J. O. Growth hormone-induced insulin resistance is associated with increased intramyocellular triglyceride content but unaltered VLDL-triglyceride kinetics. Am J Physiol Endocrinol Metab. 2007;292(3):E920-927.
CrossRef - Louveau I., & Gondret F. Regulation of development and metabolism of adipose tissue by growth hormone and the insulin-like growth factor system. Domest Anim Endocrinol. 2004;27(3):241-255.
CrossRef - McGarry J. D. Banting lecture 2001: dysregulation of fatty acid metabolism in the etiology of type 2 diabetes. Diabetes. 2002;51(1):7-18.
CrossRef - Moller N., Gjedsted J., Gormsen L., Fuglsang J & Djurhuus C. Effects of growth hormone on lipid metabolism in humans. Growth Horm IGF Res. 2003;13:18-21.
- Morgan C. R & Lazarow A. Immunoassay of insulin using a two-antibody system. Proc Soc Exp Biol Med. 1962;110:29-32.
- Ng S. F., Storlien L. H., Kraegen E. W., Stuart M. C., Chapman G. E & Lazarus L. Effect of biosynthetic human growth hormone on insulin action in individual tissues of the rat in vivo. Metabolism. 1990;39(3):264-268.
CrossRef - Noma A., Okabe H & Kita M. Determination of serum cholinesterase activity by means of automatic titration. Rinsho Byori. 1973;21(5):457-460.
- Pan, D. A., Lillioja, S., Kriketos, A. D., Milner, M. R., Baur, L. A., Bogardus, C., Jenkins, A. B., & Storlien, L. H. Skeletal muscle triglyceride levels are inversely related to insulin action. Diabetes. 1997; 46(6): 983-988.
CrossRef - Park, M. J., Jung, S. R., Jung, H. L., Craig, B. W., Lee, C. D., & Kang, H. Y. Effects of 4 weeks recombinant human growth hormone administration on insulin resistance of skeletal muscle in rats. Yonsei Med J. 2008; 49(6): 1008-1016.
CrossRef - Randle, P. J., Garland, P. B., Hales, C. N., & Newsholme, E. A. The glucose fatty-acid cycle. Its role in insulin sensitivity and the metabolic disturbances of diabetes mellitus. Lancet. 1963; 1(7285): 785-789.
CrossRef - Reynolds, C. M., Li, M., Gray, C., & Vickers, M. H. Preweaning growth hormone treatment ameliorates adipose tissue insulin resistance and inflammation in adult male offspring following maternal undernutrition. Endocrinology. 2013; 154(8): 2676-2686.
CrossRef - Richelsen, B. Effect of growth hormone on adipose tissue and skeletal muscle lipoprotein lipase activity in humans. J Endocrinol Invest. 1999; 22(5 Suppl): 10-15.
- Schmitz-Peiffer, C., Craig, D. L., & Biden, T. J. Ceramide generation is sufficient to account for the inhibition of the insulin-stimulated PKB pathway in C2C12 skeletal muscle cells pretreated with palmitate. J Biol Chem. 1999; 274(34): 24202-24210.
CrossRef - Segerlantz, M., Bramnert, M., Manhem, P., Laurila, E., & Groop, L. C. Inhibition of lipolysis during acute GH exposure increases insulin sensitivity in previously untreated GH-deficient adults. Eur J Endocrinol. 2003; 149(6): 511-519.
CrossRef - Stannard, S. R., & Johnson, N. A. Insulin resistance and elevated triglyceride in muscle: more important for survival than “thrifty” genes? J Physiol. 2004; 554(Pt 3): 595-607.
CrossRef - Straczkowski, M., Kowalska, I., Baranowski, M., Nikolajuk, A., Otziomek, E., Zabielski, P., Adamska, A., Blachnio, A., Gorski, J., & Gorska, M. Increased skeletal muscle ceramide level in men at risk of developing type 2 diabetes. Diabetologia. 2007; 50(11): 2366-2373.
CrossRef - Summers, S. A. Ceramides in insulin resistance and lipotoxicity. Prog Lipid Res. 2006; 45(1): 42-72.
CrossRef - Summers, S. A., Garza, L. A., Zhou, H., & Birnbaum, M. J. Regulation of insulin-stimulated glucose transporter GLUT4 translocation and Akt kinase activity by ceramide. Mol Cell Biol. 1998; 18(9): 5457-5464.
CrossRef - Virkamaki, A., Korsheninnikova, E., Seppala-Lindroos, A., Vehkavaara, S., Goto, T., Halavaara, J., Hakkinen, A. M., & Yki-Jarvinen, H. Intramyocellular lipid is associated with resistance to in vivo insulin actions on glucose uptake, antilipolysis, and early insulin signaling pathways in human skeletal muscle. Diabetes. 2001; 50(10): 2337-2343.
CrossRef - Woodhouse, L. J., Mukherjee, A., Shalet, S. M., & Ezzat, S. The influence of growth hormone status on physical impairments, functional limitations, and health-related quality of life in adults. Endocr Rev. 2006; 27(3): 287-317.
CrossRef - Yip, R. G., & Goodman, H. M. Growth hormone and dexamethasone stimulate lipolysis and activate adenylyl cyclase in rat adipocytes by selectively shifting Gi alpha2 to lower density membrane fractions. Endocrinology. 1999; 140(3): 1219-1227.
CrossRef - Young, J. C., & Balon, T. W. Role of dihydropyridine sensitive calcium channels in glucose transport in skeletal muscle. Life Sci. 1997; 61(3): 335-342.
CrossRef - Yuen, K. C., Roberts, C. T., Jr., Frystyk, J., Rooney, W. D., Pollaro, J. R., Klopfenstein, B. J., & Purnell, J. Q. Short-term, low-dose GH therapy improves insulin sensitivity without modifying cortisol metabolism and ectopic fat accumulation in adults with GH deficiency. J Clin Endocrinol Metab. 2014; 99(10): E1862-1869.
CrossRef - Zisman, A., Peroni, O. D., Abel, E. D., Michael, M. D., Mauvais-Jarvis, F., Lowell, B. B., Wojtaszewski, J. F., Hirshman, M. F., Virkamaki, A., Goodyear, L. J., Kahn, C. R., & Kahn, B. B. Targeted disruption of the glucose transporter 4 selectively in muscle causes insulin resistance and glucose intolerance. Nat Med. 2000; 6(8): 924-928.
CrossRef

