
Manuscript accepted on :October 09, 2017
Published online on: --
K. Mohanavelu1,2 , R. Lamshe1, S. Poonguzhali1, K. Adalarasu3 and M. Jagannath4
1Department of ECE, College of Engineering, Guindy, Anna University, Chennai, Tamil Nadu, India.
2Defence Bio-Engineering and Electromedical Laboratory (DEBEL), DRDO, Bangalore, Karnataka, India.
3School of Electrical and Electronics Engineering, SASTRA University, Tanjore, Tamil Nadu, India.
4School of Electronics Engineering, VIT University Chennai, Tamil Nadu, India.
Corresponding Author E-mail: mohanvelk@debel.drdo.in
DOI : https://dx.doi.org/10.13005/bpj/1308
Abstract
Fatigue is a major safety concern for personnel in many fields which includes aviation & military personnel, astronauts, drivers, doctors, industrial workers, computer users, etc. Assessing human fatigue is essential for enhancing capability of the individual at work, thereby accomplishing more work efficiency and also ensuring the safety of individual. The survey reviews the various techniques that have been used to measure and recognize the fatigue in a person. Experts in research community have investigated human fatigue using various features of the physiological signals. The several physiological signals like Blood Volume Pulse (BVP), Electromyogram (EMG), Galvanic Skin Response (GSR), Electrocardiogram (ECG), and Respiratory signals are investigated to detect the stress and fatigue of a person. It also discusses various classification techniques that have been used by researchers to identify the fatigue in a person. This work presents a comprehensive survey of fatigue and stress detection using various physiological signals. Furthermore, it also aims to find the most appropriate features and techniques to efficiently assess human stress and fatigue.
Keywords
Classification Techniques Fatigue; Physiological Signals;
Download this article as:| Copy the following to cite this article: Mohanavelu K, Lamshe R, Poonguzhali S, Adalarasu K, Jagannath M. Assessment of Human Fatigue during Physical Performance using Physiological Signals: A Review. Biomed Pharmacol J 2017;10(4). |
| Copy the following to cite this URL: Mohanavelu K, Lamshe R, Poonguzhali S, Adalarasu K, Jagannath M. Assessment of Human Fatigue during Physical Performance using Physiological Signals: A Review. Biomed Pharmacol J 2017;10(4). Available from: http://biomedpharmajournal.org/?p=17377 |
Introduction
The term ‘fatigue’ describes a state of being tired and weak. According to Med lexicon’s medical workbook, fatigue is a condition which followed by duration of psychological or bodily movement characterized by a minimized capability or stimulation for job.1 Moreover it is depicted by a reaction of tiredness, drowsiness, annoyance with small efficacy of skills. The impotence to continue working on a state of one person’s normal ability is the most common symptom of fatigue that delay in reaction times, and lack of communication among the surrounding environment and unable to schedule things based on priority. Many researchers have agreed that physical fatigue has leads to many health problems.
The causes of fatigue are many. Some of them are circadian rhythm disruption; type of work, the length of time spends at work, work environment, sleep debt, etc. Soldier’s combat stress reaction is an acute reaction caused due to the strain from battle which minimizes the combatant’s fighting efficacy. Fatigue due to sleep deprivation is common in car drivers1 and military service. There is also a high accident rate of f UCAVs (Unmanned Combat Aerial Vehicles) because of hypo vigilance of UCAV operators caused by stress and fatigue. Pilot fatigue is a major cause of most aviation crashes. The 21% of all noted cases in Aviation Safety Reporting System (ASRS) are fatigue-related incidents. Fatigue reduces the functional capability of astronauts, who need to perform mission-critical tasks. Mental sluggishness caused by fatigue in drivers can have disastrous consequences. Statistics shows that 20% of all fatal accidents are due to drivers with a low vigilance level.29 Fatigue among doctors and nurses impair their performance, thereby causing harm to the patients. Fatigue among computer users is a recognized problem. It can reduce their capability and hence it leads to reduced productivity. Finding clear and productive solutions to cop up with fatigue is very important. Continuous monitoring is one among them. Assessing fatigue is important for physiotherapists and psychologists to better understand about fatigue condition. This proper up-to-date detection of stress provides a useful way and helps doctors with more stable data for mediation and fatigue management.
Physiology of Stress
Stress is a phenomenon which brings together both the body and the mind.2,3 Prolonged stress can affect the internal state of the human system and can cause an imbalance in physiological processes of the human body.3 Both psychology and physiology is important to obtain basic knowledge about the stress. There are three body systems that are directly related with the physiology of stress although the effect of stress is reflected in most systems of the body. They are immune system, endocrine systems and nervous system. For a clear understanding of how physiological systems work under stress, a basic knowledge of physiology is needed.
The Central Nervous System (CNS) and Peripheral Nervous System (PNS) are the two nervous systems in the body. Brain and spinal cord included as a part of CNS whereas all neural routes to the extremities comprised by PNS. Three levels of human brain: the vegetative level, neocortical level and the limbic system.
The lowest level, the vegetative level, is responsible for the reticular formation and the brain pedicle. The association between the brain and the spinal cord is given by the reticular pattern. The pons, the medulla oblongata and the mesencephalon contained by the brain pedicle. The involuntary actions such as heart beat and respiration are controlled by the brain stem.
The mid-level, the limbic system, is the emotional stress control center. The thalamus, the hypothalamus, the amygdale and the pituitary gland are contained by the limbic system. These glands help to keep the equilibrium within the body. The tissue centers in the limbic system create the biochemical chain of events. These chains of events constitute the stress response.
The highest level, the neocortex level, is responsible for thought processes. The PNS is divided into two functional divisions. They are somatic nervous system and Autonomic Nervous System (ANS). The sympathetic nervous systems and parasympathetic nervous systems are contained by the ANS. The sympathetic ANS nervous system is triggered by the stress alarm, this as a result releases noradrenaline (norepinephrine) and the production of adrenaline by the adrenaline glands is stimulated. This in turn increases heart-rate (HR), arterial pressure and breathing rhythm.
Figure 1 depicts the stress response that occurs on the human body. If the stress inducing factor still continues, the Hypothalamic-Pituitary-Adrenal (HPA) axis is activated by the brain’s limbic structures activates. The Corticotrophin-Releasing Factor (CRF) is produced by the hypothalamus. CRF produces an impact on the pituitary gland, and makes it to release Adrenocorticotropic Hormone (ACTH). Adrenocorticotropic hormone causes adrenal glands to discharge corticosteroids. The corticosteroids are the glucocorticoids especially the cortisol and the mineralocorticoids. The body’s cell fuel, glucose is released by the stimulation of theses hormones. All these hormones release self-regulates the stress. This forms a negative feedback loop, which helps the system from spiralling out.
If overused, however this self-regulation system can malfunction. Fatigue happens when body’s energy reserves run out. The human system gets into an uncontrolled state when stress last for a longer time.
Stress induces glucocorticoids that affects the cell and makes them sensitive. In order to avoid over-activation the cells react to these hormones by reducing their number of hormone receptors. This implies that glucocorticoids do not act in a feedback control and these hormones fight against immunity. This paves way to many types of disease.
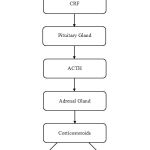 |
Figure 1: Stress Response.
|
Fatigue Indicators
Many researchers have analysed human stress and fatigue using physiological signals. Recognizing fatigue from the physiological signals is reliable. Physiological signals have been collected and analysed to find out the relative stress and strain level of a driver1,14 The physiological signals collected are Electrocardiogram (ECG), Electromyogram (EMG), Skin conductance (GSR), and respiratory signals. These signals were recorded continuously during real-world driving tasks. Data from 24 drivers were analysed with minimum 50 minute span. Five physiological sensors were used, an electromyogram sensor, an electrocardiogram sensor, two skin conductivity sensors and a respiration sensor. These sensors were established in the computer, posterior of the vehicle. There are two types of examination performed on the collected data.
Examination I used data with 5 minute span where drivers subjected to different levels of stress situations like low, medium and high for training a mechanical algorithm. Examination II obtained information on physiological feature’s relation with driver stress, calculated at 1 second intervals for whole period of drive.15 According to the results, drivers are most closely correlated with skin conductivity and heart-rate parameters.
Electrocardiogram
Electrocardiogram (ECG) is the process of obtaining potential electrical changes of the heart activities. It is very useful in the detection and diagnosis of tasks. Workload and heart-rate (HR) are directly proportional to each other whereas workload and heart-rate variability (HRV) are inversely proportional. The brain supplies with nerves to the heart via excitations from ANS.16 The sympathetic activity causes heart rate variability to increase while parasympathetic activity causes a decrease in it.28 The ANS system gets triggered when an individual undergoes strain. At that time, the parasympathetic system is abolished and the sympathetic nervous system is started. Thus epinephrine and norepinephrine get secreted to the blood stream. HR and HRV will initiated by the discharge of these hormones.
Extended stress, strain and fatigue lead to a chronic stimulation, workload and thereby causes consumption of the hormonal system, neural system and cardiovascular system. It is mainly due to the inadequate recovery and improvement. HR and HRV have been accepted by many researchers for the assessment of human fatigue.9 From ECG, features such as HR, HRV and mean amplitude can be extracted to analyze human fatigue. Stress and fatigue causes an increase in heart-rate, which can be measured from the RR interval.20 The measures of heart-rate variability can be measure in both time domain and frequency domain. Several time domain parameters are mean of HR and RR, then standard deviation of RR intervals, RMS of the difference between successive RR intervals, etc. The components that can be found from HRV power spectrum are a Low Frequency component (LF) that is negotiated by both the sympathetic nervous system and parasympathetic nervous system, then a component with High Frequency (HF) that is mediated by the parasympathetic nervous system, and a LF/HF ratio, an index of autonomic balance.17
Electromyogram
The fabrication of muscle force will cause small electrical currents to generate on muscle fibers. The exchange of ions and molecules will cause these currents across muscle fibers. By placing electrodes on the skin surfaces or into the muscle group, electromyogram (EMG) can be measured.26 Surface EMG which exists in practice is non-invasive method that gives minimal risk to the patient.9 Investigators found that physical workload can increase the electromyographic activity of the muscles. Stress causes the sympathetic nervous system to dominate. This sympathetic activity causes the releases of two hormones namely noradrenaline and adrenaline. These two hormones cause the blood vessels to massively irrigate the muscles and hence increase the electromyographic activity of the muscles. Researchers found from the result that EMG signals have higher amplitude and fewer intervals during stress compared to rest. The time-domain features that can be derived from EMG signal are mean and RMS amplitude of EMG, whereas the features in the frequency domain are mean frequency (MNF) and mean power and median frequency (MDF).31,12 At high frequencies there will be a reduction in power of signal all along the tiredness of muscles, and at low frequencies, a small increase in power of signal.32 The mean frequency and median frequency is affected by the number and firing rate of muscle motor units. But the geometry and force of muscles have a significant impact on MNF and MDF.4,8
Galvanic Skin Response
Electrodermal Activity (EDA), a galvanic skin response, is a degree of the dynamism of the skin. Eccrine glands (Sweat glands) are responsible for change in conductivity. It will cause GSR to happen. Eccrine glands are situated in the hands and feet. These sweat glands are responding to psychological and physiological stimulation rather than change in temperature. Galvanic skin response is a measure of both emotional and cognitive response10,30 activities. GSR measures an individual’s sweat levels measure is called GSR. It is calculated by obtaining the skin conductance. The sympathetic nervous systems will stimulate these glands. When the person is under stress the sympathetic nervous system gets activated. The sweat production will increase by this sympathetic activity, and also increases skin conductance.11 GSR is typically measured from hand fingers. The resistance of the skin decreases for a fatigue person. This is due to the increase in secretion of the sweat glands, which further increases the flow of electric current. The skin is an insulator and sweat is ionic. Sweat gland hustle is a measure of sympathetic activity. So when a person starts sweating, skin conducts electricity and skin conductivity increases as sweating continues. The features that are derived from GSR are amplitude, half-recovery time, energy of the response, latency and rise time. Since full recovery time is difficult to determine half recovery time is used.
Respiration
The respiration rate and volume of respiration used as indices to detect the fatigue and stress in a person. The volume of respiration measures the gas exchange of the lungs. The normal breathing rate is 12-20 breaths/minute. The distribution of oxygen and nutrient particles to essentially every organ is controlled by the Sympathetic Nervous System (SNS), which includes musculoskeletal system and the brain.22 SNS is called as “fight or flight” system, whereas PNS is called as “rest and digest” system. When an individual suffers from fatigue, the breathing rate increases compared with the normal rate. This is because the SNS is activated when an individual gets stressed out. Sympathetic activity causes the release of noradrenaline and stimulates the production of adrenaline. Breathing rhythm is increased by dilation of bronchial tubes and put the brain of the person in an increased state of alertness. Physical stress causes faster and deeper respiration whereas relaxation leads to slower respiration.
Blood Volume Pulse
The Photoplethysmographic (PPG) signal estimates the changes in blood volume and perfusion. The features of PPG signal are closely associated with features obtained from respiratory and cardiac rhythms. The reflected light from the blood is measured by the blood volume pulse. Blood volume increases with increasing stress. A change in blood volume is measured by the change in the reflection of light. The sympathetic nervous system gets into action when a person is stressed. And the production of noradrenaline and adrenaline gets stimulated by this SNS, which further causes the blood vessels to massively irrigate the muscles, brain and skin. This increase in blood flow during stress gets reflected in the PPG signal. The intensity of the reflected light decrease as the blood volume increases. Persons who are more fatigued have higher Blood Pressure (BP). BP is calculated from PPG signal as and denoted as a mathematical notation (Eq. (1)).
BP = (X * PP) – y (1)
where PP is the peak-to-peak interval between two peaks of PPG signal and x, y are calibration constants. To measure SpO2, light from LEDs at two different wavelengths are transmitted through the tissue. This method is followed based on the fact that deoxyhaemoglobin (Hb) has higher optical destruction in the red surface region than a combination of oxygen and haemoglobin (oxyhaemoglobin (HbO2)). In the infrared region, haemoglobin has low optical absorption. The DC and AC amplitudes in red and infrared PPG signals DCR, ACR, DCIR and ACIR, are to be extracted to find the normalized ratio, R. It is represented in (Eq. (2).

where K is the proportionality constant in (Eq. (3)). When a person is fatigued physically, there will be a reduction in blood oxygenation. Pulse rate is the number of peaks in a 60-second interval. As the person becomes more fatigue, the pulse rate increases. The features extracted from PPG signal for the analysis of physical fatigue are blood pressure (BP), blood oxygenation (SpO2) and pulse rate.
Besides these physiological signal parameters, some researchers have also recognized humans’ fatigue and stress using other physical measures such as body movement, gesture, pupil diameter, eye gaze, facial expression and voice. The summary of physiological signals and its features are represented in Table 1.
Table 1: Summary of physiological signals and its features.
| Physiological Signals | Features Extracted |
| ECG | HR, HRV |
| GSR | Amplitude, mean value, rising time, energy of the response |
| EMG | mean and RMS, amplitude, mean frequency, median frequency, no. of zero crossings, iEMG |
| Respiration | Amplitude, respiration rate |
| EEG | PSD of alpha, beta, gamma and delta waves |
| PPG | BP, SpO2, pulse rate |
Classification Techniques
Bayesian Network
Bayesian classifiers are based on Bayes’ theorem. It calculates class membership probability for the given sample. A sample is classified to a particular class based on the Maximum a Posteriori (MAP) decision rule. The class conditional independence assumptions were incorporated in Naive Bayes classifier. Naïve Bayes classifier has been used to classify the stress condition as “stress” and “normal”.18 Bayesian network is performed if dependent classes are present. A Bayesian network is characterized by directed acyclic graphs, which shows the joint conditional probability of the variables. A dynamic Bayesian network is performed to create a stress assessment model for computer user.34 Another recognition model has also been proposed for driver fatigue detection.30
Hidden Markov Model
The Markov model is a memory-less model, having conditional probability density of the future value depends only on the present value and not on any of the values preceded it in a process. A Markov chain is a sequence of random variables with the Markov property. These random variables represent the state of a system, in which the variables are time varying in nature. The difference between Markov chain and the Hidden Markov Model (HMM) is that the system is fully observable in Markov chain, whereas it is only partially observable in HMM. In driver fatigue detection, first order HMM is used to determine the dynamics of Bayesian network at various interval of time. The observation variables are ECG, EMG and eyelid closure, in which each variable has three different states. Whereas there is only one hidden variable, that contains two different conditions “Fatigue” and “Alertness”. An extended form of HMM has been proposed for fatigue detection based on stochastic switched autoregressive exogenous model.13
Decision Tree
The decision tree classifier technique is established using divide-and-conquer approach. It basically divides a complex system into a union of many small systems. A decision tree has leaf nodes, non-leaf nodes and branches. Each non-leaf node is combined with an attribute (feature), each leaf node with a classification and each branch with each one of the possible values of the feature at the node where the branch is directed from. To categorize a new sample, it is routed down the tree towards the leaf node. Along the path, at each non-leaf node the sample is tested against a criteria particular to that node. ID3 algorithm has been used to construct the decision tree to classify the state of stress.19 ID3 algorithm employs a top-down approach.
Support Vector Machines
An algorithm which is statistical in nature called as Support Vector Machine (SVM). An optimal hyper-plane is finding out which maximize the brim in between two sets of sample data. The support vectors are the vectors close to the optimal hyper-plane. These machine learning systems perform with a random space of linear functions. Models are characterized in a high dimensional feature region for classification. The feature space is created to have the separation of feature vectors of the training sample data and also to increase the distance of the discriminant function from the closest training set.33 By representing the input vectors to a different random feature region with specific mapping functions, nonlinear discriminant functions are allowed by SVM classifiers. These mapping functions are called kernel functions. SVM has been used to classify the affective states between “stress” and “relaxed”. SVM has also been adopted as a pattern classifier to recognize four different emotional states.21,24 Support vector regression (SVR) has been used to train the trend curves of three emotions such as “sadness”, “fear” and “pleasure”.5,6,7
Artificial Neural Networks
Artificial Neural Networks (ANN) are weighted directed graphs in which nodes can be considered as artificial neurons and connections as weighted edges between outputs and inputs. There are two classifications for ANNs as feed forward networks and feedback networks. Usually ANNs will perform tasks by using a learning process in the context in which network architecture and weights are updating regularly. The training patterns will give information on learning network weights. ANNs will regularly update the weights for an improved performance. Neural network has been used to monitor the stress level of a person.25
Fuzzy Logic Technique
Fuzzy logic is a conceptual logic that cannot be defined precisely. Fuzzy logic is used to compute “degrees of truth”. Membership functions characterize the fuzziness in a given set. The fuzzy set is defined by this membership function and decision purely depends upon the purpose. The subjective manner of this logic is the membership function. It will interpret desired values correctly. Membership functions can be symmetrical or asymmetrical.2
k-Nearest Neighbour
The k-Nearest neighbour (k-NN) technique is based on regression and classification. It is mainly for the classification of an unexplained sample on the multiples k of its nearest neighbours.27 The estimated class is calculated by choosing the costs of error rate. If it is equal for an unknown sample then it is most commonly represented in the collection of its k nearest neighbours.3
Fisher’s Linear Discriminant
This analysis follows an experiential technique for classification based on attribute vectors. The main idea of fisher’s LDA is to find projection to a line such that samples from different classes are well separated. A stress detection system has been proposed based on Fisher’s LDA.3
Some researchers have used two or more classification techniques in an attempt to find the better classifier which gives maximum accuracy. A hybrid technique such as fuzzy-ART has also been used to detect negative emotions.23 This technique combines fuzzy logic with ANN. The summary of fatigue and stress detection is explained in Table 2.
Table 2: Summary of fatigue and stress detection.
| Input Features | Classification Technique | Inference |
| RR interval, HRV, ST | SVM | 3 emotional states such as sadness, anger and stress are recognized.
Classification accuracy is 78.43% |
| GSR, BVP, ST | SVM | Classifies between normal and stress states with an accuracy of 90.10% |
| Mean and SD of R-R interval, PSD of alpha, beta and delta rhythms | SVM | Recognizes different levels of human fatigue |
| GSR, HR | Fuzzy Logic | Recognizes human stress with only two physiological signals |
| ECG, GSR, BVP | SVR | 3 emotional states such as sadness, stress & fear are recognized with an accuracy of 89.2% |
| ECG, GSR, Respiration amplitude, ST | SVM | Emotional states such as stress, fear, sadness and joy are recognized |
| ECG, EMG, EDA, Respiration | SVM & ANFIS | Emotional states are recognized with a an accuracy of 79.3% for SVM and 76.7% for ANFIS |
| GSR, HR | k-NN & Fisher’s LDA | Recognizes human stress |
| GSR, BVP, ST | Naïve Bayes | Classifies stress and normal state with an accuracy of 78.65% |
| GSR, BVP, ST | Decision Tree | Distinguishes between stressed and relaxed state with an accuracy of 88.02% |
| GSR, PPG | ANN | Recognizes stress accurately |
| EMG | HMM | Recognizes human fatigue using only EMG signal |
| HR, GSR, ST, finger pressure | DBN | A system to infer stress is developed |
| GSR, HR, RR | Fuzzy-ART | Detects negative emotions accurately |
Summary and Conclusion
Human fatigue has been a major problem, affecting both individuals and society. From the analysis, it is observed that a promising correlation exists between physiological signals and fatigue. For real- time fatigue detection, it is difficult to collect many physiological signals. So of all, only the most appropriate signals are selected. Of all the physiological signals, ECG and GSR have found to be more accurate to predict the fatigue and stress in a person. In general, classification methods like support vendor machine and artificial neural network are widely used to model the fatigue and stress of a person.
The study reveals that the physiological signals such as ECG and GSR are the best indicators to analyze the stress of a person. The features of ECG such as heart-rate and heart-rate variability are very good indicators of stress, since SNS causes a tremendous change in cardiac output and heart beat rhythm during stress compared to relaxed state. The skin conductivity from the GSR signal is also a good indicator of stress. The secretion of hormones stimulated by the SNS during stress causes a notable increase in skin conductivity of the person. Although a number of classification techniques can be used to classify the stress condition of a person, the study comes up with the idea that the classification techniques such as SVM and ANN are very good in detecting the stress and fatigue of a person. This is because the study reveals that most researchers who have used SVM and ANN classifiers have achieved higher classification accuracy compared with those who have used other classifiers.
Based on the survey done on this topic, most researchers have classified the physical stress as “fatigue” or “normal”. However detecting the level of fatigue as “high”, “moderate” and “low” will help the doctors and psychologists to assess and estimate the level of fatigue and thereby to provide appropriate fatigue management, i.e., the person who is identified with “high” fatigue needs immediate attention than the one with “ moderate” fatigue. Hence future work can be focused on classifying the level of fatigue in a person. Besides these physiological signals, physical measures such as face expression, eye gaze are also some good indicators of fatigue. Most researchers have tried to detect the stress and fatigue with either physical measures or physiological measures separately. But combining these two categories (physical and physiological) of features may help in improving the accuracy of detection. So future work can be done to recognize stress by combining both these categories. Also most of the systems that have been developed so far on fatigue and stress detection are user-dependent. The system developed can be able to detect the fatigue in a single person, for whom it is developed. It will be more helpful to the society, if a user-independent system is developed.
Acknowledgment
Authors would like to express their sincere thanks of gratitude to all researchers those who have contributed their work in the scientific community.
Conflict of Interest
There is no conflict of interest
References
- Akbas A. Evaluation of the physiological data indicating the dynamic stress level of. Scientific Research and Essays. 2011;6(2):430-439.
- de Sierra S, Avila C.S, Casanova J.G, del Pozo G.B. A stress-detection system based on physiological signals and fuzzy logic. IEEE Transactions on Industrial Electronics. 2011;58(10):4857-4865.
CrossRef - de Sierra S , Avila C.S, Casanova J.G, del Pozo G.B. Real-time stress detection by means of physiological signals. Recent Application in Biometrics. Jucheng Yang (Ed). InTech. 2011.
- Geethanjali B, Adalarasu K. Assessment of depression, anxiety and stress among female students. International Journal of Biomedical Engineering and Technology. 2014;16(2):182-193.
CrossRef - Katsis D, Katertsidis N, Ganiatsas, G, Fotiadis D.I. Toward emotion recognition in car- racing drivers: a bio signal processing approach. IEEE Transactions on Systems, Man, and Cybernetics Part A: Systems and Humans. 2008;38(3):502-512.
CrossRef - Chang C.Y, Chang C.W, Zheng J.Y, Chung P.C. Physiological emotion analysis using support vector regression. Neuro computing. 2013;122:79-87.
CrossRef - Bishop M. Pattern Recognition and Machine Learning. Springer Publications. 2006.
- Kukolja D, Popovic S, Horvat M, Kovac B, Ćosic K. Comparative analysis of emotion estimation methods based on physiological measurements for real-time applications. International Journal of Human- Computer Studies. 2014;72:717-727.
CrossRef - Vavrinsky E, Stopjakova V, Majer L. Electrical biomonitoring towards mobile diagnostics of human stress influence. IEEE Conference on Applied Sciences in Biomedical and Communication Technologies. 2009:1-6.
CrossRef - Vavrinsky E, Stopjakova V, Brezina I, Majer L, Solarikov P, Tvarozek V. Electro- optical monitoring and analysis of human cognitive processes. IEEE Conference on Advanced semiconductor Devices and Microsystems. 2008:279-282.
- Sun F.T, Kuo C, Tze-Cheng H, Buthpitiya S, Collins P. Activity-Aware mental stress detection using physiological sensors. Lecture Notes of the Institute for Computer Sciences, Social Informatics, and Telecommunication Engineering. 2012;26:211-230.
CrossRef - Naik R. Computational Intelligence in Electromyography Analysis – A Perspective on Current Applications and Future Challenges. InTech. 2012.
CrossRef - Okuda H, Kometani F, Inagaki S, Suzuki T. Fatigue recognition using EMG signals and stochastic switched ARX model. IEEE Transactions on Electrical and Electronic Engineering. 2012;7:574-582.
CrossRef - Wijsman J, Grundlehner B, Liu H, Hermens H, Pender J. Towards mental stress detection using wearable physiological sensors. 33rd Annual International Conference of the IEEE EMBS. 2011:1798-1801.
- Healey J.A, Picard R.W. Detecting stress during real-world driving tasks using physiological sensors. IEEE Transactions on Intelligent Transportation Systems. 2015;6(2):156-166.
CrossRef - Jerrita S, Murugappan M, Wan K, Yaacob S. Classification of emotional states from electrocardiogram signals: a non-linear approach based on hurst. Bio Medical Engineering On Line. 2013;12-44.
- Taelman J, Vandeput S, Spaepen A, Van Hauffel S. Influence of mental stress on heart rate and heart rate variability. Proceedings of the 4th European Conference of the International Federation for Medical and Biological Engineering. 2009;22:1366-1369.
CrossRef - Zhai J, Barreto A, Chin C, Chao L. Stress detection in computer users based on digital signal processing of noninvasive physiological variables. 28th IEEE EMBS Annual International Conference, USA. 2006:1355-359.
CrossRef - Zhai J, Barreto A. Stress detection in computer users through non-invasive monitoring of physiological signals. Biomedical Science Instrumentation. 2006;42:495-500.
- Shiwu L, Linhong W, Zhifa Y. An active driver fatigue identification technique using multiple physiological features. International Conference on Mechatronic Science, Electrical Engineering and Computer. 2011:19-22.
CrossRef - Kim L.H, Bang S.W. Emotion recognition system using short-term monitoring of physiological signals. Medical & Biological Engineering & Computing. 2014;42:419-427.
CrossRef - Monajati M, Abbasi S.H, Shabaninia F, Shamekh S. Emotions states recognition based on physiological parameters by employing of fuzzy-adaptive resonance theory. International Journal of Intelligence Science. 2012;2:166-175.
CrossRef - Sokolova M. A systematic analysis of performance measures for classification tasks. Information Processing and Management. 2009;45:427–437.
CrossRef - Soleymani M, Lichtenauer J, Pun T. A multimodal database for affect recognition and implicit tagging. IEEE transactions on Affective Computing. 2012;3(1):42-55.
CrossRef - Subramanian M, Kanishkan V, Venkatesan P, Vivek S, Maheswari U.S. Psychological stress monitoring and reporting system for industries. Texas Instruments India Educators’ Conference. 2013:107-113.
- Karthikeyan P, Murugappan M, Yaacob S. EMG signal based human stress level classification using wavelet packet transform. Trends in Intelligent Robotics. Automation, and Manufacturing Communications in Computer and Information Science. 2012;330:236-243.
CrossRef - Karthikeyan P, Murugappan M, Yaacob S. Multiple physiological signal-based human stress identification using non-linear classifiers. Elektronika ir Elektrotechnika. 2013;19(7):1392-1215.
- Begum S, Ahmed M.U, Funk P. ECG sensor signal analysis to represent cases in a case-based stress diagnosis system. 10th IEEE International Conference on Information Technology and Applications in Biomedicine. 2010:193-198.
CrossRef - Gopalakrishnan S. A public health perspective of road traffic accidents. Journal of Family Medicine and Primary Care. 2011;1:144-150.
CrossRef - Balasubramanian V, Adalarasu K, Gupta A. EEG based analysis of cognitive fatigue during simulated driving. International Journal of Industrial and Systems Engineering. 2011;7(2):13-149.
CrossRef - Balasubramanian V, Adalarasu K. EMG based analysis of change in muscle activity during simulated driving. Journal of Bodywork and Movement Therapies. 2011;11(2):151-158.
CrossRef - Balasubramanian V, Jagannath M, Adalarasu K. Muscle fatigue based evaluation of bicycle design. Applied Ergonomics. 2014;45(2):339-345.
CrossRef - Lin Y.M, Chang C.Y, Zheng J.Y. Physiological angry emotion detection using support vector regression. 15th International Conference on Network-Based Information Systems. 2012:592-597.
- Liao W, Zhang W, Zhu Z, Ji Q. A real-time human stress monitoring system using dynamic Bayesian network. Proceedings of the IEEE Computer Society Conference on Computer Vision and Pattern Recognition. 2005.

