
Manuscript accepted on :July 11, 2017
Published online on: --
Plagiarism Check: Yes
G. Mohandass1, R. Ananda Natarajan2 and S. Sendilvelan3
1Biomedical Department, Sathyabama University, Chennai- 600119.
2Department of Electronic and Instrumentation Engineering, Pondicherry Engineering College, Puducherry.
3Department of Mechanical Engineering, Dr.M.G.R. Educational and Research Institute, University, Chennai-600095.
Corresponding Author E-mail: sendilvelan.mech@drmgrdu.ac.in
DOI : https://dx.doi.org/10.13005/bpj/1269
Abstract
Optical Coherence Tomography (OCT) imaging technique is a precise and prominent approach in retinal diagnosis on layers level. The pathological effect in retina, challenges a computational segmented approach in the boundary layer level for evaluating and identification of defect. The segmentation of layers and boundary edging process is misguided by the noise in the computation method. In these criteria, a novel algorithm of segmentation with the base of denoising techniques is required. In this work, Robust Outlyingness Ratio (ROR) algorithm is a noise detective operation which is applied in edge direction with gradient deformable contour model for layers detection. This Boisterous Obscure Ratio (BOR) computation procedure is derived. BOR is an image segmentation process with connectivity of eight formed layers in retinal SD-OCT images. The validation is done by comparing with the prior demonstration method. The highlighting feature of the BOR method is that it is time consuming and the results produced are highly substantial and effective.
Keywords
Image Analysis; Image Detection Systems; Noise in Imaging Systems; Optical Coherence Tomography; Ophthalmology Transforms;
Download this article as:| Copy the following to cite this article: Mohandass G, Natarajan R. A, Sendilvelan S. Retinal Layer Segmentation in Pathological SD-OCT Images Using Boisterous Obscure Ratio Approach and its Limitation. Biomed Pharmacol J 2017;10(3). |
| Copy the following to cite this URL: Mohandass G, Natarajan R. A, Sendilvelan S. Retinal Layer Segmentation in Pathological SD-OCT Images Using Boisterous Obscure Ratio Approach and its Limitation. Biomed Pharmacol J 2017;10(3). Available from: http://biomedpharmajournal.org/?p=16827 |
Introduction
Optical Coherent Tomography (OCT) is new revolution in imaging techniques of understanding and analysis of retina layer information. In retina layer segmentation is a challenging task in OCT images.1 In the complex structure and inhomogeneous inbuilt layers of retina may be better computational aid in determining the diagnosis procedure of OCT images. The challenges about the qualitative detection of retinal layer by automated image segmented approach with respective of normal or pathological images acquired by the different instruments.
The retinal layers are Retina Nerve Fiber Layer (RNFC); Ganglion Cell Layer and Inner Plexiform Layer (GCL + IPL); Inner Nuclear Layer (INL); Outer Plexiform Layer (OPL); Outer Nuclear Layer (ONL); Inner Segmentation and Outer Segmentation of Photo Receptor Layer with Junction; Retinal Pigment Epithelium Layer (RPE) and RPE Complex.2
Segmentation in OCT images gives the distinguish information of Photo Receptor Pigment Hyper reflective complex (HRC) layers and ganglion cell layer with inner Plexiform layer (GCL + IPL). Normal healthy labelled retinal structured layer is shown in the Figure 1.
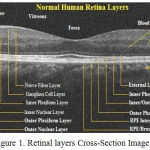 |
Figure 1: Retinal layers Cross-Section Image.
|
In the OCT segmentation methods, different automated and semi-automated algorithm is proposed.3 The efficiency of existing algorithm relies on the time parameter and identifying number of layers. OCT Retinal layers detection is applied mostly on threshold, global optimization, edge detection operators, K-means; Fuzzy C Means (FCM) and other pattern recognition techniques.4 For example pixel values with mild variations in intensity cannot be properly segmented by the traditional methods of image segmentation.5 Speckle noise affects the OCT images. The noise in the images disturbs the perfect identification of boundary in retina layers.6 The motion artifacts in OCT image, causes the detection failure in segmentation procedure.7
In this paper, segmentation method is derived in associate with denoising methods to improve the efficiency of the algorithm.8 Many segmentation procedures are pre-processed with filtering methods.9 On reviewing segmentation and denoising algorithms, Boisterous Obscure Ratio (BOR) segmentation method is proposed with the base of Robust Outlyingness Ratio (ROR) denoising technique.10
By BOR method, edge detection and contour transform a maximum of eight layers with partially formed one layer is obtained (Total of nine layers). To validation BOR method, pathological diseases image such as Choroidal Neovascular Membrane (CNVM), Full-Thickness Macular Hole (FTMH), Macular Edema (ME), Pigment Plaque (PR) and Pigment Epithelial Detachment-Multiple (PED) is taken for comparison purpose.11
Choroidal Neovascular Membrane (CNVM) is the abnormal growth of blood vessel in choroid layer. Full-Thickness Macular Hole (FTMH) is due to hole in full-central macular region and vision loss occurred. Macular Edema (ME) is diseases causes the fluid hole filled with collection of protein in the macular part. Pigment Plaque (PR) is abnormal and dislocate of plaque in RPE and retinal layers towards the pole of entity in anterior or posterior eye. Pigment Epithelial Detachment-Multiple (PED) is the separation of RPE and Bruch membrane in multiple aspects of the image.12 The pathological images are applied with the existing technique to determine the efficiency of the BOR method.
Image Segmentation and Computation Procedure
Methods of Computational segmentation Stages in retinal layer detection is explained as follows.
Boisterous Obscure Ratio Segmentation of Retinal Layer
In this computation process, BOR measures: How impulse like each pixel? Then assigns a value for all pixels based on it. The term ‘Impulse like’ refers to a sudden change in pixel value in examining a group of pixels. These BOR value assigned to the pixels based on impulses in it. These assigned values are called as the BOR value. Based on the obtained value the pixels are grouped and hence this technique is used for segmentation of retina images. This method assigns values for pixels by taking median of the image to be segmented. BOR method uses threshold value as 0.6457. This value is obtained by standard normal random variables. The algorithm behind BOR segmentation is given below.
Retinal Image Contour
Next is the Contour transform is applied to image will portray the image with frequency variations.13-15 The part of image with varying intensity will be represented in segments output respectively. This contour transform is applied to BOR image so that the intensity variations in the image can be viewed.16-19
Contour Transform
Contour transform is applied to images to differentiate the frequencies in it and show the variations as shown in Figure 2 and 3.
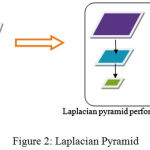 |
Figure 2: Laplacian Pyramid
|
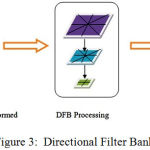 |
Figure 3: Directional Filter Bank
|
Results and Analysis
In output of computation implementation in the various stage of approach i.e., segmentation of retinal image; Retinal Image contour; Retinal image edge; Representing boundaries for layers: Based on Edge Detection and Based on Image Contour; Connecting Discontinuities is shown in the Figure 4.
All the image is processed and comparative analyzation is done in MATLAB R2013a with the system capability of Intel Core i5 CPU; M 80 2.6GHz; RAM: 4.00 GB; System Type: 64-bit Operating system. The segmentation procedure is computed and analysed with normal health eye OCT image of figure 4A. This is obtained in imaging system of Cirrus HD – SD-OCT (Carl Zeiss), software version 5.1.1.4.
Figure 4B, is the retinal output of ROR segmentation image. The layers description is given in the red composite variations in the image. The segmented layers are retinal nerves fiber layer; GCL + IPL; INL and OPL+ONL; RPE and photoreceptor are formed. In Figure 4C, RNFL, Inner/Outer photo receptor layer and RPE/brunch’s membrane is formed. Partial and discontinuous edge is formed in layer of GCL, Plexiform Layer (Inner and outer); nuclear layer (inner and outer) is identified. Figure 4D, is output of edge identification in opacity of black and white. In Figure 4E, the pre-state output of segmented ROR is shown. This output does not give any layer identification information.
Figure 4F is the output of BOR edge overlay for layer detection process. RPE and photoreceptor layer with external limiting membrane is identified as single complex layer. Here, RNFL and ONL boundary lines are segmented. IPL boundary, most of intensity pixels is edge by BOR method.
Figure 4G, exhibit the line boundary is the contour output image by BOR segmented process. In Figure 4H, the discontinuous of the Nuclear and Plexiform layer are connected. The complex photoreceptor layer i.e., the RPE layer is connected. Five layers are formed. Three layers are discontinuous and partially layer lining is formed. Normally, intensity is higher in left side in comparison with the right side. The left side is liable to form ninth layers, i.e., distinguished part of GCL and IPL.
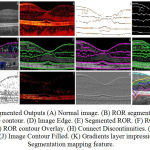 |
Figure 4: Segmented Outputs (A) Normal image. (B) ROR segmentation. (C) Image edge contour. (D) Image Edge.
|
(E) Segmented ROR. (F) ROR edge overlay. (G) ROR contour Overlay. (H) Connect Discontinuities. (I) Image Contour. (J) Image Contour Filled. (K) Gradients layer impression. (L) Segmentation mapping feature.
By this connectivity in figure 4H, nine boundary layer are formed, i.e., inclusive of temporal nerve fiber layer; RNFL; GCL + IPL (Right of fovea); IPL (Left side of Fovea); INL; OPL; ONL-IS; ONL-OS and RPE. This connectivity of nine layers inclusive of partially formed is shown in Figure 5.
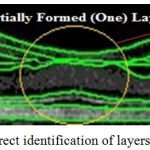 |
Figure 5: Correct identification of layers highlighted
|
This variation of IPL lining is due to the imaging system by manufacture software and Limitation in SDOCT image. Here, robust precision of layer in automated in not a guaranteed performance such that manual correction is done. Figure 4I, implies the output of Image gradient Contour. Figure 4J is the Image Contour with red composite color filled. Figure 4K is the retinal layer output of Gradients impression. Figure 4L is the output of feature mapping is lined in the initiation of fixed pixel values of different colour. For OCT segmentation, various techniques is analysed and outputs is given in Figure 4I –4L.
Validate by Comparison
The results of the proposed and existing method are compared.20 The similarity is founded with the tool used (MatLab) and SD-OCT imaging system. The comparison is analysed on the time parameter and boundary layer identified. To study BOR and existing methods, five pathological images (CNVM, FTMH, ME, PR and PED) are taken for validation.
The original taken image and output of BOR segmented method is given in the Figure 6. The code of the existing method is taken from, web link and it is redirect to download in second web link which is called as Caserel Master Tool. The time consumed and layer formed in BOR algorithm is appreciable and it is for good than the existing method. In general; layer detection is comparatively good by analysing these pathological images for BOR computation process. The time consumed in BOR is fascinating when comparing with the existing method. In the normal retinal image, existing algorithm consumed a time period of 1.3475 seconds (Inclusive of Caserel Master Tool) whereas the proposed algorithm takes 2.19 seconds to excite the code. The pathological effect causes the structural changes in retinal layers. This structural change in the retinal images causes the intensity changes and variation in layer detection.
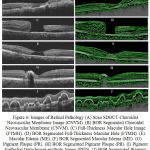 |
Figure 6: Images of Retinal Pathology (A) Scan SDOCT Choroidal Neovascular Membrane Image (CNVM).
|
(B) BOR Segmented Choroidal Neovascular Membrane (CNVM). (C) Full-Thickness Macular Hole Image (FTMH). (D) BOR Segmented Full-Thickness Macular Hole (FTMH). (E) Macular Edema (ME). (F) BOR Segmented Macular Edema (ME). (G) Pigment Plaque (PR). (H) BOR Segmented Pigment Plaque (PR). (I) Pigment Epithelial Detachment-multiple Image (PED). (J) BOR Segmented Pigment Epithelial Detachment-multiple (PED).
Discussion
The computational approach with results and performance of BOR algorithm is subject to discussion here. The criteria is about the device, software, SDOCT image acquiring methods might make difference in output of applied algorithm. This must be analysed first before getting inside the accuracy proof and evaluation of algorithm. SDOCT images have its limitation. SDOCT has limited by information of colour. This might be because of the narrow spectrum use in wavelength. The imaging mode in device and system acquiring process is considered for the attained image quality. OCT device software has the capability in registering of accurate image.
Automated segmentation brunch’s membrane and internal limited membrane need manual prior adjustment for clinical analyzation of diseases. SDOCT is fast scanning, limited to range and dynamic focus in imaging. In the manufacture of SDOCT, some device relay in attain of qualitative image and concentration on pattern with visualization of retinal disease. Other device relay on quantitatively acquiring and intensive imaging. The software version and OCT instrument are in various state of development. Merging of technology in TDOCT and SDOCT is encouraged. Even though, both methods are computed with SDOCT image, but device differ. These make the difference in outputs by comparing and validation.21-22 Here, the intensity of normal retinal image differs in left and right of centre point of fovea. These make the BOR methods to have the possibility of nine formations of layers in left side and eight formations of layers in right side. It is very important to standardization of OCT image and next is proving the accuracy. That is the reason the threshold level is made by manual operation. The comparison is subjected to analyse in the computation methods also i.e., the classification or clustering the intensities of abnormal pixels, the engaging the intensity relation between the internal grey pixels and consider in pattern recognition. Examining the BOR and existing methods with the applied SDOCT image, it makes the clear aspect that BOR is comparatively better than the existing methods in the efficiency of Time consuming parameter and layers detection of the algorithm.
Conclusion
Segmentation of Optical Coherence Tomography image and detection of retinal layers were experimented and computed by Boisterous Obscure Ratio (BOR) methods. Due to the noise effects and distribution, the computation methods of precise formation of retinal layer is unachievable. So, the Robust Outlying-ness Ratio (ROR) technique is proposed. BOR is derived with denoising techniques and computed with edge detection procedure and image contour model. This BOR computational segmentation procedure detects nine layer of retinal layer inclusive of partially formed layer. In comparison with the exciting methods, layer detection and time consumed is more effective. Yet, BOR can be extent to prove the accuracy and qualitatively detection of layer with intelligent and expert system algorithms.
Acknowledgments
The author would like to thank Mr. C Raja, (Thanjure) for providing the OCT images at Aravind Eye Hospital – Pondicherry. Special thanks to Mr. Sathish Gunasekaran.C (Mogappair East) and The Director of RIO-GOH – Egmore, in support of OCT images. Special thanks to Mr. C Vishnu, (Coimbatore) for the helpful contributions provided during the development of this work.
References
- Fujimoto J. G., Drexler W., Schuman J. S and Hitzenberger C. K. Optical coherence tomography (OCT) in ophthalmology: introduction. Express. 2009;17(5):3978–3979.
CrossRef - Ghorbel I., Rossant F.,Bloch I., Tick S and Paques M. Automated segmentation of macular layers in OCT images and quantitative evaluation of performances. Patn Rec. 2011;44(8):1590-1603.
CrossRef - DeBuc C. D. A Review of Algorithms for Segmentation of Retinal Image Data Using Optical Coherence Tomography. Image Seg., Dr. Pei-Gee Ho (Ed.), Chap. 2. 2011; 15-54.
- Maier M and Von Luxburg H . Optimal construction of k-nearest neighbor graphs for identifying noisy clusters. The. Comp. Sci. 2009;410(19):1749-1764.
- Fabritius T., Makita S., Miura M., Myllyla R and Yasuno Y. Automated segmentation of the macula by optical coherence tomography. Express. 2009;17(18):15659–15669.
CrossRef - Wong A., Mishra A., Bizheva K and Clausi D. A. General Bayesian estimation for speckle noise reduction in optical coherence tomography retinal imagery. Express. 2010;18(8):8338–8352.
CrossRef - Han C and Jaffe G. J. Evaluation of Artifacts Associated with Macular Spectral-Domain Optical Coherence Tomography. 2010;117(6):1177–1189.
- Chatterjee P and Milanfar P. Patch-Based Near-Optimal Image Denoising. IEEE Trans Med Imaging. 2012;21(4):1635-1649.
CrossRef - Xiong B and Yin Z. A Universal Denoising Framework with a New Impulse Detector and Nonlocal Means. IEEE Trans Biomed En. 2012;21(4):1663-1675.
CrossRef - Subei A. M and Eggenberger E. R. Optical coherence tomography: another useful tool in a neuro-ophthalmologist’s armamentarium. Curr Opin Ophthalmol. 2009;20(6):462-466.
CrossRef - Saidha S., Syc S. B., Ibrahim M. A., Eckstein C., Warner C. V., Farrell S. K., Oakley J. D., Durbin M. K., Meyer., et al. Primary retinal pathology in multiple sclerosis as detected by optical coherence tomography. Brain. 2011;134(11):518–533.
CrossRef - Yazdanpanah G., Smith B. R. H and Sarunic M. V. Segmentation of intra-retinal layers from optical coherence tomography images using an active contour approach. IEEE Trans Med Imaging. 2011;30(2):484-496.
CrossRef - Saini K., Dewal M. L and Rohit k. M. A Fast Region-Based Active Contour Model for Boundary Detection of Echocardiographic Images. J Digit Imaging. 2012;25(2):271–278.
CrossRef - Mishra A. K., Fieguth P. W and Clausi D. A. Decoupled active contour (DAC) for boundary detection. IEEE Trans. Pattern Anal. Mach. Intell. 2011;33(2):310-324.
- Malik J., Belongie S., Leung T and Shi J. Contour and Texture Analysis for Image Segmentation. Int. J. Comp. Vision. 2001;43(1):7–27.
- Liu Y. Y., Chen M., Ishikawa H., Wollstein G., Schuman J. S and Rehg J. M. Automated macular pathology diagnosis in retinal OCT images using multi-scale spatial pyramid and local binary patterns in texture and shape encoding. Image Anal. 2011;15(5):748-759.
- Do N. M and Vetterli M. Pyramidal Directional Filter Banks and Curvelets. IEEE Int. Conf. Image Proc. (ICIP). 2001;3:158-161.
- Lu Y and Do M. N. Multidimensional Directional Filter Banks and Surfacelets. IEEE Trans. Image Proc. 2007;16(4):918-931.
CrossRef - Wang Z and He S. An Adaptive edge detection methods on canny algorithm. Image and Grap. 2004;9(8):957-961.
- Chiu S. J., Li X. T., Nicholas P., Toth C. A., Izatt J. A and Farsiu S. Automatic segmentation of seven retinal layers in SDOCT images congruent with expert manual segmentation. Express. 2010;18(18):19413–19428.
CrossRef - Eom T. J., Yeh-Chan A., Chang-Seok K and Chen Z. Calibration and characterization protocol for spectral-domain optical coherence tomography using fiber Bragg gratings. Biomed. Opt. 2011;16(3):030501-3.
- Sull C., Vuong L. N and Price L.L. Comparison of spectral/Fourier domain optical coherence tomography instruments for assessment of normal macular thickness. Retina. 2010;30:235–245.
CrossRef

