
Manuscript accepted on :May 18, 2017
Published online on: --
Plagiarism Check: Yes
Shahrzad Nokhbeh Zaeem
Islamic Azad University of parand, Parand, Iran.
Corresponding Author E-mail: shahezad.nz@gmail.com
DOI : https://dx.doi.org/10.13005/bpj/1265
Abstract
In the present study the effect of selection, and unlimited local communities on changes in gene frequency were investigated.The study found a correlation between the results of the initial gene frequencies based society and generations of selective effect.Size of choice of many the result of recessive gene compared with the effects in different populations during successive generations had little effect.
Keywords
gene frequency; Hardy-Weinberg equilibrium; Popsim selection; simulation;
Download this article as:| Copy the following to cite this article: Zaeem S. N. Effect of Selection on the Genetic Structure of the Population With the Presence or Absence of Genetic Drift. Biomed Pharmacol J 2017;10(3). |
| Copy the following to cite this URL: Zaeem S. N. Effect of Selection on the Genetic Structure of the Population With the Presence or Absence of Genetic Drift. Biomed Pharmacol J 2017;10(3). Available from: http://biomedpharmajournal.org/?p=15927 |
Introduction
Strategies and policies play a key role in any program, giving a direction and the direction of the program.The strategies and policies more closely regulated and are perceived as much more compatible application framework and will be more efficient.Strategies and major policies, things that move a socio-economic system to perform a successful application form, while sub-strategies and policies, strategies and policies are essential to support and rely on them.Also, when environmental changes unpredictable is probable, caution dictates a set of sstrategies’policies of major and minor as a spare and support for the program be set up in the event of major changes and crucial ina military environment, sets help placed on strategy and policy action.[1]
With theonset of the Industrial Revolution in the nineteenth century, humanity entered a new phase of growth and development was. At that time, European countries,as well as labor and natural resources aremanagedby professionals, industrial base and economic growth to speedthe foundation.With the passage of time and the emergence of new problems or concerns in the development of industry, most European governmentsturneda kind ofcentral planning and were able to reduce the effects of the global crisis.After World War II, new conceptand many developingcountries were forced to turn central planning and creating a multi-year program.1
With the victory of the Islamic Revolution in Iran, the need for planning and determining the course of the economic, social and cultural goals and new standards more than ever, that the necessity of the Principle of the Constitution explicitly reflected.Seriously planning activities in 1360 was on the agenda of the government.The responsible agencies to transform the relations of economic, social and cultural past as well as developing goals, policies and programs were developed to provide a coordinated and comprehensive planning system in their country.System planning on 10.10.1360 by the Economic Council was formed with the approval of the proposed PBO.The main feature of this system, according to regional planning and regional as well as its flexibility and because the scheme of how to develop along term plan for twenty years to evaluate the project and execution plans annually in different cities was discussed.2
Knowledge of the composition of the population and its distribution in each country determining role in the development of its comprehensive and governments relying on these figures enable them to develop micro and macro social and economic development, cultural and evenOrganizers organized civil society.3 The idea is that genetic variation can improve the ability of individuals and increase the chance ofsurvival of the population.4,5 Several factors such as natural selection, genetic drift, migration, distribution,bottleneckand depopulationof primary importance in the development of genetic variation.6
Therefore, to develop programs and strategic planning, scenarios can be simulated and the strategic plans proposed.
Materials and Methods
With the assumption that the society is unlimited, mutation and migration and drift genetic does not exist (the ideal), if caused by an external factor, the chances of survival of life Homozygouslost 0 and 20 and 50 percent of the genes in the population of Mirrors Others frequency 0.2 and 0.5 and 0.8 have after several successive generations (for example 10, 20, 200 and 400 generation) frequency of the desired genein these communities, what will change?Another question is if the target population is limited, the consequences of natural selection has been said many communities, there?
The Research Scenarios
1 = in the large (unlimited) migration, mutation and genetic drift and in every generation 100% Homozygousnot have to remove any recessive gene frequency in the population is 2 0.0 5 0.0 8 0.0, after 10, 20, 200 and 400 generation, what will change?
In a large community (unlimited)migration, mutation and drift would not and 80% per generation Homozygousto remove any recessive gene frequency in the population is 2 0.0 5 0.0 8 0.0, after 10, 20, 200 and 400 generation, what will change?
In a large community (unlimited) migration, mutation and drift would not and 50% per generation Homozygousto remove any recessive gene frequency in the population is 2 0.0 5 0.0 8 0.0, after 10 20, 200 and 400 generation, what will change?After applying choice of study population and its effect on the frequency of the gene in the long run the simulation was performed.Two of limited and unlimited to any of three scenarios compared to the general, the gene for survival rates of 0, 20,
50 percent were considered.In order to better explain the effect of the frequency of the gene in the initial population 0.2 and 0.5 and 0.8.
Scenario simulation and data processing with programPopsim,the results and output data in the form of numerical tables (1, 2, and 3), the first since the election to apply to the time displayed.
Results and Discussion
Table 1: Final frequency of homozygous recessive gene aftergenerations by eliminating 100%
| The initial frequency of 0.2 | The initial frequency of 0.5 | The initial frequency of 0.8 | ||||
| Unlimited | Limited | Unlimited | Limited | Unlimited | Limited | |
| Generation 10 | 0.0663 | 0.0662 | 0.0833 | 0.0830 | 0.0889 | 0.0888 |
| Generation 20 | 0.040 | 0.0395 | 0.0445 | 0.0441 | 0.0471 | 0.0470 |
| Generation 200 | 0.0049 | 0.0039 | 0.0050 | 0.0051 | 0.0050 | 0.0049 |
| Generation 400 | 0.0025 | 0.0010 | 0.0025 | 0.0019 | 0.0025 | 0.0020 |
Table 2: Final frequency of homozygous recessive gene aftergenerations by eliminating 80%
| The initial frequency of 0.2 | The initial frequency of 0.5 | The initial frequency of 0.8 | ||||
| Unlimited | Limited | Unlimited | Limited | Unlimited | Limited | |
| Generation 10 | 0.0783 | 0.0784 | 0.1052 | 0.1058 | 0.1202 | 0.01213 |
| Generation 20 | 0.0484 | 0.0489 | 0.0576 | 0.0556 | 0.0618 | 0.0620 |
| Generation 200 | 0.0061 | 0.0051 | 0.0062 | 0.0041 | 0.0063 | 0.0053 |
| Generation 400 | 0.0031 | 0.0010 | 0.0010 | 0.0019 | 0.0031 | 0.0017 |
Table 3: Final frequency of homozygous recessive gene after generations by eliminating 50%
| The initial frequency of 0.2 | The initial frequency of 0.5 | The initial frequency of 0.8 | ||||
| Unlimited | Limited | Unlimited | Limited | Unlimited | Limited | |
| Generation 10 | 0.1042 | 0.1043 | 0.1638 | 0.1630 | 0.2147 | 0.2140 |
| Generation 20 | 0.0696 | 0.0686 | 0.0929 | 0.0920 | 0.1083 | 0.1077 |
| Generation 200 | 0.0097 | 0.0090 | 0.0100 | 0.0096 | 0.0102 | 0.0097 |
| Generation 400 | 0.0049 | 0.0020 | 0.0050 | 0.0049 | 0.0051 | 0.0017 |
 |
Figure 1: final frequency of genes from generations long after |
Table 1 describes, in a society where selection is done and all those beaten are removed, the frequency of the gene in the community and in later generations sharply drops, but never to zero is not possible, because the amount of gene different generations passed through the heterozygous dominant frequency is reduced much more heavily defeated death, as well as gene frequency in the next generation becomes less severe effect on future generations.
Table 2 shows that in addition to the results mentioned above, the carrier of this concept is the key, if those genes and alleles have a chance of survival in society, the slope of the graph is close to zero for milder.
Results Table 3 above may be used to generalize.
For each scenario, there is a graph such as Figure 1 and can be as high results were observed.
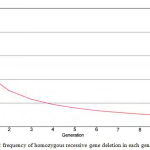 |
Figure 2-1: frequency of homozygous recessive gene deletion in each generation |
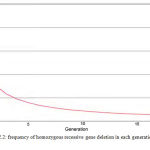 |
Figure 2-2: frequency of homozygous recessive gene deletion in each generation |
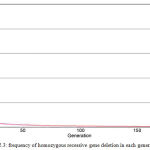 |
Figure 2-3: frequency of homozygous recessive gene deletion in each generation |
 |
Figure 2-4: frequency of homozygous recessive gene deletion in each generation |
Top Charts selection of the study population and the severity of its effect on disturbance on society are well explained and interesting the key point is that, in all scenarios, with each frequency of recessive homozygous generation zero the charts like the forms listed show.
Conclusion
Choose causing drastic changes in gene frequency is the first generation.These changes gradually reduced the intensity of the reason for this is latent recessive allele in patients with genotype carriers.The difference in effect after multiple generations on finite and infinite populations were observed, indicating that it is important that the size of the population after several generations have the effect of increasing the selection process.
Acknowledgement
This research was supported by Islamic Azad university of Parand. We are thankful to our colleagues who provided expertise that greatly assisted the research.
Reference
- Herranz D., Mun˜oz-Martin M., Can˜amero M., Mulero F., Martinez-Pastor B., Fernandez- Capetillo O and Serrano M. Sirt1 improve healthy ageing and protects from metabolic syndrome-associated cancer. Nat Commun. 2010
CrossRef - INETTE S., RUNQING L. U. Resveratrol a Natural Product Derived from Grape Exhibits ntiestrogenic Activity and Inhibits the Growth of Human Breast Cancer Cells .JOURNAL OF CELLULAR PHYSIOLOGY. 1999;179:297–304.
CrossRef - Chen D., Bruno J., Easlon E., Lin S. J., Cheng H. L., Alt F. W and Guarente L. Tissuespecific Regulation of SIRT1 by calorie restriction. Genes Dev. 2008;22:1753–1757.
CrossRef - Zhang X. Y., Zhou M. L., Zhang X. H., Wu D. J. Study on population genetic structure of Liangshan semi-wool sheep using microsatellite markers. Pakistan Journal of Biological.Sciences. 2009;11:2423-7.
- Hall S. J. G., Bradley D. G. Conserving livestock breed biodiversity. Trends Ecology and Evolution. 1995;10:267-270.
CrossRef - McRae B. H., Beier P., Dewald L. E., Huynh L.Y., Keim P. Habitat barriers limit geneFlow and illuminate historical events in a wide-ranging carnivore the American puma. Molecular Ecology. 2005;14:1965-1977.
CrossRef

