
Manuscript accepted on :July 06, 2017
Published online on: --
Plagiarism Check: Yes
Ammi Reddy Pulagam1, Venkata krıshnarao Ede2 and Ramesh Babu Inampudi3
1VasireddyVenkatadri Institute of Technology, Nambur, Guntur, AP, India.
2Lakireddy Bali Reddy College of Engineering, Mylavaram, Vijayawada, AP, India.
3Acharya Nagrjuna University, Nagarjuna Nagar Guntur, AP, India.
Corresponding Author E-mail: pulagamammireddy@gmail.com
DOI : https://dx.doi.org/10.13005/bpj/1235
Abstract
The pulmonary lung nodule is the most common indicator of lung cancer. An efficient automated pulmonary nodule detection systemaids the radiologists to detect the lung abnormalities at an early stage. In this paper, an automated lung nodule detection system using a feature descriptor based on optimal manifold statistical thresholding to segment lung nodules in Computed Tomography (CT) scans is presented. The system comprises three processing stages. In the first stage, the lung region is extracted from thoracic CT scans using gray level thresholding and 3D connected component labeling. After that novel lung contour correction method is proposed using modified convex hull algorithm to correct the border of a diseased lung. In the second stage, optimal manifold statistical image thresholding is described to minimize the discrepancy between nodules and other tissues of the segmented lung region. Finally, a set of 2D and 3D features are extracted from the nodule candidates, and then the system is trained by employing support vector machines (SVM) to classify the nodules and non-nodules. The performance of the proposed system is assessed using Lung TIME database. The system is tested on 148 cases containing 36408 slices with total sensitivity of 94.3%, is achieved with only 2.6 false positives per scan.
Keywords
Computed Tomography; Nodule; Statistical Thresholding; SVM
Download this article as:| Copy the following to cite this article: Pulagam A. R, Ede V. K, Inampudi R. B. Automated Pulmonary Lung Nodule Detection using an Optimal Manifold Statistical Based Feature Descriptor and SVM Classifier. Biomed Pharmacol J 2017;10(3). |
| Copy the following to cite this URL: Pulagam A. R, Ede V. K, Inampudi R. B. Automated Pulmonary Lung Nodule Detection using an Optimal Manifold Statistical Based Feature Descriptor and SVM Classifier. Biomed Pharmacol J 2017;10(3). Available from: http://biomedpharmajournal.org/?p=15853 |
Introduction
Lung Cancer is one of the prime causes of death related to cancers at global level. Majority of the patients suffering from lung cancer are at advanced stage (stage IV – 40%, stage III – 30%), and only 16% survival rate for the present five years is found.1 Identification at an early stage and initiating the treatment for the lung cancer can significantly improve the survival rate of the patients. Computed Tomography (CT) is the most accurate imaging modality available for early detection and diagnosis of lung nodules (cancer). It can be used todetect pathological deposits even smaller than 1 mm in diameter. The nodule is a round or irregular opaque shape with a diameter up to 30 mm on a CT scan.Early detection of nodules is a vital step in diagnosing the lung cancer, but CT scan comprises large quantity of images which is time consuming for the radiologist to assess. In this connection, the computer aided detection (CAD) is a remedy that can provide an effective solution by assisting the radiologists with significantly improving the scanning efficiency for visualization, detection and characterization of nodules.2,3 In this light we present an automated pulmonary lung nodule detection system from CT images on a slice method in this paper. Once the nodules have been detected in each slice, a 3D surface of the nodule can then be reconstructed. Our method allows, naturally an extraction of pulmonary lung nodule candidates which can further be used to classify the nodules.
For over a decade, scholars from various strata of the globe have put forward a series of pulmonary lung nodule detection methods.4-2 The primary stages employed in these lung nodule detection methods are lung segmentation,4-13nodule candidate detection,14-19and elimination of false positive nodules (FPNs).10,14,19-21 The first stage shows that lungs look like dark regions in CT scans, as they are basically bags full of air inside it, hence, the image intensities of the lung and surrounding tissues are clearly contrasted. This phenomenon encouraged good number of researchers to search for an effective thresholding method which can separate the lung region from all other tissues. A threshold to extract an initial lung region can basically be computed. Global thresholding is an effective technique for extracting the initial lung region as it segments the scans with distinctive gray levels relating to lung region and background.5-6 Initial lung region can also be segmented using a fixed threshold,6-73-D adaptive fuzzy thresholding,7 region growing8 and hybrid segmentation.9 In case of lung edge affecting pathologies, all these methods are found to be ineffective. This is because of the changes in image intensity at pathological regions as well as the gray levels which are closer to that of muscle, fat, or bone.To overcome these problems, a chain code representation method,10 morphological approaches,11a rolling ball method12 are used.In this paper a new contour correction method is proposed by using modified convex hull algorithm13 for effective segmentation of lung region.
The second stage in lung nodule detection systems is the detection of lung nodule candidates. Multi gray level thresholding has been applied widely to identify nodule candidates.14 Shape based template matching approach was used to detect the spherical nodules.15-16 The 3D template matching approach utilizes 3D of regions of interest to identify structures having properties similar to pulmonary nodules.17 The Filtering based method18 detected the nodules by improving the intensity of nodules and reducing the same for non-nodules. In recent times, mass spring model based candidate detection method has been widely used to detect nodule candidates.19 These methods are unable to obtain satisfactory results, when lung regions having large variance discrepancy between the lung nodule and background. Hence, these methods consider only the class variance sum, but neglect the discrepancy of class variances. As an attempt to eliminate this limitation a new optimal statistical thresholding method is presented. This new method takes into account both the class variance sum and the variance discrepancy at the same time and constructs an optimal manifold statistical criterion for threshold selection within the region of interest (ROI).
The last stage in a lung nodule detection system is the classification of the lung nodules from non-nodules based on the extracted feature vectors from the segmented nodule candidates. Over the past decade, several methods7,10,15,20,21 have been proposed to reduce false positives. The rule-based filteringand linear discriminate analysis classifiers5,7,12 are widely used for classification of nodule candidates. A rule-based filtering is only able to detect the general shape of nodules. A linear classifier cannot achieve acceptable results because the features extracted from nodule candidates are not linear. Moreover, machine learning based detection methods have also been used for false positive reduction based on genetic algorithm, neural networks14,19 and genetic programming.20 It should be noted that though the above classifiers comparatively large number of false positives are detected the still remain. In this paper we have used SVM classifier by radial basis function to classify pulmonary nodule detection to have improved accuracy and reduced false positive rate.
Material and Methods
The proposed system is evaluated using Lung TIME database22 of thoracic CT scans with manually annotated pulmonary nodules. The experimental results have high degree of accuracy, sensitivity with reasonable specificity.
An overview of different stages of the proposed pulmonary lung nodule detection system is shown in Fig. 1.The basic objective of the first stage is to extract the lung region from the human chest CT scan which contain components like fat, other tissues (including trachea, fat, ribs, examination bed, and so on) and air-filled regions.
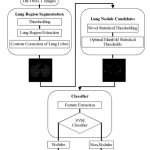 |
Figure 1: Process of proposed pulmonary lung nodule detection system |
Lung Region Segmentation
The thoracic CT scan contains the lung parenchyma as shown in Fig. 2(a). The proposed lung region segmentation comprises three steps: (a) detection of binary lung mask using global thresholding, (b) Extraction of lung region employing 3D-connected component labeling and mathematical morphology and (c) refining the lung contour to get complete lung region using the proposed modified convex hull algorithm.
As the normal attenuation range for most of the lung tissue in a CT slice is from -910 HU to -350 HU. We set -350 HU as the threshold value for separating the lung region from the thoracic CT scan. Hence the initial lung mask is attained by thresholding all the non-body pixels which is given by
![]()
Where fi (x, y) is a pixel at (x, y) for the input thoracic CT ‘ ith’ slice of f. The initial lung mask obtained for the CT image is as shown in Fig. 2c.
In the initial lung masks obtained, black borders denote non-lung region and center black areas indicate the lung region. The non-lung regions are removed by flood filling. After that, 3D-connected component labeling is used to select largest and second largest labels that are lung regions and lung regions containing holes, which are normally vessels or nodules. Morphological hole-filling operations are applied to get binary lung mask as shown in Fig. 2(d).
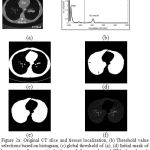 |
Figure 2a: Original CT slice and tissues localization, (b) Threshold value selections based on histogram, (c) global threshold of (a), (d) Initial mask of lung region after removing background, fat, muscle, and CT bed, and mask after filling holes but it contains juxta-pleural nodules.(e) final mask after contour correction, (f) segmented lung region extraction |
If the CT slice contains juxta-pleural nodules along the contour of lung region, this will affect the detection of lung edges as the intensity of these nodules is same as that of the surrounding lung region. In this paper, a modified convex hull algorithm for the contour correction of lung region is presented.
The modified convexity algorithm is simulated from a fast algorithm for convex hull extraction in 2D image.13 It initially finds the eight extreme points on the contour of binary image. The modified convexity algorithm extracts the extreme points by scanning the binary image from outer to inner. The boundary of the lung region is scanned pixel by pixel until it reaches the last boundary pixel. Thus, the monotone segments are obtained and the convex hull is extracted as presented in Fig. 3.
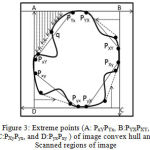 |
Figure 3: Extreme points (A: PxYPYx, B:PYXPXY, C:PXyPyx, and D:PyxPxy ) of image convex hull and Scanned regions of image
|
The binary image is partitioned into four regionsin Fig.3 (i.e. A PYxPxY , B PXY PYX , C PyXPXy, and D PxyPyx) by employing these extreme points.Only these extreme points are processed while finding the vertex. By orderly monotone scanning increase then temporary convexity is extracted. The entire convexity is obtained by continuously improving the momentary convexity. Theseconvex hull algorithm processes less storage space and time for scanned areas are less and only the vertices of temporary convexity require storage. After applying improved convex hull algorithm, the coarse segmented lung image is subtracted from the result of modified convex hull algorithm. As the resultant image contains some small responses and objects at the border, morphological erosion with a spherical kernel of size seven and connected label filtering are then applied to remove these responses. The eroded image is subtracted from the result of the modified convex hull algorithm to extract the final lung region. Fig. 2 (e) shows the extracted binary mask of lung and it can be observed that the missing juxta-pleural nodules are added to the segmented lung. Finally, the extracted lung region is presented in Fig. 2 (f).
Candidate Nodule Detection
The effectiveness of an automated pulmonary lung nodule detection system depends on the accuracy of the detected nodule candidates. In the nodule candidate detection, initially ROIs are extracted based on the proposed optimal manifold statistical thresholding and then the nodule candidates are segmented from these ROIs.
The extraction of ROIs is complicated as the lung nodules have broader gray level range and varying level of vessel attachment. The optimal manifold statistical threshold is to overcome these complications. Earlier methods employed the mean or a fixed value as the base threshold in to multiple thresholding,16,17 which may not always perform well. Therefore, we have calculated the new optimal statistical threshold value as a base threshold.
Optimal Statistical Thresholding Algorithm
Traditional Statistical Thresholding
Let the extracted lung region having L gray levels (0 to L-1) and the total number of pixels in the image is N = no + n1 +….+ nL-1- The probability of ithgray level is defined as
![]()
That is, the number of pixels ni having grey scale intensity ‘ i ’ as a fraction of the total number of pixels N. The lung region is separated into two classes CB and Co using a gray level ‘ t ’. Here, CB is the background with levels ‘0’ to ‘ t ’ and the remaining pixels are the nodule candidates in Co Then the probabilities of these classes are defined as
The mean of the classes is defined as
The basic idea is to estimate μB – the average of the all corner pixels (background) and μo – the average of object pixels.
The variance of the classes is given by
Computing the intra-class variance, the inter-class variance and the total variance of the combined distribution is defined as
where

According to the above equations, the following basic relation always holds:
![]()
The variances intra and inter classes are functions of gray level ‘ t ’ and the total class variance is independent of . Minimization of intra-class variance is equivalent to Maximization of inter-class variance. Thus, the optimal threshold ‘ t * ’ can be determined by,23
![]()
The optimal threshold maximizes the inter-class variance of real-world images, but exhibits a limitation to classify an image into two parts of similar sizes regardless of the practical size of the object. After exploring the potential reason for the weakness, Hou’s24 developed a generalized version with a new threshold criterion, i.e., total class variance, and found the optimal threshold by minimizing it. The optimal threshold ‘ t * ’ can be defined as follows:
![]()
Proposed New Criterion
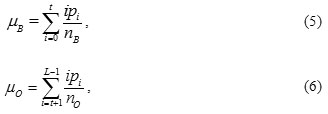
The traditional methods only consider the sum of class variance, but neglect variance discrepancy between object and background of image. The typical example is in Fig. 4(a) where the nodule has slight gray level changes and small class variance, while the background has large gray level changes and large class variance. Its histogram of bimodal distribution with unequal sizes and groundtruth image are shown in Figs. 4(b) and (c). Manual threshold corresponding to the groundtruth image is 110, which locates it in between of two peaks. In this case those statistical thresholding methodsfind erroneous thresholds (i.e., 129 and 150) and fail to segment the object from background as shown in Fig. 4 (d) and (e). The reason is that the two approaches take only the sum of class variance into account, but neglect discrepancy of class variances. As an attempt to eliminate the limitations of these methods, a new statistical thresholding method is proposed in this paper.
 |
Figure 4: Thresholding results of juxta-pleural nodule: (a) original, (b) histogram, (c) ground truth (t = 110), (d) Otsu’s (t = 129), (e) Hou’s (t= 150), (f) the proposed method (t =119) |
The proposed method takes class variance sum and variance discrepancy into account at the same time and constructs an optimal statistical criterion for threshold selection, which can be formulated as
![]()
where
![]()
and
![]()
or
![]()
is used to measure variance discrepancy of two threshold classes. Here σ B (t) and σ o (t) are their respective standard deviations. The parameter α is a weight that balances the contributions of variance sum and variance discrepancy. When α = 0 i.e nB = no, the new criterion degenerates to Otsu’s criterion.23 Thus the proposed method can be regarded as a generalized version of Otsu’s method. An optimal threshold t* can be found by minimizing the discrepancy in the new criterion
![]()
Actually, equation (15) attempts to decrease the effect of class variance sum and emphasizes the influence of variance discrepancy simultaneously. In this way, the variance discrepancy becomes an explicit factor for determining the optimal threshold as shown in Fig. 4 (f).
Optimal Manifold Statistical Thresholds for ROI Extraction
The optimal statistical threshold t* is the basic threshold for various nodule candidates and result of thresholding is shown in Fig. 4(f). The wide intensity range of nodules and the varying level of vessel attachment, make it difficult to extract ROIs. Optimal manifold statistical thresholds can be used to overcome these difficulties. To extract ROIs, we propose the use of optimal manifold statistical thresholding.Additionally six thresholds viz. t* – 200, t* -100, t* +100, t* +200, t* + 300, and t* + 400 are used for the selection of ROIs. These ROIs are cumulative into one ROI image, i.e.
![]()
where I is the extracted lung region,
![]()
is the nth optimal statistical threshold, and S, is the segmented lung region mask. For the original chest CT image with groundtruth markingspresented in Fig. 5 (a) and the ROIs are shown in Fig. 5 (b).
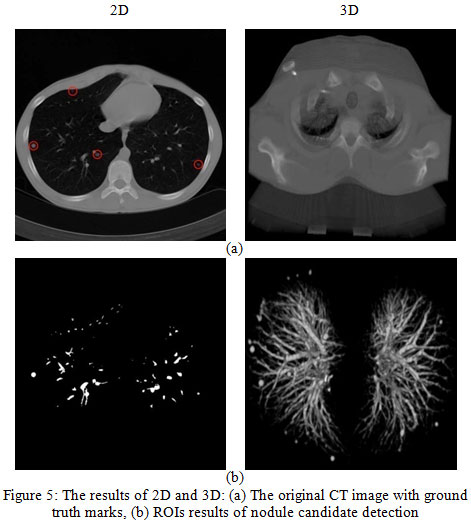 |
Figure 5: The results of 2D and 3D: (a) The original CT image with ground truth marks, (b) ROIs results of nodule candidate detection |
Classification of Nodules and Non-Nodules
The resulting images shown in Fig. 5 (b) contain some blood vessels (non-nodules) along with the true nodules. We used SVM classifier to classify nodules and non-nodules based on thefeature vectors extracted from the nodule candidates.
Feature Extraction
Here, we extracted ten features for training and classification, including six 2D features (area, diameter, circularity, elongation, compactness, and moment), and four 3D features (surface area, volume, sphericity, and centroid offset).
The 2-D geometric features are extracted in the following manner:
The area is obtained by using the equation:
![]()
Here, 0m is a middle slice of the segmented object 0 because the area of the segmented object at the median slice is the largest.
The diameter is a maximum bounding box length of 0m
The Circularity reflects the similar degree of ROI region to a circle as follows:
![]()
where r is the radius of the circumscribed circle and is equal to D / 2 .
Elongation is an asymmetry degree of an object and is obtained as follows:
![]()
where rmin and rmax are the measurement from the centroid to the nearest and farthest points on the boundary.
Compactness is defined as
![]()
Rinside, and Routside are the radius of inscribed and circumscribed circle of ROI. If the value of compactness approximates to 1, ROI is closed and compact to a circle.
Moment of ROI is defined as
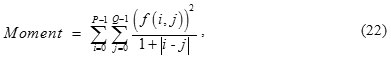
f (i, j) is normalized gray-value of pixels of ROI; and
![]()
are the number of rows and columns, respectively.
The 3-D geometric features are extracted in the following process:
Surface area of ROI as
![]()
where P (x,y) is the perimeter pixel number of ROI boundary, and Si is the ith slice of the ROI.
The volume of the segmented object is calculated as V = N.Here, Nis sum of numbers of pixels whose gray scale is nonzero in all the ROI layers and it is defined as the volume of 3D ROI.
Sphericity is measure how much the shape of the object approximates to a spherical shape and is calculated as follows
![]()
Centroid offset is defined as
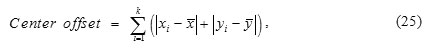
Where k is number of ROI slices, (xi, yi) is the coordinate of centroid of the ith slice, and (x, y) is the average coordinate of all the ROI slices.
SVM ClassifierSVM is very useful tool for object classification. 10, 21, 25The basic SVM considers a set of input data and predicts two possible classes for each given input. Generally, the number of nodules is less than the number of non-nodules. This discrepancy affects the training of the classifier. Hence, we should balance the quantity of non-nodules and nodules. For this, we have randomly selected N / 2 non-nodules and N / 2 nodules from the obtained nodule candidates. The balanced dataset is then arbitrarily classified into testing and training datasets to validate the classifier. Suppose that we have a random sample of training dataset represented by
Where N is the number of training samples of nodule candidates, Xi in
![]()
is a feature vector, and yi in {+1,-1} indicates to linearly separable classes. The training data pair consists of an input feature vector and its equivalent known target class. The optimal solution of the SVM separating hyper-plane defined by a vector in a high-dimensional space is
![]()
Therefore
![]()
Where f (Xi) is the decision function, λ is a regularization parameter, ξi ≥ 0 is slack variable, that indicates most of the cases are not linearly separable. In order to handle such cases, cost function need to be formulated for combining margin maximization and error minimization criteria. Φ is a non linear function that maps each data point into a higher dimensional space by a positive semi-definite kernel k:Rd X R k = ![]() d X
d X ![]() d →
d →![]() . This kernel is equivalent to an inner product in a higher dimensional space through k ( X, X’) = { Φ (x), Φ (x’) }.
. This kernel is equivalent to an inner product in a higher dimensional space through k ( X, X’) = { Φ (x), Φ (x’) }.
Here, the radial basis function (RBF) is used as the kernel:
Radial basis function
where p > 0 is a kernels parameter.
The RBF kernel maps the feature space into a higher dimensional space to find an optimal segmentation hyper-plane. Nodules and non-nodules can be easily classified, once the classifier is trained. To obtain the nodule class from the test data, it requires an input feature vector of every nodule candidate. It is crucial to differentiate an input training and test datasets. In short, the lexicographical arrangement of input feature vectors is presented in a matrix of size N X M, where d represents a M dimensional feature vector, and N is the total number of feature vectors. The feature vector set is used to train the SVM for higher dimensional space to find an optimal segmenting hyper-plane.
In order to evaluate the SVM classifier, we have used k-fold cross validation. In k-fold cross validation, the original sample is subjectively divided into k sub-samples having equal size. Of the k sub-samples, a single sub-sample is selected as the validation data for testing the model and the remaining k – 1 sub-samples are used as training data. The cross validation process will be repeated for k folds with each of the k sub-samples. The results from the k folds are averaged to get a single estimation.
Results and Discussion
The performance of the proposed lung nodule detection system is evaluated using the publicly available Lung TIME database.22 This database contains 148 CT scans. Each scan contains a varying number of image slices. On an average, 220 slices per scan are found and every slice has 512 × 512 pixels and 4K gray level values in HU, the resolution of image was 1.6 pixels per mm, slice spacing 1mm, slice thickness 5mm, and transversal resolution 0.58 ±0.06 mm. The database consists of 394 annotated nodules which covers almost every nodule type with 2-10 mm in diameter. Annotation is marked by two experienced radiologists. The database is in DICOM format and the data was acquired on Siemens CT machine.
Five performance measures viz. accuracy, sensitivity, specificity, geometric mean (G – mean) and 𝐹–measure are used to evaluate the proposed lung nodule detection system based on the following four possibilities:
True positive (TP): the judgment by expert radiologists and the classifier prediction are both correctly labeled as object.
False positive (FP): the judgment by experts is background, while the classifier prediction is object.
True negative (TN): the judgment by experts and the classifier prediction are both background.
False negative (FN): the judgment by experts is object, while the classifier prediction is background.
The accuracy is the fraction of all correctly classified pixels:
![]()
When all pixels are correctly labeled, then accuracy is one.
The sensitivity is the fraction of correctly labeled object pixels:
![]()
A sensitivity of one indicates that all object pixels have been labeled correctly.
Specificity is the fraction of all correctly labeled background:
![]()
For an unbalanced data classification performance evaluation criteria is geometric mean (G – mean), which is defined as
![]()
G-mean maintains the balance between classification accuracies of the two classes. For the evaluation of SVM, a function of 𝐹-measure is a way of evaluation of accuracy and sensitivity of the classification results for positive class. Here the accurate rate of classification of positive class is defined as
![]()
The evaluation function of 𝐹-measure can be defined as follows:
![]()
Obviously, the optimum of classification is that 𝐹-measure gets the maximum value 1.
Lung Region Segmentation
The results of the lung region extraction for various lung slices as shown in Fig. 6. The input thoracic CT images are shown in the first column. The second column presents corresponding lung region mask for the input CT images in first column. To generate the lung region mask, we set a threshold of -350 HU in order to separate the lung region from the thoracic CT scan. From the second column it can be observed that the extracted lung region is under segmentedas the images we have considered have parenchymal lung diseases which include honeycombing, ground glass opacity, emphysema, and juxta-pleural nodules. The results of the proposed modified convex hull algorithm are given in the third column. The proposed method provides more accurate lung segmentation results as the algorithm uses the monotonicity property to extract the convex hull of an object such that the accuracy in segmentation and the computing speed increases.
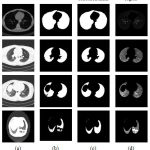 |
Figure 6: Results of lung region segmentation |
The proposed algorithm has a very less computational cost in the following ways: (1) It divides the binary image into several regions by using the extreme points such that only those boundary pixels in few regions require computation. (2) The boundary pixels obtained by scanning are computed dynamically and only these vertices of temporary convex hull require storage. The segmented lung region is shown in the last column.Table 1 presents the results of proposed lung region segmentation algorithm before and after contour correction in terms of accuracy, sensitivity and specificity. The results yield comparable accuracies before and after contour correction. To enhance the sensitivity of this contour correction internal and sub-pleural lung regions are then truncated. The specificity indicates the probability of obtaining a negative result when the lung regions don’t have the disease after contour correction.
Table 1: Summary of quantitative evaluation oflung region segmentation results before and after the contour correction by improved convexity algorithm. Numbers represent average ± standard deviation.
| Accuracy | Sensitivity | Specificity | |
| Before | 0.94 ±0.06 | 0.90 ±0.23 | 0.99 ±0.01 |
| After | 0.95 ±0.04 | 0.98 ±0.14 | 0.96 ±0.02 |
Nodule candidate Detection
The proposed nodule candidate detection method is performed on the segmented lung regions. ROIs for the nodule candidates are extracted from the segmented lung region using optimal multiple statistical thresholding. Fig.7 presents the detected lung nodule candidates after applying optimal multiple statistical thresholding. The proposed method has detected 326 nodules with 31,743 FPs with a sensitivity of 94.29% and FPs of 214.4 per scan. In new optimal statistical thresholding, we have considered sum of the class variance and variance discrepancy of the object and background for threshold selection, the method obtained good results while segmenting small nodules which are isotropic or nearer to vessels and other structures.
 |
Figure 7: The results of nodule candidate detection: extracted lung region(upper row), nodule candidate(bottom row) detection by proposed method
|
We have selected 326 non-nodules randomly from the detected non-nodule candidates and these non-nodules are then combined with 326 nodules to generate a balanced dataset for training.Finally, we have classified the detected nodule candidates into nodules and non-nodules using SVM classifier with radial basis function as kernel. The 2D and 3D orientations of the detected nodules and non-nodules by the SVM classifier are as shown in Fig.8. In order to evaluate the SVM classifier, we have used k-fold cross validation. In this work, k =7 is used for evaluation as it provides a good balance between training and testing data for evaluating the proposed method than 5-fold and 10-fold cross validation. Table 2 shows the performance of SVMs for different k values.
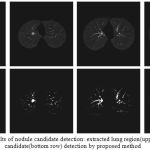 |
Figure 8: The results of Fig. 5(b) nodule candidates: (a) nodule, (b) non-nodule |
Table 2: The k-fold cross validation results of SVM classifiers with radial basis function kernel for different k values
| k | Performance for data set (%) | FPs/Scan | |||||
| Sensitivity | Specificity | Accuracy | PPC | G-Mean | F-measure | ||
| 5 | 90.09 | 91.99 | 91.98 | 90.09 | 91.04 | 90.09 | 2.7 |
| 7 | 94.29 | 92.64 | 92.65 | 92.34 | 93.46 | 93.3 | 2.6 |
| 10 | 90.99 | 92.07 | 92.06 | 90.99 | 91.53 | 90.99 | 2.9 |
SVM Classifier
The proposed classification approach achieved a sensitivity of 94.29%, specificity is 92.64%, accuracy is 92.65 %, G-mean 93.46% and an F-measure is 93.3% with 2.6 false positives per scan in the range of 2-10 mm in diameter of nodule size. All other CAD systems have reasonable sensitivity values in classification of pulmonary nodules. It is extremely important to considerthe small nodule size in the classification of a CAD system. This increases the probability of early detection of nodules. Considering these results, it can be said that the proposed study represents a relatively high sensitivity. The Fig. 9 shows the ROC curve of the SVM classifiers.
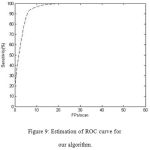 |
Figure 9: Estimation of ROC curve for our algorithm.
|
We used recently reported lung nodule detection systems 7,14-16,18,19 to compare and evaluate the results of proposed lung nodule detection system. The comparison with other lung nodule detection systems is difficult, as they used different database having different nodule orientations and sizes. The reported CAD systems used LIDC database in which the size of the nodules ranges from 3 mm to 30 mm. Table 3 presents the comparison of the proposed system with other systems. It can be observed from the table that the proposed system shows significantly better sensitivity with high reduced false positives. The system achieves 2.6 FPs per scan, with 93.3% sensitivity.
Table 3: Reported of performance comparison of CAD system
| CAD systems | Number of cases | Number of nodules | Nodule size criterion used (mm) | Sensitivity (%) | Average FPs per case |
| Messay et al. [7] | 84 | 143 | 3–30 | 82.66 | 3 |
| Golosio et al. [14] | 84 | 148 | 3–30 | 79 | 4 |
| Dehmeshki et al. [15] | 70 | 121 | 3–20 | 90 | 14.6 |
| Pu et al [16] | 22 | 71 | ≥3 | 76 | 3 |
| Suzuki et al. [18] | 71 | 121 | 8–20 | 80.3 | 16.1 |
| Cascio et al. [19] | 84 | 148 | 3–30 | 97.66 | 6.1 |
| Proposed system | 148 | 355 | 2–10 | 94.3 | 2.6 |
Conclusion
This paper presents an expert system to detectpulmonary nodules from chest CT scans using a feature descriptor based on optimal manifold statistical thresholding. The key features of the expert system are 1. A modified convex hull algorithm that is used to correct the lung contour which may be affected by dense abnormalities like juxta pleural nodules, ground glass obesity, etc and 2. A novel optimal manifold statistical thresholding algorithm can effectively detects the nodule candidates from segmented lung region. The modified convex hull algorithm uses the monotonicity property to extract the convex hull of an object such that the accuracy in lung region segmentation and the computing speed increases. The proposed optimal manifold statistical thresholding is used to segment the nodule candidates by considering the class variance sum and variance discrepancy simultaneously. The proposed method can be regarded as a generalized version of Otsu’s method. The proposed system is evaluated on the publicly available Lung TIME database, and the results are compared with the results of recently reported systems. The proposed system shows the reduction of the false positive rate (2.6 FPs per scan) significantly while maintaining a high sensitivity of 94.3%. Hence, it is suitable for application in clinical lung cancer CAD systems.
Acknowledgement
The authors would like to thank Dr Babu Rao G and Dr. Giri Babu Kande for marking ground truth nodules on CT chest images and for the help in data collection.
References
- Siegel R. L., Miller K. D and Jemal A. Cancer statistics.CA: A Cancer Journal for Clinicians. 2015;65(1):5–29.
CrossRef - Ballangan C., Wang X., Fulham M, Eberl S and Feng D. D. Lung tumor segmentation in PET images using graph cuts.Computer Methods and Programs in Biomedicine. 2013;109(3):260–268.
CrossRef - Thomsen L. P., Weinreich U. M., Karbing D. S., Jensen V. G., Vuust M., Frøkjær J. B., Rees S. E. Can computed tomography classifications of chronic obstructive pulmonary disease be identified using Bayesian networks and clinical data?Computer methods and programs in biomedicine. 2013;110(3):361-368.
CrossRef - Samuel C., Saravanan V and Devi M. V. Lung nodule diagnosis from CT images using fuzzy logic. ICCIMA-2007. 2007:159–163.
- Suárez-Cuenca J., Tahoces P., Souto M., Lado M., Remy-Jardin M., Remy J., and José Vidal J. Application of the iris filter for automatic detection of pulmonary nodules on computed tomography images.Computers in Biology and Medicine. 2009;39(10):921–933.
CrossRef - Retico A., Delogu P., Fantacci M., Gori I and Martinez P. A. Lung nodule detection in low-dose and thin-slice computed tomography.Computers in Biology and Medicine. 2008;389(4):525–534.
CrossRef - Messay T., Hardie, R., and Rogers, S.A new computationally efficient CAD system for pulmonary nodule detection in CT imagery.Medical Image Analysis. 2010; 14(3):390–406.
CrossRef - Sluimer I., Prokop M and van Ginneken B.Toward automated segmentation of the pathological lung in CT.IEEETransactions onMedical Imaging. 2005;24(8): 1025–1038.
CrossRef - Van Rikxoort E., de Hoop B., Viergever M., Prokop M and van Ginneken B. Automatic lung segmentation from thoracic CT scans using a hybrid approach with error detection.Medical.Physics. 2009;36(7):2934–2947.
CrossRef - De Nunzio G., Tommasi E., Agrusti A., Cataldo R., De Mitri I., Favetta M., Maglio S., Massafra A., Quarta M., Torsello M., Zecca M., Bellotti I., Tangaro S. I., Calvini P., Camarlinghi N.,Falaschi F., Cerello P., Oliva P. Automatic lung segmentation in CT images with accurate handling of the hilar region.Journal of Digital Imaging. 2011;24(1):11–27.
CrossRef - Paik D., Beaulieu C., Rubin G., Acar B., Jeffrey R., Yee J., Dey J and apel S. Surface normal overlap: A computer-aided detection algorithm with application to colonic polyps and lung nodules in helical CT.IEEE Transactions on Medical Imaging. 2004;23(6):661–675.
CrossRef - Armato S. G., Giger M. L., Moran C. J., Blackburn J. T., Doi K and MacMahon H. Computerized detection of pulmonary nodules on CT scans. Radiographics. 1999; 19(5):1303–1311.
CrossRef - Pulagam A. R., Kande G. B., Ede V. K. R and Inampudi R. B. Automated lung segmentation from HRCT scans with diffuse parenchymal lung diseases. Journal of Digit Imaging. 2016;29(4):507–519.
CrossRef - Golosio B., Masala G. L., Piccioli A., Oliva P., Carpinelli M., Cataldo R., Cerello, P., De Carlo F., Falaschi F., Fantacci M. E., Gargano G., Kasae P., Torsello M. A novel multi-threshold method for nodule detection in lung CT. Medical Physics. 2009;36(8):3607–3618.
CrossRef - Dehmeshki J., Ye X., Lin X., Valdivieso M and Amin H. Automated detection of lung nodules in CT images using shape-based genetic algorithm. Computerized Medical Imaging and Graphics. 2007;31(6):408–417.
CrossRef - Pu J., Paik D., Meng X., Roos J and Rubin G. Shape break-and-repair strategy and its application to automated medical image segmentation.IEEE Transactions on Visualization and Computer Graphics. 2011;17(1):115–124.
CrossRef - Osman O., Ozekes S and Ucan O. N. Lung nodule diagnosis using 3D template matching.Computers in Biology Medicine. 2007;37(8):1167–1172.
CrossRef - Suzuki K., Armato III S. G., Li F., Sone S and Doi K. Massive training artificial neural network for reduction of false positives in computerized detection of lung nodules in low-dose computed tomography.Medical Physics. 2003;30(7):1602–1617.
CrossRef - Cascio D., Magro R., Fauci F., Iacomi M and Raso G. Automatic detection of lung nodules in CT datasets based on stable 3D mass-spring models.Computers in Biology and Medicine. 2012;42(11):1098–1109.
CrossRef - Choi W. J and Choi T. S. Automated pulmonary nodule detection based on three-dimensional shape-based feature descriptor.Computer Methods and Programs in Biomedicine. 2014;113(1):37–54.
CrossRef - daSousa J. R. F. S., Silva A. C., de Paiva A. C and Nunes R. A. Methodology for automatic detection of lung nodules in computerized tomography images. Computer Methods and Programs in Biomedicine. 2010;98(1):1–14.
CrossRef - Dolejˇs´ı M and Kybic J. Automatic two-step detection of pulmonary nodules. Proceedings of SPIE, Medical Imaging, Computer-Aided Diagnosis 6514. 2007. doi: 10.1117/12.709161.
CrossRef - Otsu N. A threshold selection method from gray-level histograms.IEEE Transactions on Systems, Man, and Cybernetics. 1979;9(1):62–66.
CrossRef - Hou Z., Hu Q and Nowinski W. L. On minimum variance thresholding.Pattern Recognition Letters. 2006;27(15):1732–43.
- Osung E and Girosi F. Support vector machines: Training and applications. Tech. Rep. AIM-1602. 1997;1500–1999.

