
Manuscript accepted on :May 29, 2017
Published online on: --
Plagiarism Check: Yes
Mohammad reza obeidavi1, Ali rafiee1 and omid mahdiyar2
1Department of Biomedical Engineering, Kazeron Branch, Islamic Azad University, Kazeron, Iran,
2Department of Electrical Engineering, Kazeron Branch, Islamic Azad University, Kazeron, Iran.
Corresponding Author E-mail: Reza.obeidavi@yahoo.com
DOI : https://dx.doi.org/10.13005/bpj/1137
Abstract
The aim of the present study is to diagnose the types of thyroid disease, using neural networks. In this research, the tests (T3UR, FTI, FT4, FT3, T4, T3, TSH) were conducted on 244 subjects (30 subjects with healthy thyroid, 30 subjects suffering from hyperthyroidism, 34 subjects suffering from hypothyroidism, 30 subjects suffering from Subclinical hyperthyroidism and 30 subjects suffering from Subclinical hypothyroidism , 30 subjects suffering from hyperthyroidism treatment and 30 subjects suffering hyperthyroidism treatment, and 30 subjects with resistant thyroid) for investigating status of their thyroid by considering their age and diversity of normal range of hormone tests in various ages. Data analysis was conducted using MATLAB 2014 software to categorize the thyroid disease. For investigating authenticity of the data, by using 3-fold cross-validation, authenticity of categorization of thyroid disease was evaluated by neural networks (MLP, PNN, GRNN, FTDNN, CFNN). In this method, networks are taking 7 hormone tests and age as input, output is diagnosed with thyroid disease. Also for 40 subjects (5 subjects for each categories), new data were given to the GUI of MATLAB through the designed graphical user interface for testing the network, and all 40 data were correctly responded. Results of this research indicated that by hormone tests and using neural networks, various types of thyroid disease can be diagnosed and the neural network provides us with almost 100% correct answers.
Keywords
Neural networks; thyroid disease; hormone tests; Matlab
Download this article as:| Copy the following to cite this article: Obeidavi M. R, Rafiee A, Mahdiyar O. Diagnosing Thyroid Disease by Neural Networks. Biomed Pharmacol J 2017;10(2). |
| Copy the following to cite this URL: Obeidavi M. R, Rafiee A, Mahdiyar O. Diagnosing Thyroid Disease by Neural Networks. Biomed Pharmacol J 2017;10(2). Available from: http://biomedpharmajournal.org/?p=15267 |
Introduction
Thyroid is a small gland with the shape of a butterfly or H letter and is located at the front of windpipe and below larynx and it is consisted of two lobes attached to each other in the middle parts. The thyroid gland absorbs iodine existing in food and creates T3 and T4 hormones. This hormones flow in blood by two ways: as attached by TBG protein and in as free (free T3 and free T4). These hormones are stored in the mentioned gland and gradually in the required time they are released in blood. Hypothalamus is the regulator of thyroid hormones. It releases a hormone called thyrotropin (TRH) which goes to pituitary and pituitary releases TSH hormone in blood which stimulates thyroid gland so that it releases thyroid hormones (T3 and T4) in blood. For this reason, when level of thyroid hormone of body decreases, more TSH is released in blood and its level rises in blood and resumes to the normal level again 1.
These hormones play an important role in diagnosing thyroid disease, since thyroid hormones are very essential for normal growth of brain and neural system, especially in the first three years of life and in case of their malfunction, mental retardation might occur. Children in higher ages in order to have appropriate growth, and adults in order to have a regular metabolism and regulating the mechanism of their body, need thyroid hormones. For this reason, in some countries, at the first moment of birth, thyroid regulation test is conducted on babies. Thyroid diseases are more common among women than men. The most important factors of thyroid disease are: hyperthyroidism, hypothyroidism, autoimmune disorders, thyroid inflammation, and thyroid cancer [1].
Various modern diagnosis methods such as Elisa, Electrochemiluminescence, etc., have been proposed for conducting hormone tests (T3UR, FTI, FT4, FT3, T4, T3, TSH), and then diagnosing the type of thyroid disease and treating it. Conducting hormone tests is one of the most common diagnosis methods of thyroid disease that by using its great advantages including no negative effect on patient and low cost, the type of thyroid disease can be precisely diagnosed [1]. Nowadays, in order to diagnose diseases with high accuracy and reducing human errors existing in diagnoses of physicians, neural networks are used and they enjoy advantage of automatic diagnosis.
Neural network is a data processing system which its idea is taken from human brain and assigns process of the data to a large number of small processors that behave each other in a continuous and parallel network to solve a problem. In these networks, by applying programming knowledge, a data structure is designed that can act as neuron. Then by creating a network between these neurons and applying it a training algorithm, the network is trained. In this memory or neural networks, neurons have two states including active (on or 1) and inactive (off or 0) and each face (synapse or relation between groups) has a weight. Faces with positive weight cause stimulation or activation of the next inactive node and faces with negative weight make the next node inactive (if it was active before). The network structures used in this research include MLP, PNN, GRNN, FTDNN, and CFNN [2-3]. the network structures such as MPL, PNN, GRNN, and FTDNN ,respectively, is shown (Fig. 1 to 4 ) [4,5,6,7].
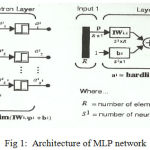 |
Figure 1: Architecture of MLP network
|
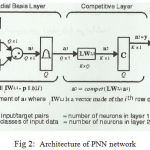 |
Figure 2: Architecture of PNN network
|
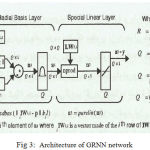 |
Figure 3: Architecture of GRNN network
|
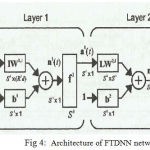 |
Figure 4: Architecture of FTDNN network
|
Cascade Forward neural network (CFNN) is similar to “feedforward” neural network but it includes a weight attachment from input to each layer and from each layer to next layers. Although the two-layer feedforward network can learn each input-output relation, the feedforward network with more layers can learn more complicated relations in a higher speed. Cascade-Feedforward neural network model with the back propagation algorithm is like a forward neural network with a back propagation algorithm for updating the weights. However, the main property of this neural network is that neurons of each layer are in relation with all neurons of the previous layer [8].
Now, considering this fact that neural networks can greatly help us with diagnosing diseases, in this research we attempted to investigate diagnosis of thyroid disease with the help of hormone tests (T3UR, FTI, FT4, FT3, T4, T3, TSH), MATLAB 2014 software, and by neural networks (MLP, PNN, GRNN, FTDNN, CFNN).
Materials and Methods
In this research, the said hormone tests were conducted for 244 subjects including 30 subjects with healthy thyroid, 34 subjects suffering from hypothyroidism, 30 subjects suffering from Subclinical hyperthyroidism and 30 subjects suffering from Subclinical hypothyroidism , 30 subjects suffering from hyperthyroidism treatment and 30 subjects suffering hyperthyroidism treatment, and 30 subjects with resistant thyroid, by considering age of the patients. Therefore, it can be mentioned that clinical property of age and seven hormone tests were defined as input and eight categories including being healthy, hyperthyroidism, hypothyroidism, Subclinical hyperthyroidism, Subclinical hypothyroidism, hyperthyroidism treatment, hypothyroidism treatment, and resistant thyroid, were defined as output. Data analysis was conducted using MATLAB 2014 software to categorize the thyroid disease. For evaluating validity of the data, by using 3- fold of cross-validation, validity of thyroid disease categorization by neural networks such as MLP, PNN, GRNN, FTDNN, and CFNN, was evaluated. For this purpose, the data were divided into three categories including 81, 81, and 82, and between each of the categories 8 types of thyroid diseases were equally divided and each category was trained for ten times. The best result of 10 times as a accurate classification of each category will be considered. The end result of each network is the average of the best results obtained for each of the categories. Also for 40 subjects (5 subjects for each categories), new data were given to the GUI of MATLAB through the designed graphic interface for testing the network.
In this work, eight outputs were defined for all networks as binary from 10000000 which is first category (normal) to 00000001 which is the eighth category (resistant thyroid) to achieve more accurate results of networks and in this case, output of networks will be between [0,1]. Also for determining category type of 8 inputs the Networks after training read the binary code as output category, or determine the decoding defined categories.
Results
Results of the present research regarding MLP, PNN, GRNN, FTDNN, and CFNN are respectively indicated in the following.
MLP Network
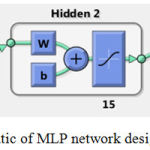 |
Figure 5: Schematic of MLP network designed in Matlab
|
For training and testing the network using 3- fold cross-validation, the data were classified into three categories including 81, 81, and 82, so that each category was trained for ten times and as a result of that, the best result obtained for each of the categories is respectively 100%, 100%, and 98.78% and their mean is 99.59%. Also for 40 subjects (5 subjects for each categories), new data were given to the GUI of MATLAB through the designed graphic interface for testing the network, and all 40 data were correctly responded. the regression diagram in the learning stage of MLP network related to the first, second, and third validation category, respectively, is shown (Diagram. 1 to 3).
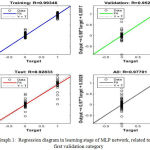 |
Graph 1: Regression diagram in learning stage of MLP network, related to the first validation category
|
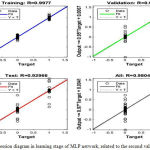 |
Graph 2: Regression diagram in learning stage of MLP network, related to the second validation category
|
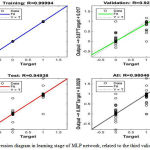 |
Graph 3: Regression diagram in learning stage of MLP network, related to the third validation category
|
PNN Network
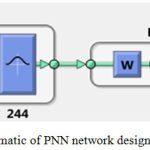 |
Figure 6: Schematic of PNN network designed in Matlab
|
For training and testing the network using 3- fold cross-validation, the data were classified into three categories including 81, 81, and 82, so that each category was trained for ten times and as a result of that, the best result obtained for each of the categories is respectively 100%, 100%, and 100% and their mean is 100%. Also for 40 subjects (5 subjects for each categories), new data were given to the GUI of MATLAB through the designed graphic interface for testing the network, and all 40 data were correctly responded. the regression diagram in the learning stage of PNN network related to the first, second, and third validation category, respectively, is shown (Diagram. 4 to 6).
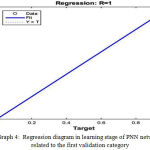 |
Graph 4: Regression diagram in learning stage of PNN network, related to the first validation category
|
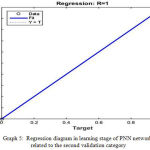 |
Graph 5: Regression diagram in learning stage of PNN network, related to the second validation category
|
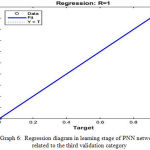 |
Graph 6: Regression diagram in learning stage of PNN network, related to the third validation category
|
GRNN Network
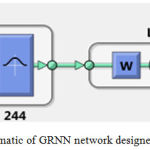 |
Figure 7: Schematic of GRNN network designed in Matalab
|
For training and testing the network using 3- fold cross-validation, the data were classified into three categories including 81, 81, and 82, so that each category was trained for ten times and as a result of that, the best result obtained for each of the categories is respectively 100%, 100%, and 100% and their mean is 100%. Also for 40 subjects (5 subjects for each categories), new data were given to the GUI of MATLAB through the designed graphic interface for testing the network, and all 40 data were correctly responded. the regression diagram in the learning stage of GRNN network related to the first, second, and third validation category, respectively, is shown (Diagram. 7 to 9).
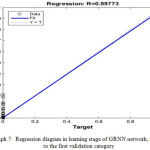 |
Graph 7: Regression diagram in learning stage of GRNN network, related to the first validation category
|
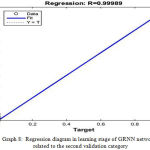 |
Graph 8: Regression diagram in learning stage of GRNN network, related to the second validation category
|
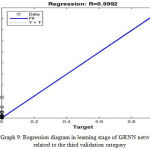 |
Graph 9: Regression diagram in learning stage of GRNN network, related to the third validation category
|
FTDNN Network
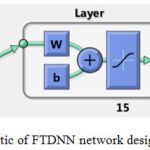 |
Figure 8: Schematic of FTDNN network designed in Matlab
|
For training and testing the network using 3- fold cross-validation, the data were classified into three categories including 81, 81, and 82, so that each category was trained for ten times and as a result of that, the best result obtained for each of the categories is respectively 100%, 98.78%, and 100% and their mean is 99.59%. Also for 40 subjects (5 subjects for each categories), new data were given to the GUI of MATLAB through the designed graphic interface for testing the network, and all 40 data were correctly responded. the regression diagram in the learning stage of FTDNN network related to the first, second, and third validation category, respectively, is shown (Diagram. 10 to 12).
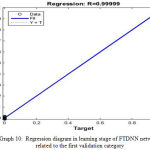 |
Graph 10: Regression diagram in learning stage of FTDNN network, related to the first validation category
|
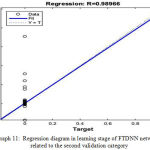 |
Graph 11: Regression diagram in learning stage of FTDNN network, related to the second validation category
|
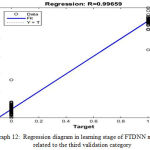 |
Graph 12: Regression diagram in learning stage of FTDNN network, related to the third validation category
|
CFNN Network
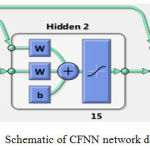 |
Figure 9: Schematic of CFNN network designed in Matlab
|
For training and testing the network using 3- fold of cross-validation, the data were classified into three categories including 81, 81, and 82, so that each category was trained for ten times and as a result of that, the best result obtained for each of the categories is respectively 100%, 100%, and 100% and their mean is 100%. Also for 40 subjects (5 subjects for each categories), new data were given to the GUI of MATLAB through the designed graphic interface for testing the network, and all 40 data were correctly responded. the regression diagram in the learning stage of CFNN network related to the first, second, and third validation category, respectively, is shown (Diagram. 13 to 15).
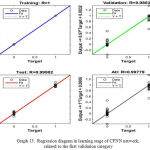 |
Graph 13: Regression diagram in learning stage of CFNN network, related to the first validation category
|
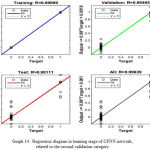 |
Graph 14: Regression diagram in learning stage of CFNN network, related to the second validation category
|
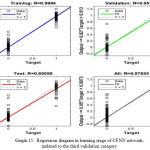 |
Graph 15: Regression diagram in learning stage of CFNN network, zrelated to the third validation category
|
Designing in GUI (Graphical User Interface) of Matlab
The aim of designing graphical interface in GUI is to facilitating user work by using this interface rather than typing various commands for testing the network the graphical interface is used which is indicated in (fig. 10). Using this graphical interface, the network can be trained using each of the networks used in this research and also the results obtained from testing the network can be demonstrated and eight inputs can be given to the network and the category related to these eight properties will be demonstrated. We gave 40 new data in addition to the 244 data used for testing the networks by this way to this graphical interface for each network and we observed that all the data were correctly categorized.
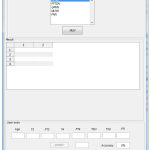 |
Figure 10: Graphical interface (GUI) designed in Matlab
|
Discussion and Conclusion
Thyroid tests are considered as the methods with the lowest side-effects for diagnosing thyroid disease which are widely being used in the process of clinical diagnosis. However, since the normal range for each age group is different, using neural networks can greatly help the physicians with easier diagnosis of thyroid status.
In this research, results of thyroid hormone tests which included seven tests such as T3UR, FTI, FT4, FT3, T4, T3, and TSH, were obtained by considering age of the patient for classifying eight categories of thyroid diseases (30 subjects with healthy thyroid, 30 subjects suffering from hyperthyroidism, 34 subjects suffering from hypothyroidism, 30 subjects suffering from Subclinical hyperthyroidism and 30 subjects suffering from Subclinical hypothyroidism, 30 subjects suffering from hyperthyroidism treatment and 30 subjects suffering from hypothyroidism treatment , and 30 subjects with resistant thyroid) and with help of five neural networks including MLP, PNN, GRNN, FTDNN, and CFNN. These results are indicated in (Table 1) and finally by training the neural networks (each network with 10 times of training with 3- fold cross-validation) thyroid status of subjects of the study were diagnosed.
Table 1: Results of MLP, PNN, GRNN, FTDNN, and CFNN networks with 10 times training and 3- fold cross-validation
| Networks | 1st Category | 2nd Category | 3rd Category | General result |
| MLP | 100 | 100 | 98.78 | 99.59 |
| PNN | 100 | 100 | 100 | 100 |
| GRNN | 100 | 100 | 100 | 100 |
| FTDNN | 100 | 98.77 | 100 | 99.59 |
| CFNN | 100 | 100 | 100 | 100 |
General Results of the Research Indicated That
Neural networks can be used in diagnosing thyroid stats.
In this study, neural networks succeeded to report 100% correct diagnosis about healthy or sick thyroid glands.
By neural networks, challenges existing in accurate diagnosis due to human errors would be minimized.
A research was conducted by Rızvan Erol et al using RBFNN and MLPNN neural networks and T3, T4, and TSH parameters were considered, and they also conducted diagnostic sonography on the thyroid gland and analyzed the data of 487 subjects to design networks which can have the best performance in classifying thyroid disease in three categories such as being healthy, hyperthyroidism, and hypothyroidism. The obtained results indicated that RBFNN network was trained in a better manner and has a better diagnosis for thyroid disease [9].
Rouhani and Mansouri conducted a research by using neural networks including RBF, PNN, GRNN, LVQ, and SVM, by considering five categories for thyroid disease such as being healthy, hyperthyroidism, hypothyroidism, hyperthyroidism under clinical conditions, and hypothyroidism under clinical conditions, and by using hormone tests such as TSH, T4, T3, TBG, FT4, FT3, T3U, by considering clinical conditions of hair loss, weight gain, dry skin, moist and warm skin, tachycardia, and heart beat for designing networks that can have the best performance for categorizing thyroid disease. The obtained results indicated that these networks can diagnose with a high accuracy, for example for diagnosing hyperthyroid disease, the GRNN network reported 99.5% positive response [10].
In a research conducted by Shukla et al. for 187 subjects, neural networks such as BPA, RBF, and LVQ were used by considering three categories, to design networks for classifying thyroid diseases. They concluded that these networks are able to diagnose thyroid disease with a high accuracy so that this extent in LVQ network reaches 98% [11].
Also in a research conducted by Temurtas, neural networks such as MLNN, PNN, LVQ were used and three categories were considered to design a network that can have the best performance for classifying thyroid disease. They concluded that these networks are able to diagnose thyroid disease with high accuracy, so that this extent in PNN network reaches 94.81% [12].
Makas and Yumusak conducted a research on 215 subjects by conducting hormone tests such as T3, T4, TSH, T3U, and maximum change of TSH after injecting thyrotropin on three categories such as being healthy, hyperthyroidism, and hypothyroidism by using MLNN, PNN, LVQ, GRNN, FTDNN, CFNN, and ENN, and optimization algorithms such as SCG, PSO, ABC, MBO, and finally resulted that these networks are able to diagnose thyroid disease with a high accuracy [13].
In a study conducted in 2015 by V. Prasad et al using architectural design combines artificial intelligence techniques ، rough data sets theory and machine learning algorithms have been succeed to diagnose thyroid disease using this architecture [14]. In a study conducted in 2012 by Li-Na Li et al using Extreme Learning Machine algorithm diagnosed thyroid disease in 215 people, including 150 healthy subjects, 35 patients with hyperthyroidism and 30 suffering from hypothyroidism with 98.1% accuracy [15].
After numerous investigations of the obtained results in the past and the results obtained in this research, it can be resulted that all of the past research are consistent with the present research and using fundamental properties such as age of patients as input of networks and also the possibility of diagnosing three new categories of thyroid disease including hyperthyroidism under treatment, hypothyroidism under treatment, and resistant thyroid is applicable and by help of neural networks in diagnosing thyroid diseases, existing challenges in accurate diagnosis due to human error would be minimized. Also it should be noted that in order to widely use these networks in the diagnosis system, following points are recommended:
By using neural networks we can design a system that by receiving various properties, can automatically diagnose various diseases.
By using neural networks we can identify the effect of various diseases on each other.
We can identify effect of various diseases on thyroid disease, by designing neural networks
Conflict of Interest
“We announce that we have no conflict of interest. “
Ethical Approval
“This article does not contain any studies with human participants performed by any of the authors.”
Informed Consent
“Informed consent was obtained from all individual participants included in the study.”
References
- R. I. S.Bayliss , W. M Tunbridge (1998) Thyroid Disease: The facts. Oxford University Press, New York.
- Martin T. Hagan, Howard B. Demuth, Orlando De Jesús (1998) Neural Network Design (2nd Edition). pws publish company, Boston.
- Seyed Mostafa Kia (2012) Neural networks in Matlab. Kian Rayaneh Sabz,Tehran.
- MartinT. Hagan, Howard B. Demuth (1999) Neural Networks for Control. Proceedings of the American Control Conference: 1642 – 1656. doi:10.1109/acc.1999.786109.
CrossRef - Jian-Da Wu, Peng-Hsin Chiang, Yo-Wei Chang, Yao-jung Shiao (2008) An expert system for fault diagnosis in internal combustionengines using probability neural network. Expert Systems with Applications 34 (4):2704–2713. doi:10.1016/j.eswa.2007.05.010
CrossRef - Navneet Gupta, Ravindra Pratap Narwaria (2014) Design Low Pass FIR Filter Using Generalized Regression Neural Network. International Journal of Signal Processing, Image Processing and Pattern Recognition 7(2):75-84. doi:10.14257/ijsip.2014.7.2.08
CrossRef - Kyaw Kyaw Htike, Othman O. Khalifa (2010) Rainfall Forecasting Models Using Focused Time-Delay Neural Networks . international Conference on Computer and Communication Engineering (ICCCE’10):1–6. doi:10.1109/iccce.2010.5556806
CrossRef - Afshin Hedayat, Hadi Davilu, Ahmad Abdollahzadeh Barfrosh, Kamran Sepanloo (2009) Estimation of research reactor core parameters using cascade feed forward artificial neural networks. Progress in Nuclear Energy 51(6-7):709-718. doi:10.1016/j.pnucene.2009.03.004
CrossRef - Rızvan Erol,Seyfettin Noyan Oğulata, Cenk Şahin, Z. Nazan Alparslan (2008) A Radial Basis Function Neural Network (RBFNN) pproach for Structural Classification of Thyroid Diseases. Journal of Medical Systems 32(3):215–220. doi:10.1007/s10916-007-9125-5
CrossRef - ModjtabaRouhani, Kamran Mansouri (2009) Comparison of several ANN architectures on the Thyroid diseases grades diagnosis. International Association of Computer Science and Information Technology- Spring Conference ( IACSITSC ’09): 526-528. doi:10.1109/iacsit-sc.2009.24
CrossRef - Anupam Shukla, Ritu Tiwari, Prabhdeep Kaur, R.R. Janghel (2009) Diagnosis of Thyroid Disorders using Artificial Neural Networks. IEEE International Advance Computing Conference:1016-1020. doi:10.1109/iadcc.2009.4809154
CrossRef - Feyzullah Temurtas (2009) A comparative study on thyroid disease diagnosis using neural networks. Expert Systems with Applications 36(1): 944-949. doi:10.1016/j.eswa.2007.10.010
CrossRef - Hasan Makas, Nejat Yumusak (2013) A Comprehensive Study on Thyroid Diagnosis by Neural Networks and Swarm Intelligence. International Conference on Electronics, Computer and Computation (ICECCO): 180-184. doi:10.1109/icecco.2013.6718258
CrossRef - V. Prasad, T. Srinivasa Rao, M. Surendra Prasad Babu (2015) Thyroid disease diagnosis via hybrid architecture composing rough data sets theory and machine learning algorithms.Soft Computing 20(3):1179-1189. doi:10.1007/s00500-014-1581-5
CrossRef - Li-Na Li, Ji-Hong Ouyang, Hui-Ling Chen, Da-You Liu (2012) A Computer Aided Diagnosis System for Thyroid Disease Using Extreme Learning Machine. Journal of Medical Systems 36(5):3327-3337. doi:10.1007/s10916-012-9825-3
CrossRef

