
Manuscript accepted on :February 11, 2017
Published online on: --
Plagiarism Check: Yes
Vladimir Valerievich Stuchilin,1 Valentina Anatolievna Rumyantseva,1 and Iliya Sergeevich Svirin2
1National University of Science and Technology MISiS.
2LLC Nordavind Dubna.
Corresponding Author E-mail: vladimir@stuchilin.com
DOI : https://dx.doi.org/10.13005/bpj/1089
Abstract
The relevance of the study is determined by the need for automatic pre-diagnosis and introduction of the diagnostic algorithms into the appropriate software. The article presents a method of processing the electrocardiogram (ECG) as well as the results of applying this method to the real ECG taken from public databases. Their Fourier and wavelet spectra are given as proposed for digital signal processing and automated diagnostics, and also a number of methods for their use are described. The problems of software development of mobile medical electrocardiographic system have been considered. It is proposed to diagnose diseases of the cardiovascular system by comparison a normalized ECG signal with the interpolation model. The outcomes of the research are of practical value for the needs of medicine, in particular for cardiology.
Keywords
Electrocardiogram; Spectral Analysis; Wavelet Transform
Download this article as:| Copy the following to cite this article: Stuchilin V. V, Rumyantseva V. A, Svirin I. S. The use of Digital Signal Processing Algorithms for Electrophysiological Diagnostics of Cardiovascular Diseases. Biomed Pharmacol J 2017;10(1). |
| Copy the following to cite this URL: Stuchilin V. V, Rumyantseva V. A, Svirin I. S. The use of Digital Signal Processing Algorithms for Electrophysiological Diagnostics of Cardiovascular Diseases. Biomed Pharmacol J 2017;10(1). Available from: http://biomedpharmajournal.org/?p=13587 |
Introduction
The most important problems of medicine is early diagnosis, prevention and treatment of cardiovascular diseases (CVD), which is impossible without the development and study of algorithms and techniques for processing electric cardiologic signal (ECS). There is a variety of devices and remote monitoring systems, which represent different ways of monitoring of physiological parameters for various human diseases by passing information from the patient to the doctor. The use of innovative advances in electronic information technologies for quick diagnostics and predicting the state of health, creation of new social medical services available to wide circles of the population, will improve the quality of life of people having the risk of a sudden death, because cardiovascular diseases are the leading cause of mortality of the population.
The majority of clinical studies of the cardiovascular system are based on an analysis of Electrocardiograms (EKG) and a number of other recorded signals, illustrating the bioelectric activity of the heart. Among the obvious advantages of such an approach is its relative simplicity, accessibility, non-invasiveness and highly informative content.
So it is quite obvious, that research and development of new methods of handling the ECS is an actual scientific challenge.
The task of automatic diagnosis of cardiovascular system can be divided into several stages. The first step is the signal processing, removing the noise and disturbances. For this step there is a variety of methods and software tools. The studies1-2 are devoted to the problem of removal of drift contours, which is low-frequency disturbance of the ECG signal, presumably connected with breathing.1 gives an overview of such techniques as: the use of digital filters, signal averaging, polynomial and wavelet approximation. Z.K. Adeyemo and S.A Olayanju3 discuss the empirical mode decomposition method, which allows working with flow of ECG information in real time. In this work the authors offer to solve the problem of removal of drift contours by spectral methods using the discrete Fourier transform.
In some cases it is necessary to “clean up” the signal from the noise and RF interference as well as from such interference, when the spectrum of frequency range coincides with the range of a useful signal. Scientific studies4-5 are dedicated to ECG signal processing problems with low value of signal-to-noise ratio. The authors suggest using wavelet transform for smoothing. Parsad Kanta Sharma and Manpreet Kaur6 compare ECG filtering methods by wavelets, fast Fourier transform and Kalman filter.
The next step in the analysis of ECG can be called getting the values of informative parameters that can be used to diagnose the state of the cardiovascular system. These are the parameters of heart rate variability such as mean RR interval, its standard deviation, the shape of the main waves and etc. So it is necessary to solve such an important task as detection of the QRS complex in the ECG. The work7 is dedicated to the review of such methods. Many authors offer their original methods of detecting QRS complex. Thus, there are descriptions of a method based on the theory of optimal estimates,8 and of the correlation-extreme method with the evaluation of its deviation.9
There are also well-known methods of QRS-complex. A brief description of the most common methods such as methods of Pan and Tompkins10 and adaptive algorithm.11 In the present paper it is proposed to use the equivalent of the adaptive algorithm described below.
And finally, the third step is the diagnosis of cardiovascular system in the form of a recognized and processed ECG. For this purpose it is suggested to use the Mathematic model of the ECG of a healthy person, as well as of a person with various pathologies. For the development of the model different approaches can be implemented. There are a number of developments in this area. Models based on Gaussian functions are described in 12-13, and a model of the ECG as the result of the rotation of a unit vector in three-dimensional space is provided in 14. Different waves may arise due to the presence of the corresponding attractors in phase space. A model is also described15 in which various segments of the ECG correspond to Markov chain states and the values of the parameters of this model are provided for a normal ECG and certain pathologies.
To compare ECG with models the authors use wavelet transform. The results of applying transformations with different wavelet functions to the ECS are present in 16. Examples of using wavelets for analysis of ECG with the help of Matlab program are given in 17-18.
Concept Headings
Scientific purpose of this work is to study, develop and implement in software the algorithms for detecting cardiovascular pathologies associated with various cardiac arrhythmias based on the use of advanced digital signal processing algorithms and pattern recognition. A separate area of research is the study of heart rate variability, the development of its mathematical model to predict the emergence and development of pathologies.
While developing new methods for automated ECG analysis and mathematical model of the cardiovascular system pathologies and heart rhythm disturbances the following methods were applied: the spectral analysis of the simulated signal; simulated signal approximation with the sum of Gaussian functions whose parameters were computed by various methods, including the least-square procedure, and while modelling signal distortion, noise and certain pathologies simulation methods were used, such as the generation of random numbers and events.
To model, obtain numerical results and plot graphs the following tools were used: Matlab mathematical modelling environment, MathCad mathematical calculation package.
Results
Model of the Electrocardiogram of a Healthy Person and a Person with a Number of Pathologies of the Cardiovascular System
Modeling of electrocardiograms is an actual scientific and practical task. The human body is an extremely complex system from the point of view of the description of the processes occurring in it at the level of the physical laws in analytical form. Therefore, the modeling of electric potentials, changing as a result of the heart, will be empirical, based on experimental results. The averaging of all the vectors of action potentials that occur at a certain moment in the heart is reflected in the ECG. Usually the ECG can be divided into five waves: P, Q, R, S, T (figure 1). Electrocardiograms represent quasi-periodic functions of a certain shape, and our task is to define the parameters and the form of this function, as well as to simulate a realistic artificial ECG shape with characteristics given.
A more detailed description of the model is given in 19. Let us choose the basic model, similar to 12. It is formed by the standard z (t), which describes the sum of symmetric Gaussian functions, unlike the one12 which uses asymmetric Gaussian function.
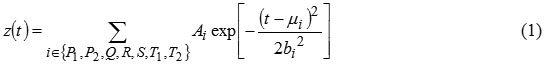
In our case, R-wave is represented as a sum of two Gaussian functions to simulate the processes in the right and left Atria separately. T-wave inversion asymmetry will be modelled by summing up two summands (T1 and T2) of the equation (1). Figure 1 shows the location of the main waves of the ECG.
Numerical values of the parameters of the function z(t) will determine the form of the electrocardiogram. We define them for ECG of healthy people and people with abnormalities of the cardiovascular system.
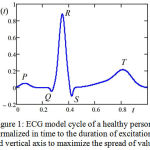 |
Figure 1: ECG model cycle of a healthy person, normalized in time to the duration of excitation and vertical axis to maximize the spread of values
|
Figure 1 shows the form of a single ECG normal sinus rhythm. Its appearance was reproduced according to the open database20 for the ECG of a healthy person in the first lead (ECG1) snapshot.
Figure 2 shows the shape of the heart rate for the normal sinus rhythm (curve a) in blue color, and extrasystole heart rate (curves b, c, d) in red color. The models were made according the examples of real ECG given in 21.
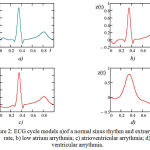 |
Figure 2: ECG cycle models a)of a normal sinus rhythm and extrasystole rate, b) low atrium arrythmia; c) atrioventricular arrythmia; d) ventricular arrythmia.
|
According to these basic cycles, an ECG model (artificial ECG) with specified characteristics: frequency of cardiac contractions (heart rate), average height of RS-waves can be modeled. An example of the ECG for the case of ventricular extra systole is shown in Figure 3. The model accounts for changes in the duration of RR-interval. They are considered to be normally distributed. Their mathematical expectation corresponds to HR = 60 1/min. (the average period of RR = 1000 msec.), the standard RMS deviation = 20 msec. Sampling frequency 500 Hz. Noise, distributed by the normal law with parameters (1= 0 MV, 2 = 0.02MV), is superimposed at the simulated signal.
In addition, drift isoline is simulated. The contour is considered to be varying as sinus with a frequency of 15 1/min (respiratory rate) and amplitude of 0.12 mV.
 |
Figure 3: Artificial ECG case of ventricular extrasystole
|
The simulation object is the electrocardiogram, which represents an implementation of a quasi-periodic random process. Therefore, when developing a model we use statistical methods of experimental data processing. The result of the simulation is a function of some characteristic species, so for its generation in each period interpolation methods are used. “Period” is understood as a cardiac contraction cycle, which, generally speaking, is also a random variable. The value of the period is generated at each step with the help of a random number generator that allows us to talk about the use of simulation methods. This method allows you to simulate ECG abnormalities, such as arrhythmias of various kinds, as well as arrhythmia, in which the waves of different cycles superimpose at each other.
In addition, the model takes into account all the electric noises, which are superimposed on the main signal and are generated by pseudo-random number generator, as well as drift contour, which is represented in the form of a sine wave with a frequency close to the frequency of breathing, similar to 14.
ECG Signal Processing Methods
In order to produce a quantitative comparison, experimental ECG must be processed and quantitative characteristics should be obtained. They will enable you to check the adequacy of the model, as well as to make the preliminary diagnosis of the patient, whether he has or not any pathology according to his ECG.
Typically, diagnosis based on the electrocardiogram is performed by a physician who examines the image printed on graph paper. For an automatic diagnosis ECG should de digitized (if it is not yet in a digital form) and quantitative characteristics should be obtained. They will enable you to draw conclusions about the state of the cardiovascular system of the patient or to compare investigated ECG options with the model.
Let’s consider the methods of the ECG quantitative characteristics to evaluate the state of the cardiovascular system. To analyze the shape of the heart rate it is necessary to allocate a separate rate out of the range. To obtain the main characteristics of heart rate variability we use spectral methods.
Suppose we have a digitized (or obtained with the help of a digital device) ECG signal. Let us denote its values Fn, tn – moments of time corresponding to these values, where n = 0,1…N-1, N – sample size data. Sampling frequency is
We calculate complex signal spectrum on the formula of the discrete Fourier transform.
where k = 0…N-1, i is the imaginary unit.
Half values up to N=Sk/2 has its physical meaning. The other components of the spectrum are mirrored and are only used when computing the inverse transform. Sk component of the spectrum corresponds to the frequency

For the function f (t), analytically specified in the interval [0, T], the spectrum is calculated by the formula:
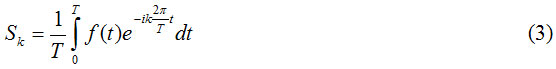
Figure 4 shows the amplitude spectrum of the electrocardiogram based on the record data No. 16773.20 Frequency (Hz) is indicated horizontally, and the amplitude, corresponding to the harmonics (mV) is indicated vertically. The solid line (with circles) is the spectrum of the one cycle model of the normal heart calculated by the formula (3). The dotted line (with crosses) is the one cycle spectrum ECG record; the potty-dotted line is the entire spectrum record. It is evident that all the spectra have a maximum at zero. This means that ECG has a constant component. The first peak of the spectrum of the entire record that coincides with the first point of a cycle corresponds to the heart rate.
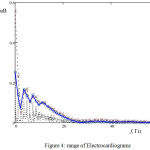 |
Figure 4: range of Electrocardiograms
|
The normalized autocorrelation function is calculated by the formula
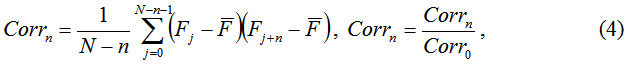
where (1) is the average value of the sample data.
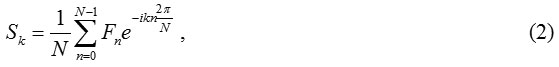
The spectral density is calculated by the autocorrelation function as its Fourier image (2).
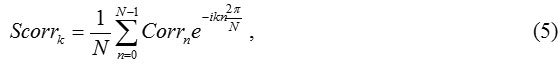
The maximum of spectral density function Scorr(f1) corresponds to the frequency of heart rate (HR)which is one of the main characteristics of the ECG. According to the HR value such diseases as tachycardia and bradycardia are diagnosed. The HR value can also determine the averaged amount of the RR – period.
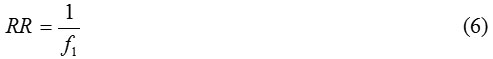
The RR interval corresponding to the distance between peaks of neighboring waves R, is equal to duration of one cardiac cycle and is perhaps the most important characteristic of a normal ECG. By interpreting the sequence of duration of these intervals we can tell if there is some cardiovascular disease. This approach is called the cardiac rhythm variability analysis (CRV). The heart rate is usually measured in 1/min: heart rate [1/min)] = 60*heart rate [Hz] = 60 000/RR [msec].
The next step is to eliminate the zero offset potential, the so-called “drift contour”. This will exclude from the ECG spectrum all the lower harmonics to N1 corresponding to f1 (and the corresponding mirror closest to N), and we can reconstruct the signal.
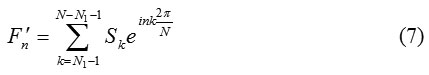
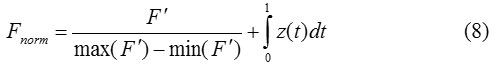
First we normalize signal vertically, adding the average value of the normal ECG cycle, which was deducted when filtering the lower frequencies.
Next, the normalized signal is divided by the periods and is transformed by the time relative to the duration of the excitation Tsinaps. Thus we get a family of curves, each of which corresponds to the period of cardiac contraction. To synchronize them by time we must calculate the time shift of the beginning of each excitation regarding the notional start of the corresponding period of the ECG Tsdvigm, where m=1… Nperiod, Nperiod – number of periods in the electrocardiogram. The index of the maximum value in each period will be denoted by Nmax.
Tsdvigm = Nmaxm Δt-0.35 Tsinaps
Tsdvig parameter values characterize different duration periods. If these values are heavily scattered, we may speak about arrhythmia. If the value of the parameter Tsdvig of some period is small, compared to the average value of this parameter, it is possible that this reduction is extrasystoles.
The results of these operations are shown in Figure 5. The solid line shows a graph model of a normal ECG cycle, and the dashed line shows the individual normalized cycles of real electrocardiogram, taken from the Archive of digital recordings of physiologic signals and related data20 (record No. 16272).
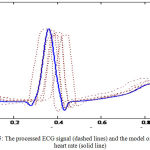 |
Figure 5: The processed ECG signal (dashed lines) and the model of the normal heart rate (solid line)
|
The use of Wavelet Spectra for Electrophysiological Diagnostics
Let’s consider the ECG spectrum, calculated on the basis of wavelet transform. As a forming wavelet function we take the WAVE – wavelet.22 In this case:
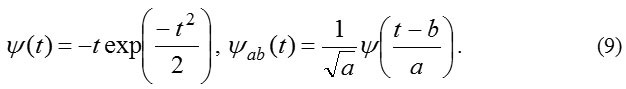
The wavelet spectrum is calculated by the formula:
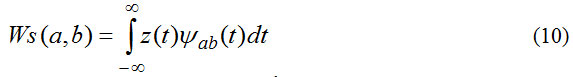
Let us compute the wavelet spectrum of the normalized function z(t). As it is defined in the interval [0, 1], infinite limits in integral (9) can be replaced by the limits 0 and 1. For this we use the program MathCad. We build this two-parameter spectrum as a graph surface in accordance with (Figure 6). On axes x and y we show the values of the parameters a and b, respectively, multiplied by 100.
 |
Figure 6: Wavelet spectrum of Electrocardiograms (WAVE-Wavelet)
|
Calculating the discrete spectrum it is necessary to choose the right way of the range of integer values that characterize a and b. This spectrum is highly informative because the model represents a sum of functions similar to forming wavelet functions.
We use Wavelet transform to compare shapes of cycles of the ECG models. Let’s consider the case shown in Figure 2. It is the ECG for a normal sinus rhythm and for three types of extrasystole. Since the main difference is in the form of P wave, that is, at the beginning of the graph, we use the plane b=0 of the wavelet spectrum (Figure 6). Compare the wavelet spectra of the individual cycles of the ECG with spectra models. Graphs of the corresponding spectra depending on the parameter a are shown in Figure 7.
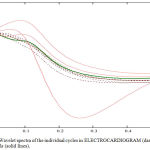 |
Figure 7: Wavelet spectra of the individual cycles in ELECTROCARDIOGRAM (dashed lines) and models (solid lines).
|
The graph shows that the dotted lines are closer to a bold green line which is a range of models with normal ECG. So we can conclude that the studied ECG belongs to a healthy person. This conclusion is confirmed by calculating the sum of squares of deviations of functions of normalized spectra of the signal and models.
Discussion
A mathematical model of the electrocardiogram has been developed, which is based on signal representation as a sum of symmetric Gaussian functions. A similar idea is used in 12; however, in the present work the authors used asymmetric Gaussian functions, while in the developed model the asymmetry of the wave is modeled with the sum of two symmetric functions of waves R and T, which makes the wavelet analysis of a signal easier and allows to simulate different types of atrial arrhythmia. A similar model is demonstrated in 22 where there is a sum of symmetric Gaussian functions, however, t-and r-COGS are presented as a single term that does not enable to show their asymmetry. The model presented in 14 considers the ECG as the projection of the motion of the unit vector in three-dimensional space, where quasiperiodicity is created by rotation in the plane (x, y), and the presence of waves is determined by attractors in phase space. However, to produce artificial ECG with the help of this model we have to solve a system of differential equations, which significantly complicates the algorithm. In addition, simulation of arrhythmia and extrasystole in this case is very problematic. Therefore, the model presented by the authors, is optimal for solving the problems of the individual electrophysiological diagnostics.
Conclusion
Methods of analysis and processing of Electrocardiograms have been considered. The interpolation ECG model of a healthy person and the ECG model with arrhythmia of different types were obtained
Fourier and wavelet spectra of real ECG and its model have been built. The article gives also the description of the method for the real ECG normalization.
These studies are of a general nature, and its results will be used in the creation of an information system for individual electrophysiological diagnosis of cardiovascular diseases based on the use of modern algorithms of digital signal processing and pattern recognition of automatic analysis of ECG and preliminary diagnosis. Application of pattern recognition algorithms is not a traditional task for automatic analysis of electrocardiograms which allows anticipating receiving qualitative and innovative results in the field.
Acknowledgements
The work is done in the framework of the Federal target program “Research and development on priority directions of development of scientific-technological complex of Russia for 2014-2020″, agreement No. 14.576.21.0083 (RFMEFI57614X0083) of 28.11.2014 on the “Software development of mobile medical system for individual electrophysiological diagnosis of cardiovascular diseases based on the use of modern algorithms of digital signal processing and pattern recognition”.
References
- Kaur M, Singh B, Seema JC. Comparisons of Different Approaches for Removal of Baseline Wander from ECG Signal. 2nd International Conference and workshop on Emerging Trends in Technology (ICWE T) 2011, pp 30-36. DOI:10.1145/1980022.1980307
- Lele VR, Holkar KS. Removal of Baseline Wander from ECG Signal. International Conference on Recent Trends in engineering & Technology-2013 (ICRTET’2013) Special Issue of the International Journal of Electronics, Communication & Soft Computing Science & Engineering, ISBN No.: 978-81-926080-0-6/22-24, pp 60-65.
- Adeyemo ZK, Olayanju SA. Electrocardiogram Signals Error Correction Using Empirical Mode Decomposition Based Technique International Journal of Applied Science and Technology 2013, 3(2); pp 44-54. http://www.ijastnet.com/journals/Vol_3_No_2_February_2013/8.pdf Date accessed: 12/08/2016.
- Mochimaru F, Fujimoto Y, Ishikawa Y. Detecting the Fetal Electrocardiogram by Wavelet Theory-Based Methods. Progress in Biomedical Research, 2002, 7(3), pp 185-193. http://www.uinet.or.jp/~ishiyasu/200207030185.pdf. Date accessed: 12/08/2016.
- Rai HM, Trivedi A. De-noising of ECG Waveforms based on multi-resolution Wavelet Transform. International Journal of Computer Applications (0975-8887). 2012, 45(18), 25-30. http://citeseerx.ist.psu.edu/viewdoc/download?doi=10.1.1.673.8435&rep=rep1&type=pdf. Date accessed: 12/08/2016.
- Sharma PS, Kaur M. Comparison of Different ECG Denoising Techniques Based on PRD & Mean Parameters International Journal of a Multidisciplinary and Current Research. ISSN: 2321-3124 2014, 2, pp 230-233. http://ijmcr.com/wp-content/uploads/2014/03/Paper8230-2331.pdf. Date accessed: 12/08/2016.
- Köhler B-U, Hennig C, Orglmeister R. The Principles of Software QRS Detection. IEEE Engineering in Medicine and Biology, 2002, 21(1), pp 42-57. DOI: 10.1109/51.993193
- Shulgin VI, Zaderihin AK, Antonchik ON. Detection of electro-signal QRS-complexes in low signal-to-noise ratios. ISSN 1814-4225. Radioelectronic and Computer Systems. 2015, 2(72), pp 58-68. http://www.khai.edu/csp/nauchportal/Arhiv/REKS/2015/REKS215/Shulgin.pdf. Date accessed: 19/08/2016.
- Zharinov OO, Zharinov IO. Correlation-Extreme Method for Detection Tasks Solution and Time Points Estimation of QRS-Complexes in an Electrocardiogram. Laser and Medical Technology, Scientific and Technical Bulletin of St. Petersburg State University of Information Technologies, Mechanics And Optics, 2011, 5 (75)-r. 85-90. http://cyberleninka.ru/article/n/primenenie-korrelyatsionno-ekstremalnogo-metoda-dlya-resheniya-zadach-obnaruzheniya-i-otsenivaniya-polozheniy-opornyh-tochek-qrs. Date accessed: 19/08/2016.
- Pan J, Tompkins WJ. A Real-time QRS Detection Algorithm. IEEE Transactions on Biomedical Engineering. 1985, 3, pp 230-236. DOI:10.1109/TBME.1985.325532
- Fadin VS. Algorithms for Selection of QRS complex in ECG. 2010. http://ilab.xmedtest.net/?q=node/126 Date accessed: 03/12/2011.
- T. Ju. Bekler , Modeling of artificial electrocardiogram of normal and pathological forms. Cybernetics and Computer Engineering. 2012, 169, 19-33. ISSN 0452-9910. http://dspace.nbuv.gov.ua/handle/123456789/45869. Date accessed: 19/08/2016.
- Awal A, Mostafa SS, Ahmad M. Simplified Mathematical Model For Generating the ECG Signal and Fitting the Model Using Nonlinear Least Square Technique. Proceedings of the International Conference on Mechanical Engineering 2011 (ICME2011) 18-20 December 2011, Dhaka, Bangladesh ICME11-RT-001, pp 1-6. http://www.academia.edu/1196836/SIMPLIFIED_MATHEMATICAL_MODEL_for_GENERATING_ECG_SIGNAL_and_FITTING_THE_MODEL_USING_NONLINEAR_LEAST_SQUARE_TECHNIQUE. Date accessed: 19/08/2016.
- Mcsharry PE, Clifford G, Tarasenko L, Smith LA. A dynamical model for generating synthetic electrocardiogram signals. IEEE Transaction on Biomedical engineering. 2003, 50(3), pp 289-294. https://www.physionet.org/physiotools/ecgsyn/paper/. Date accessed: 19/08/2016.
- Andreão RV, Dorizzi B, Boudy J. ECG Signal Analysis through Hidden Markov Models. IEEE Transactions on Biomedical Engineering, 2006, 53(8), 1541-1549. DOI: 10.1109/TBME.2006.877103
- Addison PS. Wavelet transforms and the ECG: a review. Institute of Physics Publishing Physiological Measurement Physiol. MEAs. 2005, 26, R155-R199 DOI: 10.1088/0967-3334/26/5/R01
- Ojha DK, Subashini M. Analysis of Electrocardiograhp (ECG) Signal for the Detection of Abnormalities Using MATLAB. World Academy of Science, Engineering and Technology, International Journal of Medical, Health, Bioengineering and Pharmaceutical Engineering. 2014, 8(2), pp 120-123. http://waset.org/publications/9997734/analysis-of-electrocardiograph-ecg-signal-for-the-detection-of-abnormalities-using-matlab. Date accessed: 19/08/2016.
- Saritha C, Sukanya V, Y. Narasimha Murthy ECG Signal Analysis Using Wavelet Transforms. Bulg. J. Phys. 2008, 35, pp 68-77. http://citeseerx.ist.psu.edu/viewdoc/download?doi=10.1.1.555.5695&rep=rep1&type=pdf. Date accessed: 19/08/2016.
- Stuchilin VV, Rumyantseva VA, Svirin IS. Developing Electrocardiogram Mathematical Model for Pathological Conditions Cardiovascular and Cardiac Arrhythmia, Indian Journal of Science and Technology, 2015, 8(S10), DOI: 10.17485/ijst/2015/v8iS10/84847.
- Archive of digital recordings of physiologic signals and related data. http://www.beecardia.com/physiobank date of treatment (27.02.2015)
- Shchuchko A, Shchuchko A. ECG is within everybody’s power. Minsk: A.N. Varaksin, 2014. ISBN 978-985-7092-77-2 http://medfors.ru/videokurs-ekg. Date accessed: 24.03.2015.
- Smolentsev NK. Foundations of the theory of wavelets. Wavelets in MATLAB. Мoscow: DMK Press, 2005. ISBN 5_94074_122_3

