
Manuscript accepted on :March 06, 2017
Published online on: --
Plagiarism Check: Yes
G Gnananandar1, KMK Masthan2, Aravindha Babu N2 and Jenita Jacobina2
1Sri Lakshshmi Narayana Institute of Medical Sciences, Bharath University, Puducherry.
2Department of Oral Pathology, Sree Balaji Dental College and Hospital, Bharath University, Chennai.
Corresponding Author E-mail: gnanam.anu.rg@gmail.com
DOI : https://dx.doi.org/10.13005/bpj/1121
Abstract
To compare the nuclear cytoplasmic ratio in different grades of oral epithelial dysplasia and oral Squamous cell carcinoma. Sample Collection: 400 Samples of Oral Squamous cell carcinoma and Oral dysplasia Haematoxylin and Eosin stained slides reported for the past 3 years at Sree Balaji Dental College & Hospital, Chennai. Group- A (n=200) Oral Squamous cell carcinoma Group – B (n=200) Oral Dysplasia. Mean value of cellular and nuclear perimeter will be calculated and nuclear using 40x MagnificationThe mean nuclear cytoplasmic ratio in the ITF revealed that the cytoplasmic area was decreased in moderately-differentiated Squamous cell carcinoma and was 1:1.70but increased in well-differentiated Squamous cell carcinoma, with a ratio of 1:1.77.Similarly, the nuclear cytoplasmic ratio in the main tumor showed decrease in cytoplasmic area in moderately-differentiated Squamous cell carcinoma with a ratio of 1:1.83 and an increase(1:1.94) in well-differentiated Squamous cell carcinoma The statistical analysis was done using ANOVA. The comparison between well and moderately differentiated carcinoma as well as carcinoma Vs severe dysplasia was significant (p=0.000*). The Bryne’ s grading system may be considered a reliable diagnostic tool in the grading of Squamous cell carcinomas at ITF to determine the aggressiveness of the tumor coupled with the real time measurements to prevent inter-observer variations.
Keywords
Histomorphometric; dysplasia; Squamous; carcinoma; analysis
Download this article as:| Copy the following to cite this article: Gnananandar G, Masthan K, Babu A. N, Jacobina J. Histomorphometric Analysis of oral Epithelial Dysplasia and oral Squamous Cell Carcinoma. Biomed Pharmacol J 2017;10(1). |
| Copy the following to cite this URL: Gnananandar G, Masthan K, Babu A. N, Jacobina J. Histomorphometric Analysis of oral Epithelial Dysplasia and oral Squamous Cell Carcinoma. Biomed Pharmacol J 2017;10(1). Available from: http://biomedpharmajournal.org/?p=13898 |
Introduction
The term ‘dysplasia’ originates from a Greek word meaning abnormal proliferation of tissues with an alternation in size, shape and organization of adult cells. Reagon in 1958 coined the term dysplasia, to describe the cells exfoliated from the uterine cervix1. Dysplasia more likely progresses to cancer. Pindborg (1977) defined epithelial dysplasia as the term used for a lesion in which part of thickness of the epithelium is replaced by cells showing varying degrees of atypia. The sum total of these physical and morphological alterations are of diagnostic and prognostic significance and are designated as precancerous changes2. Dysplastic epithelium was found in 5- 25% of biopsy samples of the leukoplakia3.The diagnosis and grading of oral epithelial dysplasia is based on a combination of architectural and cytological changes4. Thus early detection and intervention can prevent its progression to squamous cell carcinoma5. More than 90% of malignant neoplasm of the oral cavity and oropharynx are Squamous cell carcinomas5. The grading system commonly followed is that proposed by Broder and is designated as well, moderate and poorly differentiated carcinomas6. Most decisions for cancer patients are now made on the basis of prognostic and predictive factors. Recent work indicates that morphological and functional characteristics of the invasive tumour front underlie the biological aggressiveness of oral cancer. Incorporation of these concepts into a prognostic system will better reflect the biologic diversity of oral cancer and more accurately predict clinical outcomes and responses to particular types of adjuvant therapy.
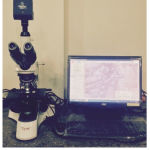 |
Figure 1: Progres Image Analysis Software
|
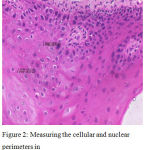 |
Figure 2: Measuring the cellular and nuclear perimeters in micrmeter in a severe dysplasia slide. H and E, 40x
|
Aims and Objectives
To compare the nuclear cytoplasmic ratio in different grades of oral epithelial dysplasia and oral Squamous cell carcinoma
To compare the nuclear cytoplasmic ratio of invasive tumour front with Brynes grading system
To determine the nuclear cytoplasmic ratio in the invasive tumour front and main tumour
To determine the aggressiveness of the lesion using histomorphological features.
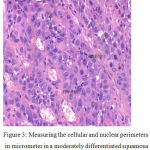 |
Figure 3: Measuring the cellular and nuclear perimeters in micrometer in a moderately differentiated squamous cell carcinoma. H and E, 40x
|
Table 1
| ANOVA | |||||
| RATIO | |||||
| Sum of Squares | df | Mean Square | F | p Value | |
| Between Groups | 1.559 | 4 | .390 | 7.168
|
0.000*
|
| Within Groups | 6.906 | 127 | .054 | ||
| Total | 8.466 | 131 | |||
| *p Value Significant at the level <0.05 | |||||
Materials and Methods
All the Oral Squamous cell carcinoma and Oral dysplasia Haematoxylin and Eosin stained slides reported for the past 3 years (2012-2014) from the Department of Oral Pathology, Sree Balaji Dental College and Hospital. All the slides will be reviewed by the senior pathologist.
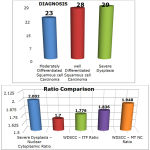 |
Graph 1 |
Group- A (n=200) Oral Squamous cell carcinoma Group – B (n=200) Oral Dysplasia. Total number of slides to be examined= 400
Samle Size
Methodology
All the oral Squamous cell carcinoma slides will be focused under 40x. The ITF will be graded as per Bryans grading7. The perimeter of cell membrane and nuclear membrane often cells each will be measured from 10 high-power fields. The measurement will be done at the centre of the tumour and at ITF8. Mean value of cellular and nuclear perimeter will be calculated and nuclear cytoplasmic ratio will be calculated separately for both ITF and main tumor. Similarly in mild, moderate and severe oral epithelial dysplasia, the perimeter of the cell membrane and nuclear membrane of ten cells from each of 10 fields, from the basal, parabasal and mid portion of spinous layer will be measured. Mean value of cellular and nuclear perimeter will be calculated and nuclear cytoplasmic ratio will be calculated separately for basal, parabasal and mid portion of spinous layer9. The nuclear cytoplasmic ratios will be compared from all the grades of Dysplasia and Oral Squamous cell carcinoma. The measurements of the nucleus and cytoplasm in OSCC and OED were done on the computer screen using the image analysis software.
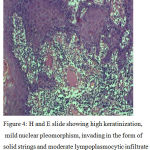 |
Figure 4: H and E slide showing high keratinization, mild nuclear pleomorphism, invading in the form of solid strings and moderate lympoplasmocytic infiltrate at ITF. H and E, 20x(Bryne’s total score=6)
|
Measurements
All measurements were done under 40 x magnifications. The measurements were done on atleast10 cells/focus in 10 high power fields in the mid tumor and in the ITF. In each high power fields the cells with well delineated cellular out line were used for the study. The measurements of cytoplasm and nucleus were done by drawing a continuous line around the perimeter of the cell membrane and nuclear membrane10. The measurements were obtained directly in micrometers. Mean value of cellular and nuclear perimeter were calculated and nuclear cytoplasmic ratio was be calculated separately for both ITF and main tumor. Similarly, in severe dysplasia, the perimeter of cell membrane and nuclear membrane of 10 cells from each of the 10 fields, from the mid portion of spinous layer were measured. Mean value of cellular and nuclear perimeter was calculated and nuclear cytoplasmic ratio was calculated separately11. The nuclear cytoplasmic ratios were compared for dysplasia and Squamous cell carcinomas12.
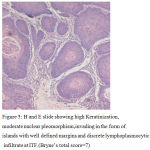 |
Figure 5: H and E slide showing high Keratinization, moderate nuclear pleomorphism,invading in the form of islands with well defined margins and discrete lymphoplasmocytic infiltrate at ITF.(Bryne’s total score=7)
|
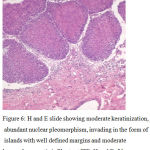 |
Figure 6: H and E slide showing moderate keratinization, abundant nuclear pleomorphism, invading in the form of islands with well defined margins and moderate lympoplasmocytic infiltrate at ITF. H and E, 20x (Bryne’s total score=8)
|
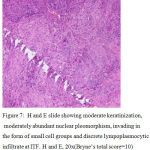 |
Figure 7: H and E slide showing moderate keratinization, moderately abundant nuclear pleomorphism, invading in the form of small cell groups and discrete lympoplasmocytic infiltrate at ITF. H and E, 20x(Bryne’s total score=10) Click here to View figure |
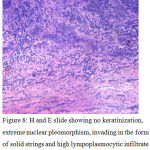 |
Figure 8: H and E slide showing no keratinization, extreme nuclear pleomorphism, invading in the form of solid strings and high lympoplasmocytic infiltrate at ITF. (photomicrograph showing ITF with Bryne’s total score=11) H and E, 20x.
|
Results
Among the 80 cases of severe dysplasia’s, well-differentiated and moderately differentiated Squamous cell carcinoma selected, the mean age was found to be 51.26 years .A male predilection was seen among the selected cases, with 66.3% of male patients and 33.8% of female patients The frequency distribution based on histopathologic diagnosis was 23 cases of moderately differentiated Squamous cell carcinoma, 28 cases of well-differentiated Squamous cell carcinoma and 29 cases of severe dysplasia. On histomorphometric studies, the mean nuclear cytoplasmic ratio in the ITF revealed that the cytoplasmic area was decreased in moderately-differentiated Squamous cell carcinoma and was 1:1.70but increased in well-differentiated Squamous cell carcinoma, with a ratio of 1:1.77.Similarly, the nuclear cytoplasmic ratio in the main tumor showed decrease in cytoplasmic area in moderately-differentiated Squamous cell carcinoma with a ratio of 1:1.83 and an increase(1:1.94) in well-differentiated Squamous cell carcinoma , while the cytoplasmic area was still higher in severe dysplasia For all calculations, the nuclear area was kept at a constant value, as The cytoplasmic area was found to be decreased in moderately-differentiated Squamous cell carcinoma both at the ITF and in the main tumor.
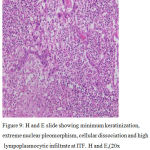 |
Figure 9: H and E slide showing minimum keratinization, extreme nuclear pleomorphism, cellular dissociation and high lympoplasmocytic infiltrate at ITF. H and E,(20x (Bryne’s total score=13)
|
Discussion
The total Bryne’s grading for the selected cases in our study ranged from 5-16. Nuclear pleomorphism was markedly increased for a total score of 13. While comparing the nuclear cytoplasmic ratio of cases with severe dysplasia, ITF for moderately-differentiated and well-differentiated Squamous cell carcinoma and the main tumor, it was found that the degree of pleomorphism consistently increased from severe dysplasia to moderately differentiated SCC. The sum of the squares between groups and within groups was found to be 1.55 and 6.90 respectively through ANOVA. P value was 0.00 and was significant. Multiple comparisons were done using Tukey HSD to determine the P value.
Conclusion
The comparison of nuclear cytoplasmic ratio in epithelial dysplasia and oral Squamous cell carcinoma showed significant differences between the two groups. Nuclear cytoplasmic ratio of invasive tumour front also showed significant correlation with Brynes grading system, increasing consistently as the total Bryne’ s score increased. The nuclear cytoplasmic ratio at the ITF was increased when comparing with the main tumor showing the aggressiveness of the lesion at ITF. The total Bryne’s grading for the selected cases in our study ranged from 5-16. Nuclear pleomorphism was markedly increased for a total score of 13. Thus the Bryne’ s grading system may be considered a reliable diagnostic tool in the grading of Squamous cell carcinomas at ITF to determine the aggressiveness of the tumor coupled with the real time measurements to prevent inter-observer variations. The comparison between well and moderately differentiated carcinoma as well as carcinoma Vs severe dysplasia was significant (p=0.000*). Multiple comparisons were done using Tukey HSD to determine the P value which also revealed significant results. Further histomorphometric studies correlating with Bryne’s grading are required which may throw more light on the prognosis and target therapies that can be tailored for each patient.
Conflict of Interest
Nil
References
- Ali Mahmoud M. Edris, Ahmed HG, Mohammed EL. Accuracy of oral exfoliative cytology in Sudanese patients undergoing oral biopsy. RSBO. 2011 Jul-Sep;8(3):255-60 – 257
- Amarasinghe HK, Johnson NW, Lalloo R, Kumaraarachchi M, Warnakulasuriya S Derivation and validation of a risk-factor model for detection of oral potentially malignant disorders in populations with high prevalence. Br J Cancer. 2010 Jul 27; 103(3):303-9.
- Avon SL. Oral Mucosal Lesions Associated with Use of Quid. J Can Dent Assoc 2004; 70(4):244-8.
- Barnes L, Eveson JW, Reichart P, Idransky SD. World health organization classification of tumours. Pathology and genetics of head and neck tumours IARC Press: Lyon 2005: 177-79.
- Brothwell DJ, Lewis DW, Bradley G, Leong I, Jordan RC. Observer agreement in the grading of oral epithelial dysplasia. Community Dent Oral Epidemiol 2003;31:300-5.
- Califano J, Westra WH, Meininger G, Corio R, Koch WM, Sidransky D. Genetic progression and clonal relationship of recurrent premalignant head and neck lesions. Clin Cancer Res 2000; 6: 347-52.
- Chocolatewala NM, Chaturvedi P. Role of human papilloma virus in the oral carcinogenesis: An Indian perspective. J Cancer Res Ther 2009;5:71-7.
- Chocolatewala N, Chaturvedi P, Desale R. The role of bacteria in oral cancer. Indian J Med Paediatr Oncol 2010;31:126-31.
- Garg KN,Raj V, ChandraS,Trends in frequency and duration of tobacco habit in relation to potentially malignant lesion: A 3 years retrospective study J Oral Maxillofac Pathol.2013; 17( 2 ): 201-206
- Gupta PC, Mehta FS, Pindborg JJ, Aghi MB, Bhonsle RB, Daftary DK, Murti PR, Shah HT, Sinor PN, Intervention study for primary prevention of oral cancer among 36 000 Indian tobacco users. 1986 May 31; 1(8492):1235-9.
- Gupta PC. Survey of socio-demographic characteristics of tobacco use among 99,598 individuals in Bombay, India using handheld computers. Tobacco Control 1996; 5:114–20.
- IARC (2004a). Tobacco smoke and involuntary smoking. IARC MonogrEvalCarcinog Risks Hum, 83: 1–1438. PMID: 15285078.

