
Manuscript accepted on :March 20, 2017
Published online on: --
Plagiarism Check: Yes
Chinnaiyan Ponnuraja1, Babu C Lakshmanan2, Valarmathi Srinivasan3 and Krihsna Prasanth B4
1Department of Statistics, National Institute for Research in Tuberculosis (ICMR), Chennai, India.
2Cognizant Technology Solutions Chennai, India.
3Department of Epidemiology, The TamilNadu Dr.MGR Medical University, Chennai, India.
4Department of Oral Pathology (COCPAR), Sree Balaji Dental College and Hospital, Bharath University, Pallikaranai, Chennai-600100.
Corresponding Author E-mail: cponnuraja@nirt.res.in
DOI : https://dx.doi.org/10.13005/bpj/1107
Abstract
Data mining is the foremost technique in health care industry which helps in uncovering data patterns in large volume of data. The breast cancer is one of the most prevalent cancers in the world that has enough potential to be studied by data mining techniques. . While taking treatment decision for Breast Cancer multiple factors are to be considered. SEER Breast Cancer data is analyzed to extract an accurate model of patients survival using data mining technique like decision tree algorithm, classification and pattern recognition. Evolving from breast cancer insights, decision tree algorithm can employ multiple factors in resolving prediction, classification, pattern recognition, and pattern completion. SEER data set pertained to patients suffering from breast cancer is used to extract an accurate model to identify the survival of patients by data mining techniques. To achieve better prediction of the breast cancer patients’ survivability, only seven features are identified from the available features as important for the analysis. After feature identification, pre-processing of the data is done, like deletion of records with insufficient/missing information, and then all the identified features are being used in Decision Tree algorithm. The objective is to compare predictive results classifying breast cancer patients (both male and female) with decision tree algorithm using age categorization. By means of this algorithm, we predict the risks of female breast cancer patients’ mortality rate as 95.1% in the age group 42-52 years along with other risk factors. The prediction and risks factors for male are also achieved equally. Decision tree algorithm concludes with a path for highest survival rate (96.4%) and the highest death rate (95.1%). The result is cross validated using logistic regression. Female and male breast cancer patients in the age group (42-52) and (<42) are identified as high risk groups respectively. The proposed approach helps the clinicians with high risk group reference and to plan for the patient’s treatment accordingly.
Keywords
Data Mining; Decision Tree; CHAID; SEER; Breast Cancer
Download this article as:| Copy the following to cite this article: Ponnuraja C, Lakshmanan B. C, Srinivasan V, Prasanth B. K. Decision tree Classification and Model Evaluation for Breast Cancer Survivability: A Data Mining Approach. Biomed Pharmacol J 2017;10(1). |
| Copy the following to cite this URL: Ponnuraja C, Lakshmanan B. C, Srinivasan V, Prasanth B. K. Decision tree Classification and Model Evaluation for Breast Cancer Survivability: A Data Mining Approach. Biomed Pharmacol J 2017;10(1). Available from: http://biomedpharmajournal.org/?p=14056 |
Introduction
Cancer is a leading cause of death worldwide, with 8.2 million deaths in 2012 out of estimated 14.1 million new cancer cases occurred. Lung, female breast, colorectal and stomach cancers accounted for more than 40% of all cases diagnosed worldwide. In men, lung cancer was the most common cancer (16.7% of all new cancer cases in men). Breast cancer was by far the most common cancer diagnosed in women (25.2% of all new cancer cases in women) [2]. Data mining can be applied in health care industry because there is a huge amount of clinical data available for analysis. Although a small part of data out of huge available data is useful for cure and prevention, but still this small part is large enough to be analyzed by data mining techniques [1]. Every year more than half of all cancer deaths are due to lung, stomach, liver, colorectal and female breast cancer [2, 3]. World Cancer trends declared approximately 44% of cancer cases and 53% of cancer deaths occur in countries at a low or medium level of Human Development Index (HDI) [4]. The same report estimated Healthy Years of Life Lost (HYLL) was 169.3 million years globally because of cancer in 2008. Colorectal, lung and female breast cancer were the main contributors in most regions of the world, explaining 18%-50% of the total healthy years lost [5]. The burden as well as increasing trend in breast cancer was comparatively higher in prevalence, incidence, mortality and healthy years of life lost aspects [2, 10]. This is further suggested that female breast cancer incidence may increase (2%) as per the projection for 2030 than compared to the previous report especially in high and very high HDI areas [6].
Methods
The Decision Tree procedure creates a tree-based classification model [11]. It classifies cases into groups or predicts values of a dependent (target) variable based on values of independent (predictor) variables. The procedure provides validation tools for exploratory and confirmatory classification analysis. This paper considers the results of prediction for breast cancer survivability in data mining approach using the efficient Decision Tree algorithm [15].
Chi-squared Automatic Interaction Detection (CHAID) and Classification And Regression Trees (CART) are the most important growing methods available under this algorithm in which we get different tree structures [14]. Decision Tree models appear as a set of “if-then” rules which shows information in a complete form for several cases. Since the inputs of this data are categorical, the result is a categorical tree too. Out of all decision tree algorithms, CHAID is suitable for categorical large data set [7]. Though they are working for the same purpose, there are number of differences between these two tree structures. CHAID gives a better tree than compared to CART particularly for a large sample [7]. CHAID [8] was intended to work with categorical and discretized targets and it uses multi-way splits; it means that the current node is split into more than two nodes by default. The CHAID is a form of analysis that determines how variables explain the outcome of the given dependent variable. For SEER [12] breast cancer data common statistical tools such as regressions are not applicable, CHAID is the perfect tool to discover the relationship between variables, since it is more appropriate for analyzing the categorical data[7,13].
Data
“Surveillance, Epidemiology and End Results” abbreviated as SEER [12], is a National Cancer Institute (NCI) which is considered as a main source of cancer statistics in U.S.A [13] and has information on incidence, prevalence, survival and mortality of the US population .It was established by the American government to collect information of cancer patients in the country. Legally, all of the hospitals, clinics, laboratories, surgery sections and organization related to diagnosis and treatment of cancer have to report the information to this institute, which will be inserted in to the SEER database after evaluation. SEER database (1972-2012) has incidence information of all cancer types, in this paper we analyze the 740506 records of breast cancer patients along with 146 features.
Data Grounding and Attribute Selection
The attribute selection plays an important role in identifying parameters that are important and significant for appropriate analysis of the breast cancer data. All attributes related to non-cancer and socio demography are removed, only seven major attributes [‘AGE_DX’ (Age at Diagnosis), SEX’, ‘GRADE’ (Tumour grade), ‘NO_SURG’, ‘RADIATN’, ‘FIRSTPRM’, ‘STAT_REC’, ] have been identified for this analysis. Pre-processing is used to transform the raw data into an organized format which makes it possible to apply data mining techniques and as well to improve the quality of data [9]. The selected attributes are listed under the following four categories of features: Demographic attributes (AGE at diagnosis, SEX); Recognition attributes (Tumour GRADE, FIRSTPRM (presence of primary nodes)); Treatment attributes (RADIATN, NO_SURG (status of surgery done); Result attribute (STAT-REC (patient’s life status).
Following are the pre-processing steps to select the appropriate records for the analysis. (Figure 1).
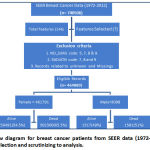 |
Figure 1: Flow diagram for breast cancer patients from SEER data (1972-2012) and its process for selection and scrutinizing to analysis. |
Patient records which are marked as unknown and have missing information are removed irrespective of the selected attributes. Records which has values 5-patient dies before surgery, 7-patient or patient’s guardian refused, 8-recommended, unknown if done and 9-unknown if surgery performed of the attribute NO_SURG are removed . Also records which are having values 7- patient or patient’s guardian refused radiation therapy, 8-radiation recommended, unknown if administered and 9-unknown if radiation administered for “RADIATN” has been removed . The values of “NO_SURG” feature is modified as all the values except “1” (No surgery done) are coded as “0” (zero) to mark the patient has undergone surgery and the reason for not undergoing surgery is ignored . In RADIATN “0” (zero) means “No Radiation given”, and any form of radiation therapy given is marked as”1”. The attribute STAT_REC specifies that the patient is alive or not, if “1” the patient alive and “0” (zero) indicates the death. After the data cleansing and recoding we arrived with 464889 records for this analysis out of which 461791 is Female records and 3098 male records.
Result and Discussion
STAT-REC (patient’s life status) is the categorical dependent variable with death is the defined target category for this model. The decision tree analysis is done using the growing method CHAID for both sex and they are merely compared in the aspect of risk estimation. The Automatic setting limits for the tree levels for the Growing Method CHAID has three levels by default. But it is customized for 15 levels ultimately tree depth is achieved in 7 levels. The Growth Limits allows limiting the number of levels in the tree and controlling the minimum number of cases for parent and child nodes. The Minimum Cases in Parent Node is 100 and 50 for child node. The features included as independent factors in the analysis are “age_dx”, “tumor_grd”, “no_surgery”, “radiatn”, and “primnodes”. The model summary provides broad information about the specifications used to build the model and the resulting model.
The distribution Characteristics of the seven features of breast cancer patients have been presented for both gender with proportions calculated based on the event of death which is the target category for the entire analysis (Table 1). The age has been classified automatically based on the analysis of decision tree with the growing method CHAID. There are nine groups and age group <65 years have high risk of deaths among breast cancer in women. 71.6% deaths occurred in female breast cancer under the age group of <65 and below. The risk has been reduced when age increases especially among female. Up to tumour grade 3 have high impact for risk prediction irrespective of any gender. The death rate is very low when they are in the grade 4. The death rate is very high when surgery not done in either of these groups. The radiation has some impact on death rate when they are not administered . The absence of first primary node has more than 72% of death rate in either group than compared to the cases with presence of first primary node.
Table1: Distribution of Characteristics about seven features of breast cancer patients in both the gender with proportions calculated based on the event of outcome
| Alive | Dead | ||||||||
| Male | Female | Male | Female | ||||||
| N | % | N | % | N | % | N | % | ||
| Sex | 1517 | 49 | 159491 | 34.5 | 1581 | 51 | 302300 | 65.5 | |
| Age(yrs) | |||||||||
| <42 | 22 | 1.5 | 10816 | 6.8 | 85 | 5.4 | 32943 | 10.9 | |
| 42-52 | 86 | 5.7 | 18506 | 11.6 | 249 | 15.7 | 77954 | 25.8 | |
| 52.1-56 | 94 | 6.2 | 9423 | 5.9 | 154 | 9.7 | 33847 | 11.2 | |
| 56.1-60 | 114 | 7.5 | 10922 | 6.8 | 161 | 10.2 | 33079 | 10.9 | |
| 60.1-65 | 168 | 11.1 | 16376 | 10.3 | 276 | 17.5 | 38777 | 12.8 | |
| 65.1-69 | 175 | 11.5 | 15156 | 9.5 | 166 | 10.5 | 25797 | 8.5 | |
| 69.1-74 | 246 | 16.2 | 21823 | 13.7 | 196 | 12.4 | 25102 | 8.3 | |
| 74.1-80 | 294 | 19.4 | 26582 | 16.7 | 165 | 10.4 | 21233 | 7.0 | |
| >80.0 | 318 | 21.0 | 29887 | 18.7 | 129 | 8.2 | 13568 | 4.5 | |
| Tumour GRADE | |||||||||
| Grade1 | 157 | 10.3 | 22174 | 13.9 | 266 | 16.8 | 65869 | 21.8 | |
| Grade2 | 708 | 46.7 | 62067 | 38.9 | 802 | 50.7 | 127842 | 42.3 | |
| Grade3 | 582 | 38.4 | 67154 | 42.1 | 490 | 31.0 | 98496 | 32.6 | |
| Grade4 | 70 | 4.6 | 8096 | 5.1 | 23 | 1.5 | 10093 | 3.3 | |
| SURGRY | |||||||||
| Done | 93 | 6.1 | 11034 | 6.9 | 32 | 2.0 | 6199 | 2.1 | |
| Not_done | 1424 | 93.9 | 148457 | 93.1 | 1549 | 98.0 | 296101 | 97.9 | |
| RADIATN | |||||||||
| Given | 1146 | 75.5 | 104318 | 65.4 | 1181 | 74.7 | 138333 | 45.8 | |
| Not_given | 371 | 24.5 | 55173 | 34.6 | 400 | 25.3 | 163967 | 54.2 | |
| FIRSTPRM Node | |||||||||
| Present | 329 | 21.7 | 33468 | 21.0 | 405 | 25.6 | 84584 | 28.0 | |
| Absent | 1188 | 78.3 | 126023 | 79.0 | 1176 | 74.4 | 217716 | 72.0 | |
CHAID analysis resulted with 358 nodes and 195 terminal nodes in 7 levels of tree depth. The highest death rate is 95.1% for the node 338 and the lowest death rate is 3.6% for the node 210 which has the path for highest death rate among breast cancer for female (Table 3).
The complete Decision Tree is huge in size and unable to present it in a single page so, the image of the tree is given as an attachment , for presentation purpose the trimmed tree is given as Figure3.
Age is one the most important predictors for risk of death in breast cancer patients and it identifies who are likely to be members of high risk and low risk groups in accordance with other features (Figure2). When patients falls in the age group of 42-52 years with any grade of tumour size, no primary nodes, without radiation and underwent surgery for breast cancer has been classified as high risk death rate group among the breast cancer patients(Figure 3). But the upper age group (>80 years) with any grade of tumour size, no primary nodes, even without radiation are being secured from high risk of death rate.
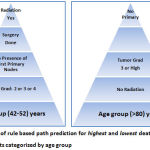 |
Figure 2: Illustration of rule based path prediction for highest and lowest death rate among female breast cancer patients categorized by age group |
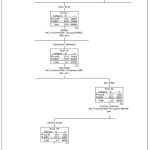 |
Figure 3: Trimmed tree using CHAID which shows the path of high risk female breast cancer patients. |
The surgery status is also plays an imperative role for increasing the death rate among the age group of 42-52 years. The estimated risk for this group is 27.3% and the overall correct classification is 72.7%. Amazingly the same trend is being reflected for the opposite gender with breast cancer. In fact it is slightly higher risk estimation than the female group with breast cancer. The risk estimation for male breast cancer group is 35.1% and the reciprocal is the correct classification of the model. The age group (<42) is identified as the high risk group for male breast cancer patients.
The similar information has been confirmed with other sources using logistic regression. The table 2 clearly conveys the confirmation through the adjusted odds ratio (AOR) for female and male respectively. The AOR have been arrived based on the assumption of lesser risk of death for higher age group and the same is considered as reference group. It clearly conveys the risk reduction when age increases (Table 2). Also the risk is higher when patients fall in the grade1 irrespective of any gender. In general, the comparison of risk between male and female group , the AOR for male is increases convincingly compared to female group.
Table2: AOR estimation for Female and Male breast cancer patients
| Attributes | Female | Male | ||||
| AOR | Lower | Upper | AOR | Lower | Upper | |
| Age (>80-Ref) | ||||||
| Age (<42) | 8.37 | 8.11 | 8.64 | 11.49 | 6.79 | 19.47 |
| Age (42.0-52.0) | 10.01 | 9.74 | 10.29 | 8.36 | 6.00 | 11.63 |
| Age (52.1-56.0) | 8.28 | 8.01 | 8.54 | 4.60 | 3.28 | 6.46 |
| Age (56.1-60.0) | 6.79 | 6.58 | 7.01 | 3.81 | 2.75 | 5.26 |
| Age (60.1-65.0) | 5.11 | 4.97 | 5.26 | 4.59 | 3.43 | 6.13 |
| Age (65.1-69.0) | 3.53 | 3.42 | 3.64 | 2.50 | 1.85 | 3.38 |
| Age (69.1-74.0) | 2.32 | 2.26 | 2.39 | 2.07 | 1.56 | 2.76 |
| Age (74.1-80.0) | 1.60 | 1.56 | 1.65 | 1.39 | 1.04 | 1.84 |
| GRADE (4-Ref) | ||||||
| GRADE(1) | 3.68 | 3.55 | 3.82 | 5.98 | 3.48 | 10.30 |
| GRADE(2) | 2.31 | 2.24 | 2.39 | 3.98 | 2.39 | 6.64 |
| GRADE(3) | 1.37 | 1.33 | 1.42 | 2.89 | 1.73 | 4.84 |
| NO_SURG(Surgery Done) | 2.76 | 2.67 | 2.86 | 2.88 | 1.87 | 4.44 |
| RADIATN(Given) | 1.94 | 1.91 | 1.96 | *1.01 | 0.84 | 1.20 |
| FIRSTPRM(Presence) | 0.51 | 0.50 | 0.52 | 0.63 | 0.52 | 0.76 |
*Non Significant
Table 3: Illustration of node Performance along with percentage of gain, response and index for Female breast cancer patients
| Node | Gain | Response | Index | |||
| Node | N | % | N | % | % | % |
| 338 | 931 | .2% | 885 | .3% | 95.1% | 145.2% |
| 227 | 4618 | 1.0% | 4377 | 1.4% | 94.8% | 144.8% |
| 240 | 3709 | .8% | 3503 | 1.2% | 94.4% | 144.3% |
| 38 | 865 | .2% | 814 | .3% | 94.1% | 143.8% |
| 228 | 4463 | 1.0% | 4176 | 1.4% | 93.6% | 142.9% |
| 127 | 459 | .1% | 427 | .1% | 93.0% | 142.1% |
| 125 | 4728 | 1.0% | 4386 | 1.5% | 92.8% | 141.7% |
| 226 | 2054 | .4% | 1895 | .6% | 92.3% | 140.9% |
| 101 | 1768 | .4% | 1622 | .5% | 91.7% | 140.1% |
| 141 | 477 | .1% | 437 | .1% | 91.6% | 139.9% |
| 224 | 1007 | .2% | 917 | .3% | 91.1% | 139.1% |
| 60 | 5023 | 1.1% | 4559 | 1.5% | 90.8% | 138.6% |
| 344 | 2604 | .6% | 2354 | .8% | 90.4% | 138.1% |
| 339 | 3387 | .7% | 3052 | 1.0% | 90.1% | 137.7% |
| . | . | . | . | . | . | . |
| . | . | . | . | . | . | . |
| . | . | . | . | . | . | . |
| 207 | 7165 | 1.6% | 1081 | .4% | 15.1% | 23.0% |
| 311 | 471 | .1% | 71 | .0% | 15.1% | 23.0% |
| 175 | 228 | .0% | 33 | .0% | 14.5% | 22.1% |
| 307 | 175 | .0% | 25 | .0% | 14.3% | 21.8% |
| 231 | 80 | .0% | 11 | .0% | 13.8% | 21.0% |
| 139 | 51 | .0% | 6 | .0% | 11.8% | 18.0% |
| 317 | 163 | .0% | 15 | .0% | 9.2% | 14.1% |
| 327 | 154 | .0% | 14 | .0% | 9.1% | 13.9% |
| 191 | 575 | .1% | 52 | .0% | 9.0% | 13.8% |
| 155 | 73 | .0% | 4 | .0% | 5.5% | 8.4% |
| 205 | 633 | .1% | 23 | .0% | 3.6% | 5.6% |
It is also confirmed with results of risk estimation arrived using decision tree analysis. The main table includes the percentage gain, the response percentage, and the index percentage (lift) by node (Table 3). The tree has 358 nodes with 195 terminal nodes. It is being produced with nodes closer to highest and lowest response rate and in between is restricted purposely for the presentation aspect. Gain is the percentage of total cases in the target category (death due to breast cancer) in each node. Index is the ratio of the node response percentage for the target category compared to the overall target category response percentage for the entire sample. Response is the percentage of cases in the node in the specified target category. The highest response rate is 95.1% for the target category of death due to breast cancer among women for the node 338. It (Table 3) retains the range of response rate up to 90.1% and above and 15.1% and below for highest and lowest response rate respectively. This node directs evidently the path for prediction of highest death rate and confirming with sources provided in Table1. , that is the highest death rate (25.8%) for breast cancer among female have occurred in the age group of (42-52). The lowest death rate is also confirmed with sources provided (Table 1). When this is being looked into the aspect of decision tree course of action it further strengthens the findings.
Conclusions
Result shows the methods used to achieve this finding are presumptuous as an additional as well as strength between the existing statistical procedures applied. Also it suggest that the decision tree approach is giving accumulation or increase the accuracy by means of discovering hidden information through data mining concept. The contribution of CHAID is enormous for discovering the masked pattern to get an accurate prediction. The higher death rate for breast cancer among female between age 42 and 52 is 25.8% (Table 1) whereas the decision tree achieved enhanced prediction with highest death rate for the same group about 95.1%. The differences in prediction of accuracy between the actual and decision tree approach is extremely elevated which is unthinkable.
Acknowledgement
We sincerely acknowledge and thank the National Cancer Institute, USA for permitting us to use the SEER cancer database.
References
- Illya Mowerman, “Data mining in the health care industry” (2007). Dissertations and Master’s Theses (Campus Access). Paper AAI3284828. University of Rhode Island,
- International Agency for Research on Cancer, World Cancer Factsheet. World Health Organization, www.cancerresearchuk.org, 2014.
- Ferlay J, Soerjomataram I, Ervik M, Dikshit R, Eser S, Mathers C, Rebelo M, Parkin DM, Forman D, Bray, F. GLOBOCAN (2012) v1.0, Cancer Incidence and Mortality Worldwide: IARC CancerBase No. 11 [Internet]. Lyon, France: International Agency for Research on Cancer; 2013. Available from: http://globocan.iarc.fr, accessed on 18/12/2013.
- Human Development Report. (2013). United Nations Development Programme (UNDP) New York.
- Soerjomataram I, Lortet-Tieulent J, Parkin DM, Ferlay J, Mathers C, Forman D, Bray F.( 2012). Global burden of cancer in 2008: a systematic analysis of disability-adjusted life-years in 12 world regions. Lancet; 380:1840–1850.
- Bray F, Jemal A, Grey N, Ferlay J, Forman D.( 2012). Global cancer transitions according to the Human Development Index (2008-2030): a population-based study. Lancet Oncol; 13:790-801.
- Hastie Trevor, Tibshirani Robert, Friedman Jerome. The element of statistical learning Data Mining, Inference, and Prediction, Second Edition, Springer: 2013.
- Kass GV.( 1980). An exploratory technique for investigating large quantities of categorical data. Appl Stat.; 29:119–127.
- J. Han and M. Kamber , – “ Data Mining; Concepts and Techniques”, Morgan Kaufmann Publishers, 2000.
- De Martel C, Ferlay J, Franceschi S, et al. Global burden of cancers attributable to infections in 2008: a review and synthetic analysis. Lancet Oncol 2012; 13:607-15.
- Mendonça LF,Vieira SM,Sousa JMC(2007) Decision tree search methods in fuzzy modelling and classification. Int J Approximate Reason 44(2): 106–123.
- Surveillance, Epidemiology, and End Results (SEER) Program (www.seer.cancer.gov) Research Data (1973-2013), National Cancer Institute, DCCPS, Surveillance Research Program, Surveillance Systems Branch, released April 2016, based on the November 2015 submission.
- Liu Ya-Qin, Wang Cheng, Zhang Lu, “Decision tree based predictive models for breast cancer survivability on imbalanced data ”, IEEE 2009.
- Babu C Lakshmanan., Valarmathi S., Ponnuraja C. (2015). Data Mining with Decision Tree to Evaluate the Pattern on Effectiveness of Treatment for Pulmonary Tuberculosis: A Clustering and Classification Techniques. Scientific Research Journal; 3(6), 43-48.
- IBM SPSS Decision Trees 21, IBM Corporation 1989, 2012.
- Mary K. Obenshain, MAT,(2004) Infect Control Hosp Epidemiol 2004;25:690-695

