
Manuscript accepted on :January 24, 2017
Published online on: --
Plagiarism Check: Yes
Anuranjeeta1, K. K. Shukla2, Anoop Tiwari3 and Shiru Sharma1
1School of Biomedical Engineering.
2Department of Computer Science and Engineering, Indian Institute of Technology, Banaras Hindu University.
3Department of Computer Science, Institute of Science, Banaras Hindu University Varanasi, Uttar Pradesh-221005, India.
Corresponding Author E-mail: anuranjeeta.rs.bme11@itbhu.ac.in
DOI : https://dx.doi.org/10.13005/bpj/1116
Abstract
This paper presents the automated detection and classification of histopathological images of cancer cells using morphological features. The manual assessment of disease is time-consuming and varies with the perception and the level of expertise of the pathologists. The judgment is based on the tissue structures, distribution of cells in tissue and the irregularities of cell shape and size. To overcome the limitation of manual diagnosis, a computer aided diagnosis based on the morphological features has been implemented for accurate and reliable detection of cancer. A dataset of 70 histopathological images of non-cancerous and cancerous tissues are randomly selected. The proposed work aims at developing the technique that uses reliable quantitative measures for providing objective and reproducible information complementary to that of a pathologist.
Keywords
Image Processing; Classification; Fiji; Morphological; Feature; Cancer; Weka
Download this article as:| Copy the following to cite this article: Anuranjeeta A, Shukla K. K, Tiwari A, Sharma S. Classification of Histopathological images of Breast Cancerous and Non Cancerous Cells Based on Morphological features. Biomed Pharmacol J 2017;10(1) |
| Copy the following to cite this URL: Anuranjeeta A, Shukla K. K, Tiwari A, Sharma S. Classification of Histopathological images of Breast Cancerous and Non Cancerous Cells Based on Morphological features. Biomed Pharmacol J 2017;10(1) Available from: http://biomedpharmajournal.org/?p=13448 |
Introduction
The extensive use of computer aided diagnosis (CAD) these days can be traced back to the appearance of digital histopathology. Now a day, CAD has become a part of routine clinical detection methods for cancer diagnosis using digitized histological images at various screening centre and hospitals and hence it has become one of the most important key research subjects in histopathological imaging and diagnostic1. There is an imperative need for CAD to minimize the human error. Cancer is a vital health issue, which can cause the death of the living being. In 2015 an average 1,658,370 cancer cases along with 589,430 cancer deaths were reported in the US2. Among the developing countries, India suffers leading cause of death from cancer. These include mostly cervix, breast, skin and oral cancer. Cancer begins, when a gene in a cell becomes abnormal, and the cell starts to grow and divide in an uncontrolled manner. Cancerous cells replicate much faster than normal cells. Cells divide and multiply to form a tumor that may be cancerous and non-cancerous3. Cellular morphology is one of the best and preferred methods in identifying the abnormalities and the physiological state of the cells present in the tissue. Several biological functions seem to be related to significant changes in the geometry of the cells and nuclei4. Human error occurs due to several reasons while observing the image overlapping, blurriness, artifacts, weak boundary detection, and uneven dying. Visualizing the cells particularly consists of observing minute structures, composition, functions, distribution of cells and regularities of cell shapes across the tissue which helps the pathologist to make a decision of cells whether it is cancerous and non-cancerous. This whole process is very time consuming and cumbersome that requires much experience5. To overcome these problems, CAD is an opinion to the pathologist for the development of automation in biological image enhancement, feature extraction and classification for disease identification. Therefore, automation prevails over limitations of manual microscopy based detection method to help pathology practice. Several images analysis software like Cell profiler, Mac Biophotonics Image J and Scion has played a major role in the analysis of cellular images. CAD has been successfully applied in breast cancer, cervical cancer, prostate cancer and lung cancer analysis6. Arevalo et al.7 have presented a review on automatic image analysis tasks and its current trends like digital pathology in histopathology image. Dermir and Yerner8 presented a cellular level automatic diagnosis of biopsy image using image processing techniques. Singh et al.9 applied contrast limited adaptive histogram equalization (CLAHE) methods in biopsy image of cancer cells detection and classification. Wilkinson et al.10 proposed segmentation method using robust automatic threshold selection (RATS) for microbes’ image analysis, in that they have reported that RATS is suitable for thresholding a noisy image with the variable background. He Le et al.11 presented an algorithm for Gaussian mixture modeling thresholding for hematoxylin and eosin stained histology image segmentation. Tissue constituents such as nuclei, stroma, and connecting contents from the background are extracted using these models. Bredfeldt et al.12 have demonstrated a protocol that allowed consistent scoring throughout large patient cohorts in two steps; the first step involves the use of Trainable Weka Segmentation (TWS) Image J plugin for finding epithelial cell nuclei and other involves the application of a cascaded matched filter, threshold operation to identify clusters and boundaries. Sheha et al.13 difference between Malignant Melanoma and Melanocytic Nevi based classifications are proposed on gray level co-occurrence matrix (GLCM) by using multi layer perceptron (MLP). For discrimination of melanocytic skin tumors, texture analysis can be used for high accuracy. Amaral et al.14 presented a computational pipeline for automatically classifying and scoring breast cancer TMA spots mapped onto an ordinal scale used by pathologists. MLP classifier is compared with support vector machines and latent topic models for spot classification and with Gaussian process ordinal regression and linear models for scoring. Landwehr et al.15 have developed algorithms for accurate and compact classifiers by evaluating the performance of logistic modal tree (LMT) on 36 datasets collected from the UCI repository. Zhang et al.16 worked on breast cancer images with combined multiple features using the curvelet transform, statistics of completed local binary patterns (CLBP), and GLCM with a classifier Random Subspace Ensemble (RSE), with classification rate 95.22%. Nguyen et al.17 proposed a method, to calculate the tubule percentage (TP), i.e., the ratio of the tubule area to the total glandular area for 353 Hematoxylin and Eosin images of the three TSs, and plot the distribution of these TP values. This plot shows the clear division among these three scores, suggesting that the proposed algorithm is useful in distinguishing images of these TSs by using a random forest classifier. George et al.18 evaluated datasets 92 fine needle aspiration cytology (FNAC) images to classify the benign and malignant of breast tumor. The predictive ability of support vector machine (SVM) and probabilistic neural networks (PNN) are stronger than the MLP using back-propagation algorithm and learning vector quantization (LVQ).
The aim of present work is to develop an automated system for detecting the cancer cells using shape and morphological features extracted from the segmented images. Segmentation is done using mixture modeling thresholding (MMT), simple interactive object extraction (SIOX), RATS, and TWS methods. Classification is done by MLP, LMT, sequential minimal optimization (SMO), Naïve Bayes, Random Forest, Rotation Forest, J-Rip and PART which is trained using histopathology images of cancerous and non-cancerous categories. The efficiency of these classifiers is compared to each other for the identification of best classifier.
Materials and Methods
Image Acquisition
Breast cancer cellular datasets used in present work has been obtained from www.bioimage.ucsb.edu. The study consists of 70 histopathology images (35 non-cancerous and 35 cancerous). Structural and intensity based 16 features are acquired to classify non-cancerous and cancerous cells. The images are hematoxylin and eosin stained to visualize various parts, cellular structures such as cells, nuclei, and cytoplasm of the tissue. The nuclei are stained blue with hematoxylin while cytoplasm and extra-cellular components are in pink due to eosin staining. Flowchart for the present work is shown in figure 1 which describes basic steps involved in the cells morphology image analysis.
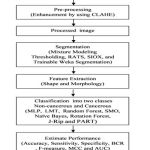 |
Figure 1: Schematic flowchart of the proposed method
|
Image Pre-Processing
In histopathology images, the blurriness, artifacts, weak boundary detection and overlapping problem occurred due to uneven staining of the slide as a result of human error. To eradicate these types of irregularities or uneven staining, the CLAHE method is proposed. CLAHE algorithm improves the image contrast by improving the local contrast present in an image and also by enhancing the weak boundary edges in each pixel of an image through limited amplification19. Digital image processing techniques interpret the result in a much better way than conventional methods. So it is well suited for features enhancement of histopathology images. CLAHE method has been used for pre-processing of images in figure 2.
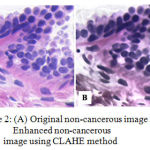 |
Figure 2: (A) Original non-cancerous image and (B) Enhanced non-cancerous image using CLAHE method
|
Segmentation
In digital pathology, segmentation of histopathology sections is a ubiquitous requirement due to the large variability of histopathology tissue. Further machine learning techniques play a vital role in delivering superior performance over standard image processing methods. During image analysis, the segmentation process is an essential domain. It is used to locate objects and boundaries in an image20. The proposed method, pre-processing steps involve, removing noise and enhancing the contrast for segmentation purpose. The basic purpose of segmentation is to extract the important features from the image and perceive the information. Selection of appropriate segmentation methods depends on the type of features that has to be maintained for detection. Segmentation methods like MMT, SIOX, RATS, and TWS has proposed from Fiji open access free software for image analysis21. Mixture modeling algorithm uses Gaussian model to separate the histogram of an image into two Gaussian classes based on average, standard deviation and thresholding22. SIOX is a method used for extracting foreground information from a colored (RGB) image23. RATS measure the threshold map of an image based on pixels value and the corresponding gradients value24. TWS is a pixel-based segmentation method which combines machine learning algorithms with selected set of image features25.
The performance of various segmentations is quantified regarding the global consistency error (GCE), variation of information (VI) and probabilistic rand index (PRI) of the segmented image with the ground truth image. The brief description of these performance measures is as follows.
GCE is calculated as follows: let us assume segments 𝑠𝑖 and 𝑔𝑗 contain a pixel, say 𝑘, such that 𝑠 ϵ 𝑆, 𝑔 ϵ 𝐺 where 𝑆 represents the set of segments that are generated by the segmentation algorithm being evaluated and 𝐺 denotes the set of reference segments. To start with, a measure of local refinement error is estimated using Eq. (1) and then local and global consistency errors are computed, where denotes the set of difference operation and 𝑅 (𝑥,𝑦) represents the set of pixels corresponding to a region x that includes pixel 𝑦. Using eq. (2) GCE forces all local refinements in the same direction26 which are computed using Eq. (2) where 𝑛 denotes the total number of pixels of the image. GCE quantify the amount of error in the segmentation (0 signifies no error and 1 indicates no agreement):
VI is a measure of the distance between two clusters (partitions of elements)27. Clustering with clusters is denoted by a random variable 𝑋, 𝑋 = {1, . . , 𝑘} such that 𝑃𝑖 = |𝑋 𝑖 |/𝑛, 𝑖 ϵ 𝑋, and 𝑛 = Σ𝑖 𝑋𝑖 is the variation of information between two clusters 𝑋 and 𝑌. Thus VI (𝑋, 𝑌) is represented using
VI (𝑋, 𝑌) = 𝐻 (𝑋) = 𝐻 (𝑌) − 2𝐼 (𝑋, 𝑌), (3)
Where 𝐻 (𝑋) is entropy of 𝑋 and 𝐼 (𝑋, 𝑌) is common information between 𝑋 and 𝑌. VI (𝑋, 𝑌) measures reduction in cluster assignment in clustering 𝑋 into the uncertainty of item’s cluster in clustering 𝑌. PRI is the nonparametric measure of goodness of segmentation algorithms28. Rand index between test (S) and ground truth (G) is estimated by adding the number of pixel pairs with the same label and some pixel pairs having different labels in both S and 𝐺 then dividing it by a total number of pixel pairs. Given a set of ground truth segmentations G𝑘, the PRI is estimated using Eq. (4) such that c𝑖𝑗 is an event that describes a pixel pair (𝑖, 𝑗) having the same or different label in the test image test
![]()
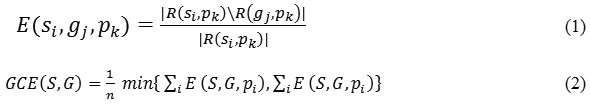
GCE and VI should be low, where as PRI should be high for a better segmented cells in image. The MMT, SIOX, and RATS method have high GCE and VI where as low PRI in comparison to TWS, which shows an edge of proposed TWS method over conventional methods. TWS gives better result which is shown in figure 3(F) for non-cancerous cells and figures 4(F) for cancerous cells because TWS uses random forest machine learning algorithm for image segmentation. There is no overlapping in the cells and shows cells separated well from each other. This is providing the most accurate shape of the cells as compare to other methods.
 |
Figure 3: Segmentation of normal cells from histopathology images by different methods (A) Original image, (B) Ground truth image, (C) MMT, (D) SIOX, (E) RATS, (F) TWS |
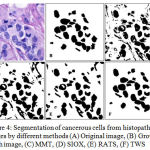 |
Figure 4: Segmentation of cancerous cells from histopathology images by different methods (A) Original image, (B) Ground truth image, (C) MMT, (D) SIOX, (E) RATS, (F) TWS |
The ROI of the segmented histopathology image is compared to ground truth images for the quantitative assessment of different segmentation methods by GCE, VI and PRI, for 25 sample images from histopathology dataset. Hence, TWS is associated with the lower value of GCE and VI and higher value of PRI in comparison to others methods which perform better regarding all parameters as shown in table 1 and graphical representation in figure 5. So it is chosen as the segmentation method in the proposed work for cancer detection from histopathology images.
Table 1: Quantitative comparison of segmentation methods on the basis of average values of 25 images.
| Segmentation Methods | PRI
(Higher better) |
GCE
(Lower better) |
VI
(Lower better) |
| Mixture modeling | 0.95038 | 0.028408 | 0.303852 |
| SIOX | 0.9734 | 0.01608 | 0.209856 |
| RATS | 0.975016 | 0.015312 | 0.201652 |
| Trainable Weka Segmentation. | 0.976124 | 0.013844 | 0.19144 |
PRI- Probabilistic Rand Index, GCE- Global Consistency Error, VI- Variation of Information
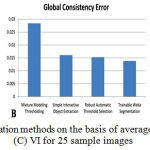 |
Figure 5: Comparison of segmentation methods on the basis of average values of (A) PRI, (B) GCE and (C) VI for 25 sample images |
Feature Extraction
Image morphology is a very powerful tool for analyzing the shapes of the objects and to extract the image features, which are necessary for object recognition29. The most significant portion of this work is the computation of features. Morphological and shape based features have been extracted after segmentation of image for further classification purpose. These features provide information regarding the size and shape of cells30. TWS method is considered for features extraction from the segmented cells of the images as shown in figure 3(F) and 4(F). Total 16 features have been used in this paper. The quantification of these features helps to differentiate the cancerous cells from non-cancerous cells. The features used in this paper are explained from F1 to F 16 in table 2. count, total area, average size, area fraction, perimeter, major axis length, minor axis length, angle, circularity, solidity, feret, feret X, feret Y, feret angle, min feret, and integrated density.
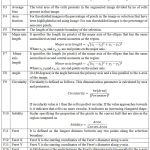 |
Table 2: Description of morphological features |
Classification
Classification of non-cancerous and cancerous cells can be done based on the extracted features. Factors such as staining, artifact, noise, and blurriness cause variation in the image and result in misclassification. Hence, a good classifier should be capable of overcomes these flaws31. Moreover, the choice to classifier must be made by fast computation and proficient enough to meet good classification. Experiments are carried out using the Weka data mining for classification purpose. Supervised machine learning approaches have been used on the dataset of cancerous and non-cancerous histopathology images for classification. In this work 16 features of cells are extracted. The features obtained are the area, perimeter, major axis, etc. After features extraction, a dataset of order 70×16 in arff (attribute relation file format) are prepared. In which 70 instances and 16 attributes are available. For classification, selected features get feed into various classifiers as mention above.
A MLP is a classifier based on feed forward artificial neural network modal that uses back propagation to classify instances. It has much triumphant application in data classification. It consists of different layers having various nodes, which represents directed graph and every layer is fully connected with the further layer. The supervised learning process consists of input data y and target P, requires the objective function (Z, P) in order to evaluate the divergence of the predicted output values, Z=MLP(Y; K) from the observed data values P and employ that evaluation for the convergence towards an optimal set of weights k. Many MLP training algorithms use radiant information whether directly or indirectly 32.
The LMT is a classification replica, which has an affiliated supervised learning algorithm that amalgamates logistic regression (LR) and decision tree learning. It is made of standard decision tree having logistic regression functions at the leave nodes, which is based on the concept of a modal tree. The leave nodes contain two child nodes. One of the child nodes represents left branch and other represent right branch by threshold values. Feature value which is smaller than a threshold is sorted to left and greater than a threshold is sorted to right branch33.
Random forest proposed by Breiman is one type of ensemble learning process for classification and regression. A random forest is a multiway classifier composed of some trees, and each tree grows using randomization. The leaf nodes of each tree are labeled by approximation of the posterior distribution over the classes of image. This test has been done to split the space of data to be classified every interior node that contains a test that best splits it. Classification of an image takes place by sending it down every tree and after that aggregating the reached leaf distributions. Randomness can be inserted at two points during training and testing. This concept is used so that training process can be done by using different data subset. Randomness can be injected in selecting the node tests34. Large scale sample sets are trained that is based on decomposition and iteration. These methods decrease accuracy.
SMO was introduced by John Pitt in 1998 at Microsoft research to solve this problem. It is used to solve the quadratic programming (QP) problem that appears during the training of support vector machines. SMO disintegrates the (QP) problem into sub problems, using Osuna’s theorem which selects to resolve the smallest feasible optimization problem at every step. The smallest feasible optimization problem for the standard SVM-QP problem involves two large range multipliers must obey a linear equality constraint. It selects two langrange multipliers jointly to optimize at every step and tries to find the optimal values for these multipliers. After that updates, the SVM reflects the new optimal values which solves langrange multipliers analytically35.
Rotation forest is assembled with independent decision trees. Each tree is trained with complete information system with a rotated feature space. It uses hyperplanes parallel to the feature axes and a small rotation of the axes guide to diverse trees. Rodriguez et al.36 done the comparative study and proved that rotation forest performs better than random forest, bagging and AdaBoost. It is devised that rotation forest produces more accurate classifiers than AdaBoost which are also more diverse than bagging.
Naïve Bayes classifiers are based on a probabilistic approach for classification hinged on Bufes’theorem with strong independence assumptions between the features. These classifiers are highly scalable. Naïve Bayes nearest neighbor classifier (NBNN) is a not-parametric approach for image classification introduced by Bioman37. J-Rip is used to learn propositional rules by frequently developing rules and trimming them. Precursors are appended greedily until a termination condition is satisfied during the growth phase. After that antecedent is pruned in the upcoming phase on a pruning metric on one occasion, the rule set is generated. Optimization is required for the rules, which are evaluated by some criteria and deleted by their performance against those criteria on randomized data38. PART produces rules through frequently creating decision trees from data. The algorithm acquires a separate and conquers strategy in that. It abolishes instances covered by the ongoing rule set during processing. Essentially a rule is generated by constructing a pruned tree for the present set of instances; the leaf with the maximum coverage is converted into a rule39.
Performance Measure of Classifier
Performance evaluation of each classifier is considered using confusion matrix (2 × 2) of size. The value of True Positive (TP), True Negative (TN), False Positive (FP) and False Negative (FN) is calculated. TP is a condition where the system correctly identifies an abnormality, FN is a condition of system that incorrectly identifies abnormality as normality, TN is a condition where the system correctly identifies normality and FP is a condition where the system incorrectly identifies normality as an abnormality are shown in table 3.
Table 3: The diagram of FP, FN, TP and TN.
| System Decision | |||
| Abnormal
(Cancerous) |
Normal
(Non-Cancerous) |
||
|
Truth of Clinical Situation |
Abnormal | TP | FN |
| Normal | FP | TN | |
The performance parameters like accuracy, sensitivity, specificity, balanced classification rate (BCR), F-measure (F-m), Matthews’ correlation coefficient (MCC) and area under the curve (AUC) are defined to assess the success of the diagnostic system and can be calculated using Eq.(5)-(10).The definition of these performance measures have been illustrated as follows
Accuracy of a classification is technique that depends on the number of correctly classified samples (i.e. true negative and true positive) and calculated as follows

Where N is the total number of sample present in the histopathological images for testing.
Sensitivity is the probability of a positive diagnosis test among persons that have the disease and it is defined as,
![]()
Where, the value of sensitivity ranges between 0 (mean worst) and 1 (best classification) respectively.
Specificity is the probability of a negative diagnosis test among persons that do not have the disease and it is defined as,

Its value ranges between 0 and 1, where 0 and 1, respectively, mean worst and best classification.
BCR is the geometric mean of sensitivity and specificity is measured as balance classification rate. It is represented by
![]()
The F-m is a measure of harmonic mean of precision and recall. It is defined by using
![]()

The value of measure ranges between 0 and 1, where 0 means the worst classification and 1 means the best classification.
MCC is a measure of the distinction of binary class classifications. It can be calculated using the following formula:

Its value ranges between −1 and +1, where −1, +1, and 0, respectively, correspond to worst, best, at random prediction.
AUC is used to measure the performance of the system. The AUC ranges from 0 to 1. The higher AUC is, the greater the probability of a true decision.
Results and Discussion
The proposed methodologies are implemented with image analysis software Fiji (www.fiji.net) for enhancement, segmentation and feature extraction on the dataset of digitized at 40x, magnification on PC with 3.4 GHz Intel Core i7 processor, 2GB RAM, and Windows 8.1 platform. For experimentation purposes, a total of 70 histopathology images are used. The dataset includes cancerous and non-cancerous images. The given methodology for diagnosis of cancer from histopathology images consists of image enhancement, segmentation, feature extraction, and classification. The CLAHE is used for enhancement of histopathology images because it has shown to better results. It highlights the region of interests in the images as tested through experimentation. The original image has been processed through following two preprocessing steps l. contrast enhancement, 2. bilateral filtering to remove the artifact, blurriness that has been introduced during the staining process and to produce a better contrast image of good quality as shown in figure 2.The segmentation has been done by following methods MMT, SIOX, RATS, TWS and afterward there results have been compared. TWS performs better in comparison to other methods as shown in figure 3(F) for non-cancerous cells and figures 4(F) for cancerous cells. In other segmentation techniques cells are overlapping but in TWS, there is no overlapping has been visualized.
In feature extraction phase, various shape and morphology based features as shown in table 2 are extracted from the segmented images. Finally, a 2D matrix of order [70 × 16] feature is formed using all the feature sets, where 70 microscopic images in the dataset and 20 total numbers of features are extracted, further these features used for classification. The experiment is performed using 10-fold cross validation approach. The proposed framework for different histopathology images containing cancerous and non-cancerous features of cells are tested using eight popular classifiers like MLP, LMT, Random forest, Rotation forest, SMO, Naïve Bayes, J-Rip and PART as shown in table 4 and graphical presentation shown in figure 6. Among all these classification methods rotation forest differentiated better between cancerous and non-cancerous cells with the accuracy of 85.7% and with maximum BCR value 0.806. The superiority of rotation forest measure lies in the application of rotation matrix, created by linear transformed subsets.
Table 4: Comparative performances of various classifiers
| Classifier | Accuracy | Sensitivity | Specificity | BCR | F- m | MCC | AUC |
| MLP | 0.800 | 0.829 | 0.771 | 0.701 | 0.794 | 0.601 | 0.892 |
| LMT | 0.829 | 0.914 | 0.743 | 0.710 | 0.813 | 0.667 | 0.920 |
| Random Forest | 0.800 | 0.829 | 0.771 | 0.701 | 0.794 | 0.601 | 0.886 |
| Rotation Forest | 0.857 | 0.829 | 0.886 | 0.806 | 0.861 | 0.715 | 0.884 |
| Naïve Bayes | 0.829 | 0.857 | 0.800 | 0.740 | 0.824 | 0.658 | 0.855 |
| SMO | 0.857 | 0.914 | 0.800 | 0.764 | 0.848 | 0.719 | 0.857 |
| J Rip | 0.829 | 0.857 | 0.800 | 0.740 | 0.824 | 0.658 | 0.821 |
| PART | 0.771 | 0.771 | 0.771 | 0.676 | 0.771 | 0.543 | 0.749 |
BCR- Balanced Classification Rate, F-m- F-measure, MCC- Matthews’s Correlation Coefficient and AUC-Area under the Curve
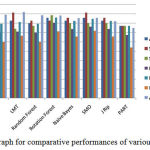 |
Figure 6: Graph for comparative performances of various classifiers |
Features play a major role for the classification purpose. Ranking of the feature was done by their importance for the classification purpose. Ranks of all the features have obtained in the features vector by applying Releif F algorithms40 in weka 3.8. Relief-F is to draw instances at random, compute their nearest neighbours, and change a feature weighting vector to give more weight to features that differentiate the instance from neighbours of different classes. In particular, it tries to get a better estimate of the following probability to allocate as the weight for each feature f.
wf = P (different value of f | different class) – P (different value of f | same class)
In the experiments, the ranks of the features of cells have been investigated, which are given in table 5 and graph in figure 7.
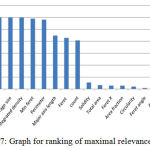 |
Figure 7: Graph for ranking of maximal relevance factor
|
Maximal relevance factor is derived for obtaining feature importance. Based on this factor selection of the important features of cells for the classification is done instead of using a large number of features making the computational work complex.
Conclusion
In this paper, an effective and automatic computer aided technique is proposed and use for pre-processing, segmentation and classification. The cells are classified by shape and morphological features. This work deals issues related with staining and with color consistency problems. These features contributed significantly to realize quantification, statistical analysis, and computer aided diagnosis, interactive systems to detect cancerous and non-cancerous cells. The method has great potential for assisting in the early detection of cancer. This provides good detection performance, where the background is complex and has the similar appearance with the foreground. The developed technique for automated analysis and evaluation of histopathology images will assist the pathologists and reduce the human error. Such automated cancer diagnosis facilitates improved judgment by the pathologist.
Acknowledgments
The first author gratefully acknowledges financial assistance in the form of Rajiv Gandhi National Fellowship.
Conflict of interests
The authors declare that there is no conflict of interests regarding the publication of this paper.
References
- Chen M., Qu A.P., Wang L.W., Yuan J.P., Yang F., Xiang Q.M. and Li Y., New breast cancer prognostic factors identified by computer-aided image analysis of HE stained histopathology images, Scientific reports.,5(2015)
- Siegel R.L., Miller K.D. and Jemal A., Cancer statistics 2015, CA: a cancer journal for clinicians.,65(1),5-29(2015)
- Rubin R., Strayer D.S. and Rubin E., eds., Rubin’s pathology: clinicopathologic foundations of medicine, Lippincott Williams & Wilkins,(2008)
- Chen S., Zhao M., Wu G., Yao C. and Zhang J., Recent advances in morphological cell image analysis, Computational and Mathematical Methods in Medicine., (2012)
- Veta M., Pluim J.P., Van Diest P.J. and Viergever M., Breast cancer histopathology image analysis: A review, Biomedical Engineering IEEE Transactions on.,61(5),1400-1411(2014)
- Zhang X., Liu W., Dundar M., Badve S. and Zhang S., Towards large-scale histopathological image analysis: Hashing-based image retrieval, Medical Imaging IEEE Transactions on.,34(2), 496-506 (2015)
- Arevalo J. and Cruz-Roa A., Histopathology image representation for automatic analysis: a state-of-the-art review,Revista Med.,22(2),79-91(2014)
- Demir C., Yener B., Automated cancer diagnosis based on histopathological images: a systematic survey, Rensselaer Polytechnic Institute Tech. Rep,(2005)
- Singh S., Cancer cells detection and classification in biopsy image, International Journal of Computer Applications.,38 (3),15-21(2012)
- Wilkinson M. H., Wijbenga T., De Vries G. and Westenberg M. A., Blood vessel segmentation using moving-window robust automatic threshold selection. InImage Processing, ICIP 2003 International Conference on,IEEE.2,II-1093.(2003)
- He L., Rodney L., Antani S. and Thomas G.R., Local and global Gaussian mixture models for hematoxylin and eosin stained histology image segmentation, International Conference on Hybrid Intelligent Systems.,223–228(2010)
- Bredfeldt J. S., Liu Y., Conklin M.W., Keely P.J., Mackie T.R. and Eliceiri K.W., Automated quantification of aligned collagen for human breast carcinoma prognosis,Journal of pathology informatics.,5(1),28(2014)
- Sheha M.A., Mabrouk M.S. and Sharawy A., Automatic detection of melanoma skin cancer using texture analysis,International Journal of Computer Applications.,42(20),22-26(2012)
- Amaral T., McKenna S.J., Robertson K. and Thompson A., Classification and immunohistochemical scoring of breast tissue microarray spots.IEEE Transactions on Biomedical Engineering.,60(10), 2806-2814(2013)
- Landwehr, N., Mark H., and Eibe F., Logistic model trees, Machine Learning.,59(1-2),161-205(2005)
- Zhang Y., Zhang B., Lu W., Pham T.D., Zhou , Tanaka H., Oyama-Higa M., Jiang X., Sun C., Kowalski J. and Jia X.,. Breast cancer classification from histological images with multiple features and random subspace classifier ensemble, In AIP Conference Proceedings-American Institute of Physics.,1371(1),19(2011)
- Nguyen K., Barnes M., Srinivas C., and Chefd’hotel C., Automatic glandular and tubule region segmentation in histological grading of breast cancer, InSPIE Medical Imaging (94200G-94200G). International Society for Optics and Photonics,(2015)
- George Y.M., Elbagoury B.M., Zayed H.H. and Roushdy M.I., Breast fine needle tumor classification using neural networks,IJCSI International Journal of Computer Science,9(5), 247-56 (2012)
- Zuiderveld K., Contrast limited adaptive histogram equalization, Graphics gems IV, Academic Press Professional, Inc.,474-485(1994)
- Sharma N., Ray A.K., Sharma S., Shukla K.K., Aggarwal L. and Pradhan S., Segmentation of medical images using simulated annealing based fuzzy C Means algorithm, International Journal of Biomedical Engineering and Technology.,2(3),260-278(2009)
- Schindelin J., Arganda-Carreras I., Frise E., Kaynig V., Longair M. and Pietzsch T., Fiji: an open-source platform for biological-image analysis, Nat Methods.,9,676–82(2012)
- Huang Z. K., and Chau K. W., A new image thresholding method based on Gaussian mixture model, Applied Mathematics and Computation,205(2),899-907(2008)
- Friedland G., Jantz K. and Rojas R., Siox: Simple interactive object extraction in still images. In Seventh IEEE International Symposium on Multimedia (ISM’05) IEEE,(7)(2005)
- , Optimizing edge detectors for robust automatic threshold selection, Graph. Models Image Proc.,60: M.H.F.(1998)
- Arganda-Carreras I., Kaynig V., Schindelin , Cardona A. and Seung H.S., Trainable weka segmentation: a machine learning tool for microscopy image segmentation.,(2014)
- Martin D., Fowlkes C., Tal D. and Malik J., A database of human segmented natural images and its application to evaluating segmentation algorithms and measuring ecological statistics, In Computer Vision. ICCV. Proceedings. Eighth IEEE International Conference on.2,416-423(2001)
- Unnikrishnan R., Pantofaru C., and Hebert M., Toward objective evaluation of image segmentation algorithms, Pattern Analysis and Machine Intelligence, IEEE Transactions on, 29,929-944(2007)
- Unnikrishnan R., Pantofaru C. and Hebert M., A measure for objective evaluation of image segmentation algorithms, In: Computer Vision and Pattern Recognition-Workshops, 2005. CVPR Workshops. IEEE Computer Society Conference on 25, 34-34,(2005)
- Zhao M., Chen L., Bian L., Zhang J., Yao C. and Zhang J., Feature Quantification and Abnormal Detection on Cervical Squamous Epithelial Cells, Computational and mathematical methods in medicine.,(2015)
- , Saxena S., Shukla K.K. and Sharma S., Cellular Image Segmentation using Morphological Operators and Extraction of Features for Quantitative Measurement. Biosciences Biotechnology Research Asia.,13(2),1101-1112,(2016)
- Spanhol F., Oliveira L., Petitjean C. and Heutte L., A Dataset for Breast Cancer Histopathological Image Classification.,(2015)
- Silva L.M., de Sá J.M. and Alexandre L.A., Data classification with multilayer perceptrons using a generalized error function, Neural Networks.,21(9),1302-1310(2008)
- Mahesh V., Kandaswamy A., Vimal C. and Sathish B., ECG arrhythmia classification based on logistic model tree, Journal of Biomedical Science and Engineering,2(06),405(2009)
- Breiman L., Random forests, Machine learning.,45(1),5-32(2001)
- Platt J., Sequential minimal optimization: A fast algorithm for training support vector machines., (1998)
- Rodriguez J.J., Kuncheva L.I. and Alonso C.J., Rotation forest: A new classifier ensemble method. IEEE transactions on pattern analysis and machine intelligence,28(10),1619-1630(2006).
- Timofte R., Tuytelaars T. and Van Gool L., Naive bayes image classification: beyond nearest neighbors. InAsian Conference on Computer Vision, Springer Berlin Heidelberg.689-703(2012)
- Cohen W.W., Fast effective rule induction. In Machine Learning: Proceedings of the 12th International Conference, Morgan Kaufmann,115-123(1995)
- Witten I. H. and Frank E., Generating accurate rule sets without global optimization. In Machine Learning: Proceedings of 15th International Conference,San Francisco: Morgan Kaufmann,(1998)
- Kira K., Rendell L.A., A Practical Approach to Feature Selection. In: Sleeman D, Edwards P (eds) Machine Learning Proceedings, Morgan Kaufmann, San Francisco (CA),249-256(1992)

